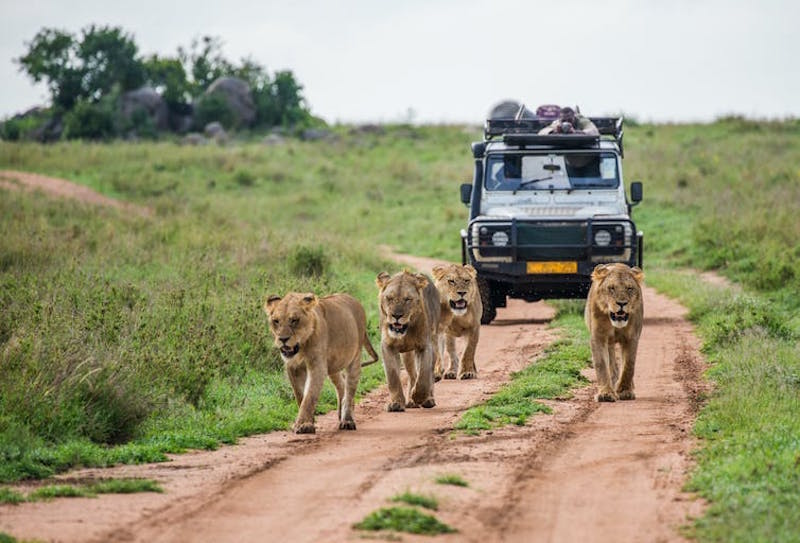
Is intelligent life bad news for diversity? Image via Gudkov Andrey/ Shutterstock.
Matthew Wills, University of Bath
The diversity and complexity of life on Earth is astonishing: 8 million or more living species – from algae to elephants – all evolved from a simple, single-celled common ancestor around 3.5 billion years ago. But does that mean that evolution always and inevitably generates greater diversity and complexity, having a predictable direction?
Charles Darwin identified three ingredients necessary for natural selection to occur. Individuals must be different, so there is variation in the population. They must also be able to pass this variation on to offspring. Finally, individuals must compete for resources that limit the number of offspring they can produce. Individuals with variations that allow them to obtain more resources are likely to produce more offspring like themselves.
Evolution also depends on context and environment, which notoriously change constantly in unpredictable ways. For example, fishes who start living and evolving in unlit caves often lose their eyes, because the costs of developing them outweigh their advantages.
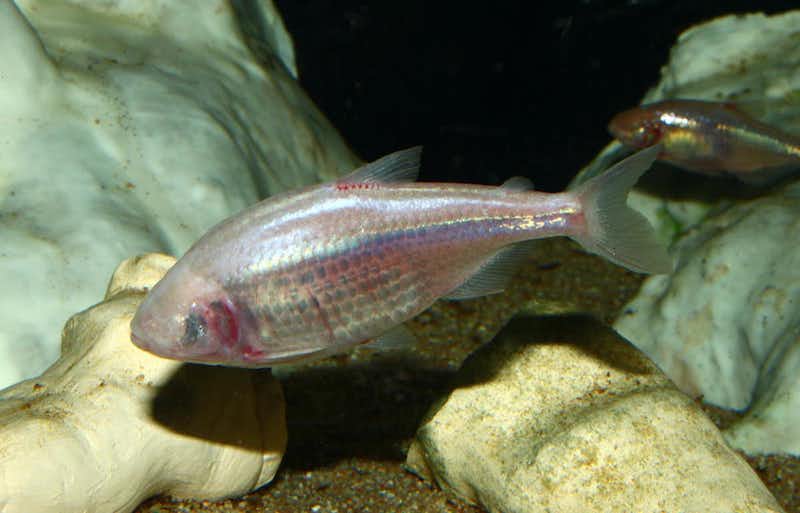
Blind cave fish. Image via wikipedia
So natural selection operates from one generation to the next. It cannot plan ahead or have a goal. In addition, not all evolutionary change is a response to selection, but can be neutral or random. It is not even guaranteed to produce more species, since evolution can occur in a single lineage and this can go extinct at any time. How can we reconcile such an aimless process with the bewildering diversity and complexity we see?
Ecological influence
Ecology and evolution are two sides of the same coin. The environment is not just the physical surroundings of an organism, but also the other biological species with which it interacts.
We can see this environmental interaction deep in the history of life. For billions of years, organisms were “stuck” as single cells within the seas. Several groups independently evolved multi-cellularity (perhaps 25 times). But the first animals, plants and fungi with complex development, different tissues and organs only appeared around 540 million years ago, with the Cambrian “explosion” of diversity.
This may have been triggered by increased levels of oxygen in the oceans, which was, in turn, the result of photosynthesis – the process by which plants and other organisms convert sunlight into energy while releasing oxygen – in much simpler forms of life over millions of years.
Once animals had attained greater size and evolved guts, hard parts, jaws, teeth, eyes and legs, complex food webs became possible – along with “arms races” between predators and prey. Groups with adaptations that enabled them to live on land opened up even more opportunities. Once out of the bag, these innovations were difficult to “uninvent” – promoting diversity.
The only diagram in Darwin’s On the Origin of Species shows species splitting through time. If more species originate than go extinct, then species richness increases. Darwin wondered whether ecological space might simply “fill up” one day.
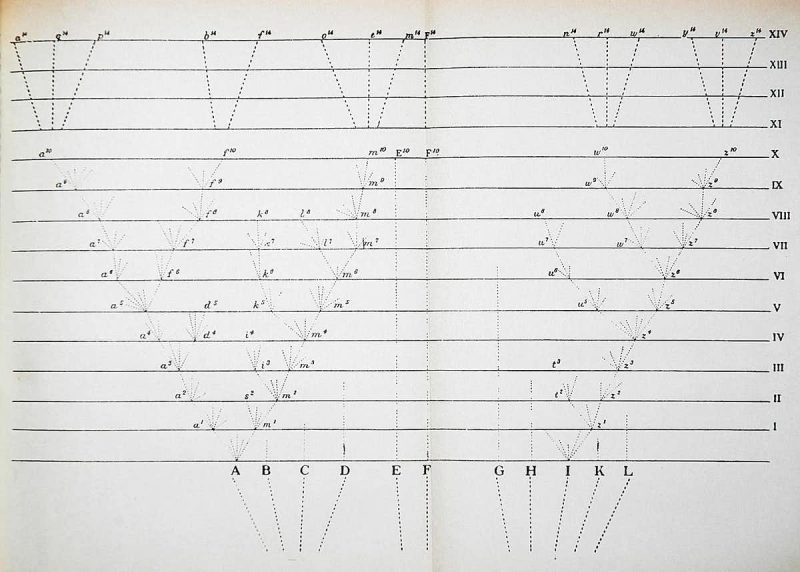
Diagram from On the Origin of Species. Image via Wikipedia.
But so far as we can tell, the species count has been increasing for most of the last 250 million years. Even past natural mass extinctions were only temporary setbacks that may have created even more opportunities for diversity in the long run.
Variation is not random
As organisms evolve more complicated systems of development, they may, however, become less able to modify certain aspects of their anatomy. This is partly because genes, tissues and organs often have several different functions, so it may become difficult to change one for the better without accidentally “breaking” something elsewhere.
For example, nearly all mammals – from giraffes to humans – are stuck with just seven neck bones. Whenever different numbers develop or evolve, they bring other anatomical problems. Birds are entirely different, and seem to evolve new numbers of neck vertebrae with remarkable ease: Swans alone have between 22 and 25. But in general, while evolution produces new species, the flexibility of the body plans of those species may decrease with rising complexity.
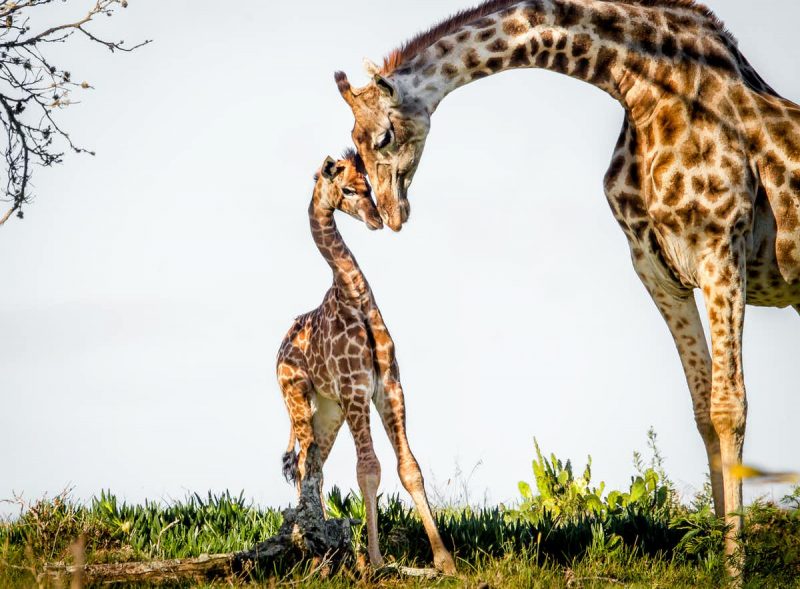
Giraffes have 7 neck bones. Image via John Michael Vosloo/ Shutterstock.
Quite often, closely related species end up being selected along similar paths. Moreover, “developmental bias” means that anatomical variation is not produced at random.
Take mammals. They come from a common ancestor, and have taken strikingly similar forms even though they have evolved on different continents. This is another example of the fact that evolution isn’t entirely unpredictable – there are only so many solutions to the same physical and biological problems, like seeing, digging or flying.
The future of evolution
Clearly, there is an apparent contradiction at the heart of evolutionary biology. On one hand, the mechanisms of evolution have no predisposition for change in any particular direction. On the other hand, let those mechanisms get going, and beyond some threshold, the interwoven ecological and developmental systems they generate tend to yield more and more species with greater maximum complexity.
So can we expect more diversity and complexity going forward? We are now at the beginning of a sixth mass extinction, caused by humans and showing no signs of stopping – wiping out the results of millions of years of evolution. Despite this, humans themselves are too numerous, widespread and adaptable to be at serious risk of extinction any time soon. It is far more likely that we will extend our distribution yet further by engineering habitable biospheres on other planets.
On other planets, we may one day find alien life. Would that follow the same evolutionary trajectory as life on Earth? From one cell, the transition to multi-cellularity may be an easy hurdle to jump. Although it came quite late on Earth, it nevertheless happened many times. More complicated development with different tissue types evolved in only a few groups on Earth, so may represent a higher bar.
If alien biology makes it over some hurdles, its development is indeed likely to favor patterns of increasing diversity and maximum complexity. But perhaps a dominant, intelligent species like humans will always be bad news for many of the other species on the planets where they evolve.
The astronomer Frank Drake proposed an equation to estimate how many intelligent civilizations we might expect in our galaxy. This contained a term for how long such civilizations might exist before destroying themselves. Drake was pessimistic about this: let’s hope he was wrong.
Matthew Wills, Professor of Evolutionary Palaeobiology at the Milner Centre for Evolution, University of Bath
This article is republished from The Conversation under a Creative Commons license. Read the original article.
Bottom line: Why evolution seems to have a direction, and what to expect next.
![]()
from EarthSky https://ift.tt/30tHlDy
Is intelligent life bad news for diversity? Image via Gudkov Andrey/ Shutterstock.
Matthew Wills, University of Bath
The diversity and complexity of life on Earth is astonishing: 8 million or more living species – from algae to elephants – all evolved from a simple, single-celled common ancestor around 3.5 billion years ago. But does that mean that evolution always and inevitably generates greater diversity and complexity, having a predictable direction?
Charles Darwin identified three ingredients necessary for natural selection to occur. Individuals must be different, so there is variation in the population. They must also be able to pass this variation on to offspring. Finally, individuals must compete for resources that limit the number of offspring they can produce. Individuals with variations that allow them to obtain more resources are likely to produce more offspring like themselves.
Evolution also depends on context and environment, which notoriously change constantly in unpredictable ways. For example, fishes who start living and evolving in unlit caves often lose their eyes, because the costs of developing them outweigh their advantages.
Blind cave fish. Image via wikipedia
So natural selection operates from one generation to the next. It cannot plan ahead or have a goal. In addition, not all evolutionary change is a response to selection, but can be neutral or random. It is not even guaranteed to produce more species, since evolution can occur in a single lineage and this can go extinct at any time. How can we reconcile such an aimless process with the bewildering diversity and complexity we see?
Ecological influence
Ecology and evolution are two sides of the same coin. The environment is not just the physical surroundings of an organism, but also the other biological species with which it interacts.
We can see this environmental interaction deep in the history of life. For billions of years, organisms were “stuck” as single cells within the seas. Several groups independently evolved multi-cellularity (perhaps 25 times). But the first animals, plants and fungi with complex development, different tissues and organs only appeared around 540 million years ago, with the Cambrian “explosion” of diversity.
This may have been triggered by increased levels of oxygen in the oceans, which was, in turn, the result of photosynthesis – the process by which plants and other organisms convert sunlight into energy while releasing oxygen – in much simpler forms of life over millions of years.
Once animals had attained greater size and evolved guts, hard parts, jaws, teeth, eyes and legs, complex food webs became possible – along with “arms races” between predators and prey. Groups with adaptations that enabled them to live on land opened up even more opportunities. Once out of the bag, these innovations were difficult to “uninvent” – promoting diversity.
The only diagram in Darwin’s On the Origin of Species shows species splitting through time. If more species originate than go extinct, then species richness increases. Darwin wondered whether ecological space might simply “fill up” one day.
Diagram from On the Origin of Species. Image via Wikipedia.
But so far as we can tell, the species count has been increasing for most of the last 250 million years. Even past natural mass extinctions were only temporary setbacks that may have created even more opportunities for diversity in the long run.
Variation is not random
As organisms evolve more complicated systems of development, they may, however, become less able to modify certain aspects of their anatomy. This is partly because genes, tissues and organs often have several different functions, so it may become difficult to change one for the better without accidentally “breaking” something elsewhere.
For example, nearly all mammals – from giraffes to humans – are stuck with just seven neck bones. Whenever different numbers develop or evolve, they bring other anatomical problems. Birds are entirely different, and seem to evolve new numbers of neck vertebrae with remarkable ease: Swans alone have between 22 and 25. But in general, while evolution produces new species, the flexibility of the body plans of those species may decrease with rising complexity.
Giraffes have 7 neck bones. Image via John Michael Vosloo/ Shutterstock.
Quite often, closely related species end up being selected along similar paths. Moreover, “developmental bias” means that anatomical variation is not produced at random.
Take mammals. They come from a common ancestor, and have taken strikingly similar forms even though they have evolved on different continents. This is another example of the fact that evolution isn’t entirely unpredictable – there are only so many solutions to the same physical and biological problems, like seeing, digging or flying.
The future of evolution
Clearly, there is an apparent contradiction at the heart of evolutionary biology. On one hand, the mechanisms of evolution have no predisposition for change in any particular direction. On the other hand, let those mechanisms get going, and beyond some threshold, the interwoven ecological and developmental systems they generate tend to yield more and more species with greater maximum complexity.
So can we expect more diversity and complexity going forward? We are now at the beginning of a sixth mass extinction, caused by humans and showing no signs of stopping – wiping out the results of millions of years of evolution. Despite this, humans themselves are too numerous, widespread and adaptable to be at serious risk of extinction any time soon. It is far more likely that we will extend our distribution yet further by engineering habitable biospheres on other planets.
On other planets, we may one day find alien life. Would that follow the same evolutionary trajectory as life on Earth? From one cell, the transition to multi-cellularity may be an easy hurdle to jump. Although it came quite late on Earth, it nevertheless happened many times. More complicated development with different tissue types evolved in only a few groups on Earth, so may represent a higher bar.
If alien biology makes it over some hurdles, its development is indeed likely to favor patterns of increasing diversity and maximum complexity. But perhaps a dominant, intelligent species like humans will always be bad news for many of the other species on the planets where they evolve.
The astronomer Frank Drake proposed an equation to estimate how many intelligent civilizations we might expect in our galaxy. This contained a term for how long such civilizations might exist before destroying themselves. Drake was pessimistic about this: let’s hope he was wrong.
Matthew Wills, Professor of Evolutionary Palaeobiology at the Milner Centre for Evolution, University of Bath
This article is republished from The Conversation under a Creative Commons license. Read the original article.
Bottom line: Why evolution seems to have a direction, and what to expect next.
![]()
from EarthSky https://ift.tt/30tHlDy