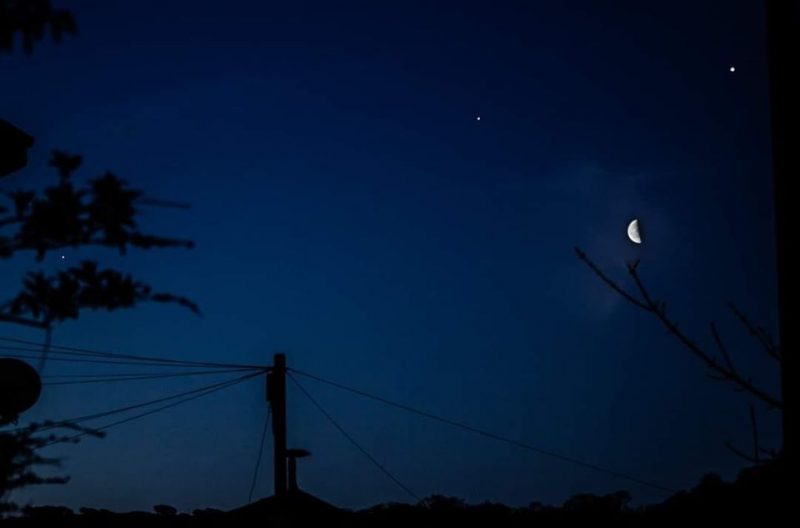
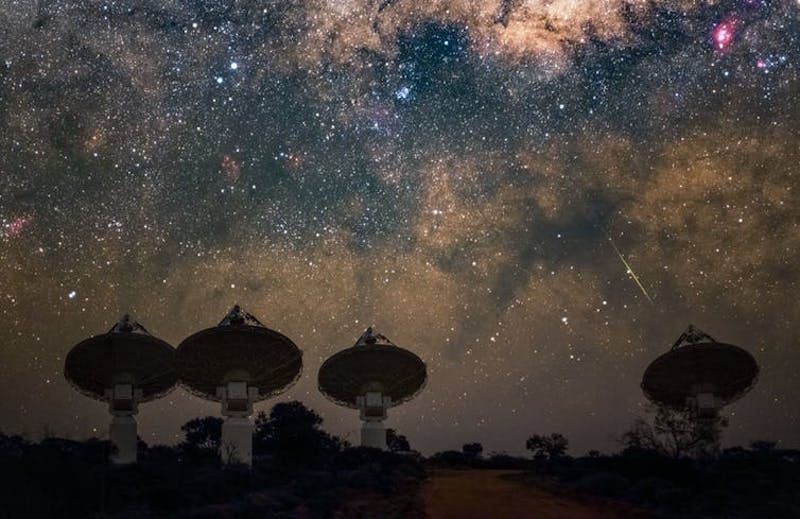
Diligence, technological progress and a little luck have together solved a 20 year mystery of the cosmos. Image via CSIRO/ Alex Cherney/ The Conversation.
By J. Xavier Prochaska, University of California, Santa Cruz and Jean-Pierre Macquart, Curtin University
In the late 1990s, cosmologists made a prediction about how much ordinary matter there should be in the universe. About 5%, they estimated, should be regular stuff with the rest a mixture of dark matter and dark energy. But when cosmologists counted up everything they could see or measure at the time, they came up short. By a lot.
The sum of all the ordinary matter that cosmologists measured only added up to about half of the 5% what was supposed to be in the universe.
This is known as the “missing baryon problem” and for over 20 years, cosmologists like us looked hard for this matter without success.
It took the discovery of a new celestial phenomenon and entirely new telescope technology, but earlier this year, our team finally found the missing matter.
Origin of the problem
Baryon is a classification for types of particles – sort of an umbrella term – that encompasses protons and neutrons, the building blocks of all the ordinary matter in the universe. Everything on the periodic table and pretty much anything that you think of as “stuff” is made of baryons.
Since the late 1970s, cosmologists have suspected that dark matter – an as of yet unknown type of matter that must exist to explain the gravitational patterns in space – makes up most of the matter of the universe with the rest being baryonic matter, but they didn’t know the exact ratios. In 1997, three scientists from the University of California, San Diego, used the ratio of heavy hydrogen nuclei – hydrogen with an extra neutron – to normal hydrogen to estimate that baryons should make up about 5% of the mass-energy budget of the universe.
Yet while the ink was still drying on the publication, another trio of cosmologists raised a bright red flag. They reported that a direct measure of baryons in our present universe – determined through a census of stars, galaxies, and the gas within and around them – added up to only half of the predicted 5%.
This sparked the missing baryon problem. Provided the law of nature held that matter can be neither created nor destroyed, there were two possible explanations: Either the matter didn’t exist and the math was wrong, or, the matter was out there hiding somewhere.
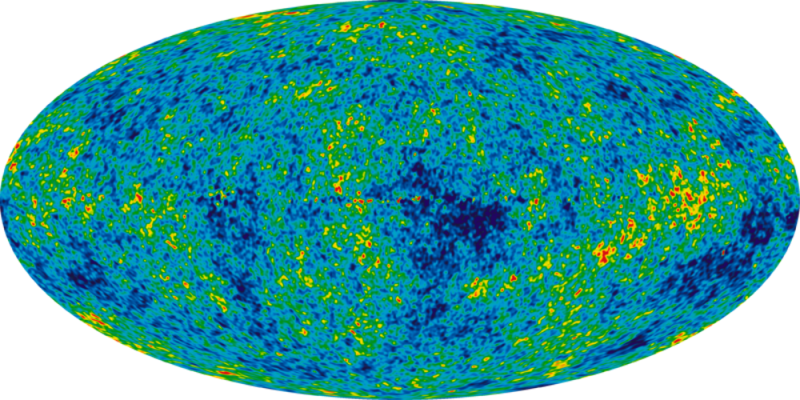
Remnants of the conditions in the early universe, like cosmic microwave background radiation, gave scientists a precise measure of the unverse’s mass in baryons. Image via NASA.
Unsuccessful search
Astronomers across the globe took up the search and the first clue came a year later from theoretical cosmologists. Their computer simulations predicted that the majority of the missing matter was hiding in a low-density, million-degree hot plasma that permeated the universe. This was termed the “warm-hot intergalactic medium” and nicknamed “the WHIM.” The WHIM, if it existed, would solve the missing baryon problem but at the time there was no way to confirm its existence.
In 2001, another piece of evidence in favor of the WHIM emerged. A second team confirmed the initial prediction of baryons making up 5% of the universe by looking at tiny temperature fluctuations in the universe’s cosmic microwave background – essentially the leftover radiation from the Big Bang. With two separate confirmations of this number, the math had to be right and the WHIM seemed to be the answer. Now cosmologists just had to find this invisible plasma.
Over the past 20 years, we and many other teams of cosmologists and astronomers have brought nearly all of the Earth’s greatest observatories to the hunt. There were some false alarms and tentative detections of warm-hot gas, but one of our teams eventually linked those to gas around galaxies. If the WHIM existed, it was too faint and diffuse to detect.
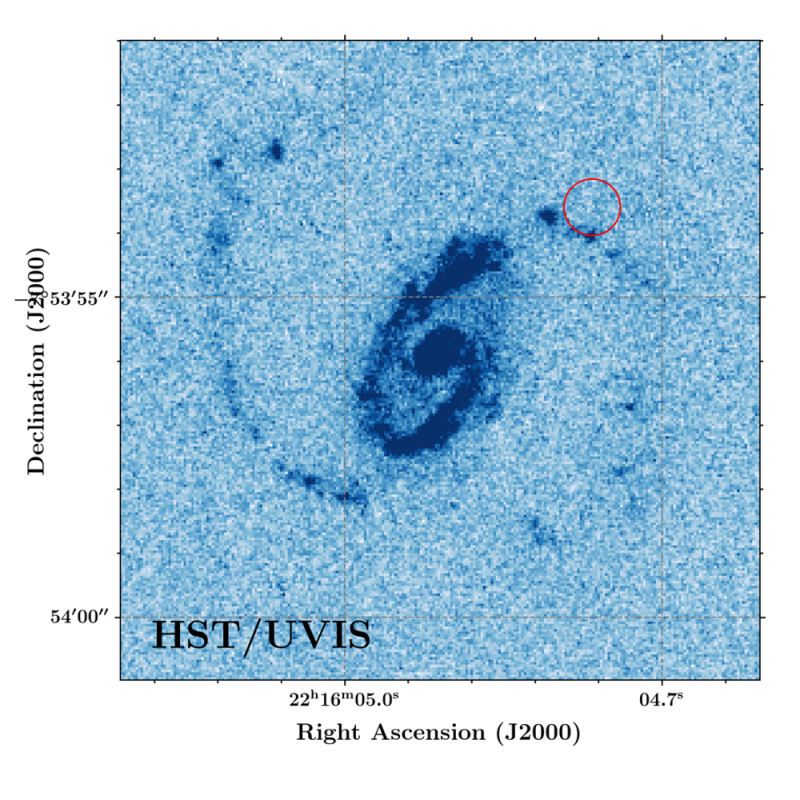
The red circle marks the exact spot that produced a fast radio burst in a galaxy billions of light-years away. Image via J. Xavier Prochaska (UC Santa Cruz)/ Jay Chittidi (Maria Mitchell Observatory)/ Alexandra Mannings (UC Santa Cruz).
An unexpected solution in fast radio bursts
In 2007, an entirely unanticipated opportunity appeared. Duncan Lorimer, an astronomer at the University of West Virginia, reported the serendipitous discovery of a cosmological phenomenon known as a fast radio burst (FRB). FRBs are extremely brief, highly energetic pulses of radio emissions. Cosmologists and astronomers still don’t know what creates them, but they seem to come from galaxies far, far away.
As these bursts of radiation traverse the universe and pass through gasses and the theorized WHIM, they undergo something called dispersion.
The initial mysterious cause of these FRBs lasts for less a thousandth of a second and all the wavelengths start out in a tight clump. If someone was lucky enough – or unlucky enough – to be near the spot where an FRB was produced, all the wavelengths would hit them simultaneously.
But when radio waves pass through matter, they are briefly slowed down. The longer the wavelength, the more a radio wave “feels” the matter. Think of it like wind resistance. A bigger car feels more wind resistance than a smaller car.
The “wind resistance” effect on radio waves is incredibly small, but space is big. By the time an FRB has traveled millions or billions of light-years to reach Earth, dispersion has slowed the longer wavelengths so much that they arrive nearly a second later than the shorter wavelengths.
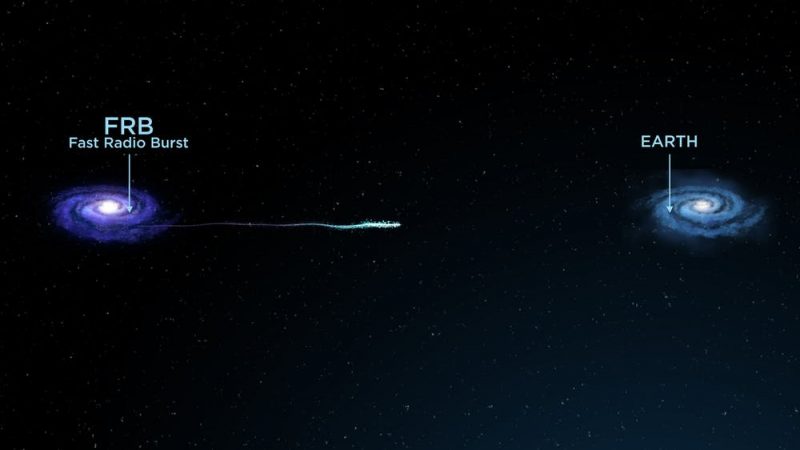
Fast radio bursts originate from galaxies millions and billions of light-years away and that distance is one of the reasons we can use them to find the missing baryons. Image via ICRAR.
Therein lay the potential of FRBs to weigh the universe’s baryons, an opportunity we recognized on the spot. By measuring the spread of different wavelengths within one FRB, we could calculate exactly how much matter – how many baryons – the radio waves passed through on their way to Earth.
At this point we were so close, but there was one final piece of information we needed. To precisely measure the baryon density, we needed to know where in the sky an FRB came from. If we knew the source galaxy, we would know how far the radio waves traveled. With that and the amount of dispersion they experienced, perhaps we could calculate how much matter they passed through on the way to Earth?
Unfortunately, the telescopes in 2007 weren’t good enough to pinpoint exactly which galaxy – and therefore how far away – an FRB came from.
We knew what information would allow us to solve the problem, now we just had to wait for technology to develop enough to give us that data.
Technical innovation
It was 11 years until we were able to place – or localize – our first FRB. In August 2018, our collaborative project called CRAFT began using the Australian Square Kilometre Array Pathfinder (ASKAP) radio telescope in the outback of Western Australia to look for FRBs. This new telescope – which is run by Australia’s national science agency, CSIRO – can watch huge portions of the sky, about 60 times the size of a full moon, and it can simultaneously detect FRBs and pinpoint where in the sky they come from.
ASKAP captured its first FRB one month later. Once we knew the precise part of the sky the radio waves came from, we quickly used the Keck telescope in Hawaii to identify which galaxy the FRB came from and how far away that galaxy was. The first FRB we detected came from a galaxy named DES J214425.25–405400.81 that is about 4 billion light-years away from Earth, in case you were wondering.
The technology and technique worked. We had measured the dispersion from an FRB and knew where it came from. But we needed to catch a few more of them in order to attain a statistically significant count of the baryons. So we waited and hoped space would send us some more FRBs.
By mid-July 2019, we had detected five more events – enough to perform the first search for the missing matter. Using the dispersion measures of these six FRBs, we were able to make a rough calculation of how much matter the radio waves passed through before reaching earth.
We were overcome by both amazement and reassurance the moment we saw the data fall right on the curve predicted by the 5% estimate. We had detected the missing baryons in full, solving this cosmological riddle and putting to rest two decades of searching.
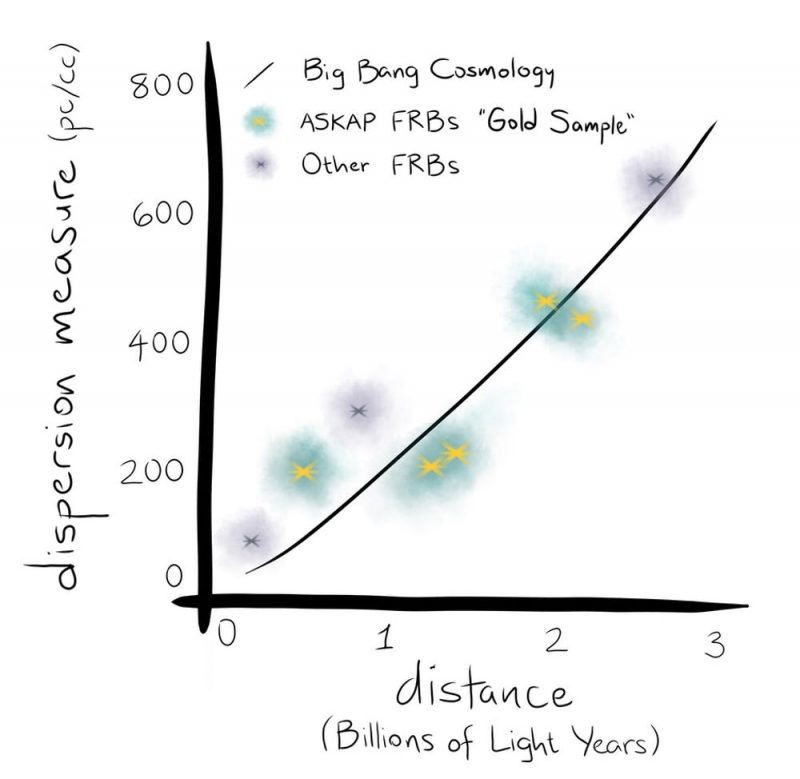
Sketch of the dispersion measure relation measured from FRBs (points) compared to the prediction from cosmology (black curve). The excellent correspondence confirms the detection of all the missing matter. Image via Hannah Bish (University of Washington).
This result, however, is only the first step. We were able to estimate the amount of baryons, but with only six data points, we can’t yet build a comprehensive map of the missing baryons. We have proof the WHIM likely exists and have confirmed how much there is, but we don’t know exactly how it is distributed. It is believed to be part of a vast filamentary network of gas that connects galaxies termed “the cosmic web,” but with about 100 fast radio bursts cosmologists could start building an accurate map of this web.
J. Xavier Prochaska, Professor of Astronomy & Astrophysics, University of California, Santa Cruz and Jean-Pierre Macquart, Associate Professor of Astrophysics, Curtin University
This article is republished from The Conversation under a Creative Commons license. Read the original article.
Bottom line: Half the matter in the universe was missing. Researchers say they have found it hiding in the cosmos.

from EarthSky https://ift.tt/2MjTu5F
Diligence, technological progress and a little luck have together solved a 20 year mystery of the cosmos. Image via CSIRO/ Alex Cherney/ The Conversation.
By J. Xavier Prochaska, University of California, Santa Cruz and Jean-Pierre Macquart, Curtin University
In the late 1990s, cosmologists made a prediction about how much ordinary matter there should be in the universe. About 5%, they estimated, should be regular stuff with the rest a mixture of dark matter and dark energy. But when cosmologists counted up everything they could see or measure at the time, they came up short. By a lot.
The sum of all the ordinary matter that cosmologists measured only added up to about half of the 5% what was supposed to be in the universe.
This is known as the “missing baryon problem” and for over 20 years, cosmologists like us looked hard for this matter without success.
It took the discovery of a new celestial phenomenon and entirely new telescope technology, but earlier this year, our team finally found the missing matter.
Origin of the problem
Baryon is a classification for types of particles – sort of an umbrella term – that encompasses protons and neutrons, the building blocks of all the ordinary matter in the universe. Everything on the periodic table and pretty much anything that you think of as “stuff” is made of baryons.
Since the late 1970s, cosmologists have suspected that dark matter – an as of yet unknown type of matter that must exist to explain the gravitational patterns in space – makes up most of the matter of the universe with the rest being baryonic matter, but they didn’t know the exact ratios. In 1997, three scientists from the University of California, San Diego, used the ratio of heavy hydrogen nuclei – hydrogen with an extra neutron – to normal hydrogen to estimate that baryons should make up about 5% of the mass-energy budget of the universe.
Yet while the ink was still drying on the publication, another trio of cosmologists raised a bright red flag. They reported that a direct measure of baryons in our present universe – determined through a census of stars, galaxies, and the gas within and around them – added up to only half of the predicted 5%.
This sparked the missing baryon problem. Provided the law of nature held that matter can be neither created nor destroyed, there were two possible explanations: Either the matter didn’t exist and the math was wrong, or, the matter was out there hiding somewhere.
Remnants of the conditions in the early universe, like cosmic microwave background radiation, gave scientists a precise measure of the unverse’s mass in baryons. Image via NASA.
Unsuccessful search
Astronomers across the globe took up the search and the first clue came a year later from theoretical cosmologists. Their computer simulations predicted that the majority of the missing matter was hiding in a low-density, million-degree hot plasma that permeated the universe. This was termed the “warm-hot intergalactic medium” and nicknamed “the WHIM.” The WHIM, if it existed, would solve the missing baryon problem but at the time there was no way to confirm its existence.
In 2001, another piece of evidence in favor of the WHIM emerged. A second team confirmed the initial prediction of baryons making up 5% of the universe by looking at tiny temperature fluctuations in the universe’s cosmic microwave background – essentially the leftover radiation from the Big Bang. With two separate confirmations of this number, the math had to be right and the WHIM seemed to be the answer. Now cosmologists just had to find this invisible plasma.
Over the past 20 years, we and many other teams of cosmologists and astronomers have brought nearly all of the Earth’s greatest observatories to the hunt. There were some false alarms and tentative detections of warm-hot gas, but one of our teams eventually linked those to gas around galaxies. If the WHIM existed, it was too faint and diffuse to detect.
The red circle marks the exact spot that produced a fast radio burst in a galaxy billions of light-years away. Image via J. Xavier Prochaska (UC Santa Cruz)/ Jay Chittidi (Maria Mitchell Observatory)/ Alexandra Mannings (UC Santa Cruz).
An unexpected solution in fast radio bursts
In 2007, an entirely unanticipated opportunity appeared. Duncan Lorimer, an astronomer at the University of West Virginia, reported the serendipitous discovery of a cosmological phenomenon known as a fast radio burst (FRB). FRBs are extremely brief, highly energetic pulses of radio emissions. Cosmologists and astronomers still don’t know what creates them, but they seem to come from galaxies far, far away.
As these bursts of radiation traverse the universe and pass through gasses and the theorized WHIM, they undergo something called dispersion.
The initial mysterious cause of these FRBs lasts for less a thousandth of a second and all the wavelengths start out in a tight clump. If someone was lucky enough – or unlucky enough – to be near the spot where an FRB was produced, all the wavelengths would hit them simultaneously.
But when radio waves pass through matter, they are briefly slowed down. The longer the wavelength, the more a radio wave “feels” the matter. Think of it like wind resistance. A bigger car feels more wind resistance than a smaller car.
The “wind resistance” effect on radio waves is incredibly small, but space is big. By the time an FRB has traveled millions or billions of light-years to reach Earth, dispersion has slowed the longer wavelengths so much that they arrive nearly a second later than the shorter wavelengths.
Fast radio bursts originate from galaxies millions and billions of light-years away and that distance is one of the reasons we can use them to find the missing baryons. Image via ICRAR.
Therein lay the potential of FRBs to weigh the universe’s baryons, an opportunity we recognized on the spot. By measuring the spread of different wavelengths within one FRB, we could calculate exactly how much matter – how many baryons – the radio waves passed through on their way to Earth.
At this point we were so close, but there was one final piece of information we needed. To precisely measure the baryon density, we needed to know where in the sky an FRB came from. If we knew the source galaxy, we would know how far the radio waves traveled. With that and the amount of dispersion they experienced, perhaps we could calculate how much matter they passed through on the way to Earth?
Unfortunately, the telescopes in 2007 weren’t good enough to pinpoint exactly which galaxy – and therefore how far away – an FRB came from.
We knew what information would allow us to solve the problem, now we just had to wait for technology to develop enough to give us that data.
Technical innovation
It was 11 years until we were able to place – or localize – our first FRB. In August 2018, our collaborative project called CRAFT began using the Australian Square Kilometre Array Pathfinder (ASKAP) radio telescope in the outback of Western Australia to look for FRBs. This new telescope – which is run by Australia’s national science agency, CSIRO – can watch huge portions of the sky, about 60 times the size of a full moon, and it can simultaneously detect FRBs and pinpoint where in the sky they come from.
ASKAP captured its first FRB one month later. Once we knew the precise part of the sky the radio waves came from, we quickly used the Keck telescope in Hawaii to identify which galaxy the FRB came from and how far away that galaxy was. The first FRB we detected came from a galaxy named DES J214425.25–405400.81 that is about 4 billion light-years away from Earth, in case you were wondering.
The technology and technique worked. We had measured the dispersion from an FRB and knew where it came from. But we needed to catch a few more of them in order to attain a statistically significant count of the baryons. So we waited and hoped space would send us some more FRBs.
By mid-July 2019, we had detected five more events – enough to perform the first search for the missing matter. Using the dispersion measures of these six FRBs, we were able to make a rough calculation of how much matter the radio waves passed through before reaching earth.
We were overcome by both amazement and reassurance the moment we saw the data fall right on the curve predicted by the 5% estimate. We had detected the missing baryons in full, solving this cosmological riddle and putting to rest two decades of searching.
Sketch of the dispersion measure relation measured from FRBs (points) compared to the prediction from cosmology (black curve). The excellent correspondence confirms the detection of all the missing matter. Image via Hannah Bish (University of Washington).
This result, however, is only the first step. We were able to estimate the amount of baryons, but with only six data points, we can’t yet build a comprehensive map of the missing baryons. We have proof the WHIM likely exists and have confirmed how much there is, but we don’t know exactly how it is distributed. It is believed to be part of a vast filamentary network of gas that connects galaxies termed “the cosmic web,” but with about 100 fast radio bursts cosmologists could start building an accurate map of this web.
J. Xavier Prochaska, Professor of Astronomy & Astrophysics, University of California, Santa Cruz and Jean-Pierre Macquart, Associate Professor of Astrophysics, Curtin University
This article is republished from The Conversation under a Creative Commons license. Read the original article.
Bottom line: Half the matter in the universe was missing. Researchers say they have found it hiding in the cosmos.
from EarthSky https://ift.tt/2MjTu5F