Has mystery of universe’s missing matter been solved?

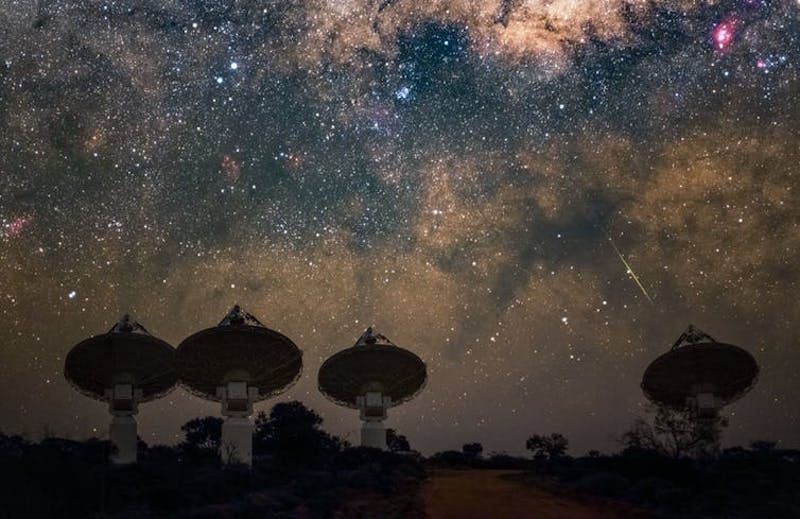
Dish-shaped radio telescopes silhouetted under the Milky Way.

Diligence, technological progress and a little luck have together solved a 20 year mystery of the cosmos. Image via CSIRO/ Alex Cherney/ The Conversation.

By J. Xavier Prochaska, University of California, Santa Cruz and Jean-Pierre Macquart, Curtin University

In the late 1990s, cosmologists made a prediction about how much ordinary matter there should be in the universe. About 5%, they estimated, should be regular stuff with the rest a mixture of dark matter and dark energy. But when cosmologists counted up everything they could see or measure at the time, they came up short. By a lot.

The sum of all the ordinary matter that cosmologists measured only added up to about half of the 5% what was supposed to be in the universe.

This is known as the “missing baryon problem” and for over 20 years, cosmologists like us looked hard for this matter without success.

It took the discovery of a new celestial phenomenon and entirely new telescope technology, but earlier this year, our team finally found the missing matter.

Origin of the problem

Baryon is a classification for types of particles – sort of an umbrella term – that encompasses protons and neutrons, the building blocks of all the ordinary matter in the universe. Everything on the periodic table and pretty much anything that you think of as “stuff” is made of baryons.

Since the late 1970s, cosmologists have suspected that dark matter – an as of yet unknown type of matter that must exist to explain the gravitational patterns in space – makes up most of the matter of the universe with the rest being baryonic matter, but they didn’t know the exact ratios. In 1997, three scientists from the University of California, San Diego, used the ratio of heavy hydrogen nuclei – hydrogen with an extra neutron – to normal hydrogen to estimate that baryons should make up about 5% of the mass-energy budget of the universe.

Yet while the ink was still drying on the publication, another trio of cosmologists raised a bright red flag. They reported that a direct measure of baryons in our present universe – determined through a census of stars, galaxies, and the gas within and around them – added up to only half of the predicted 5%.

This sparked the missing baryon problem. Provided the law of nature held that matter can be neither created nor destroyed, there were two possible explanations: Either the matter didn’t exist and the math was wrong, or, the matter was out there hiding somewhere.
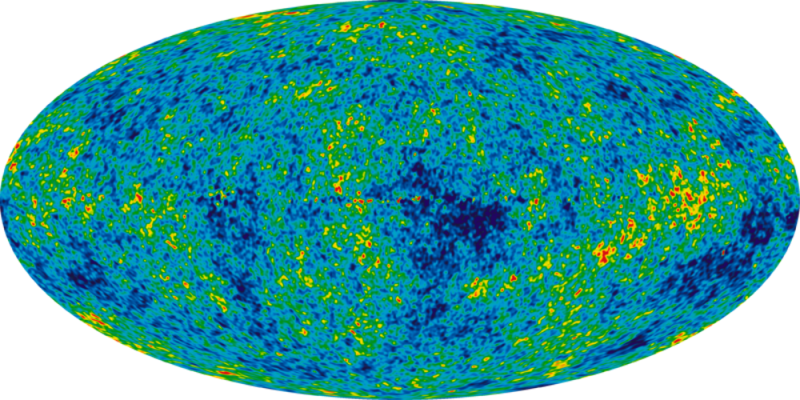
A long oval speckled with yellow, light blue, dark blue, light green, and dark green.

Remnants of the conditions in the early universe, like cosmic microwave background radiation, gave scientists a precise measure of the unverse’s mass in baryons. Image via NASA.

Unsuccessful search

Astronomers across the globe took up the search and the first clue came a year later from theoretical cosmologists. Their computer simulations predicted that the majority of the missing matter was hiding in a low-density, million-degree hot plasma that permeated the universe. This was termed the “warm-hot intergalactic medium” and nicknamed “the WHIM.” The WHIM, if it existed, would solve the missing baryon problem but at the time there was no way to confirm its existence.

In 2001, another piece of evidence in favor of the WHIM emerged. A second team confirmed the initial prediction of baryons making up 5% of the universe by looking at tiny temperature fluctuations in the universe’s cosmic microwave background – essentially the leftover radiation from the Big Bang. With two separate confirmations of this number, the math had to be right and the WHIM seemed to be the answer. Now cosmologists just had to find this invisible plasma.

Over the past 20 years, we and many other teams of cosmologists and astronomers have brought nearly all of the Earth’s greatest observatories to the hunt. There were some false alarms and tentative detections of warm-hot gas, but one of our teams eventually linked those to gas around galaxies. If the WHIM existed, it was too faint and diffuse to detect.
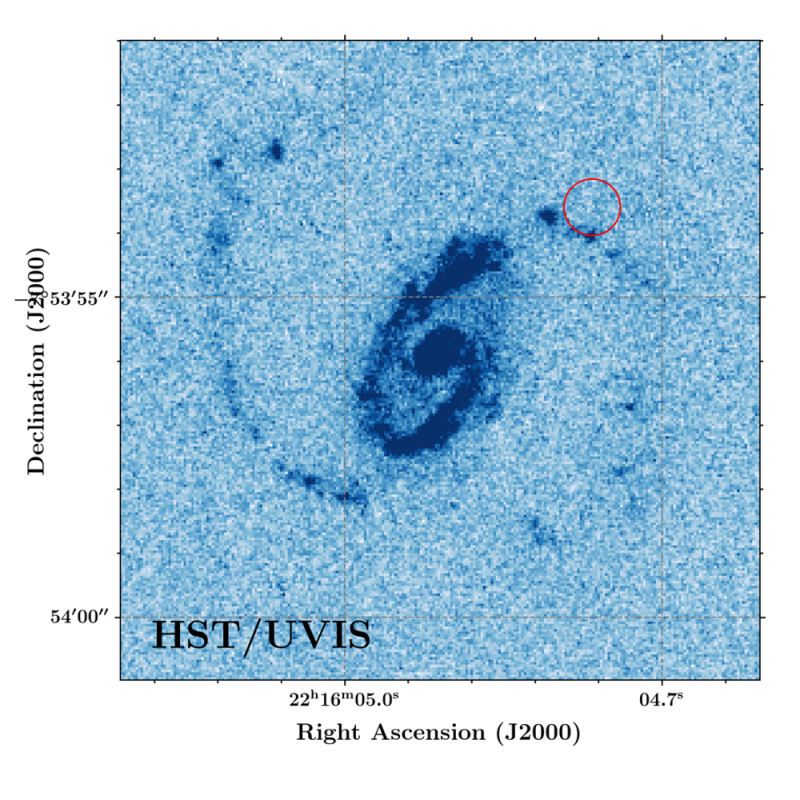
Blue speckled square with a dark blue spiral and small red circle.

The red circle marks the exact spot that produced a fast radio burst in a galaxy billions of light-years away. Image via J. Xavier Prochaska (UC Santa Cruz)/ Jay Chittidi (Maria Mitchell Observatory)/ Alexandra Mannings (UC Santa Cruz).

An unexpected solution in fast radio bursts

In 2007, an entirely unanticipated opportunity appeared. Duncan Lorimer, an astronomer at the University of West Virginia, reported the serendipitous discovery of a cosmological phenomenon known as a fast radio burst (FRB). FRBs are extremely brief, highly energetic pulses of radio emissions. Cosmologists and astronomers still don’t know what creates them, but they seem to come from galaxies far, far away.

As these bursts of radiation traverse the universe and pass through gasses and the theorized WHIM, they undergo something called dispersion.

The initial mysterious cause of these FRBs lasts for less a thousandth of a second and all the wavelengths start out in a tight clump. If someone was lucky enough – or unlucky enough – to be near the spot where an FRB was produced, all the wavelengths would hit them simultaneously.

But when radio waves pass through matter, they are briefly slowed down. The longer the wavelength, the more a radio wave “feels” the matter. Think of it like wind resistance. A bigger car feels more wind resistance than a smaller car.

The “wind resistance” effect on radio waves is incredibly small, but space is big. By the time an FRB has traveled millions or billions of light-years to reach Earth, dispersion has slowed the longer wavelengths so much that they arrive nearly a second later than the shorter wavelengths.
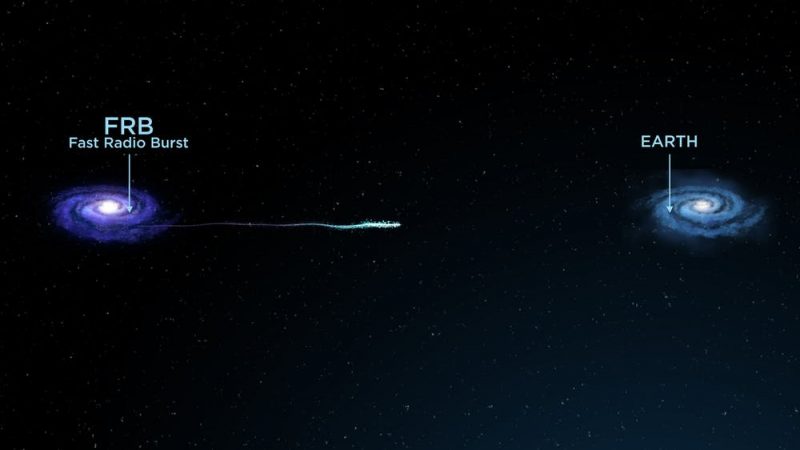
Two galaxies with a streamer of light halfway between them.

Fast radio bursts originate from galaxies millions and billions of light-years away and that distance is one of the reasons we can use them to find the missing baryons. Image via ICRAR.

Therein lay the potential of FRBs to weigh the universe’s baryons, an opportunity we recognized on the spot. By measuring the spread of different wavelengths within one FRB, we could calculate exactly how much matter – how many baryons – the radio waves passed through on their way to Earth.

At this point we were so close, but there was one final piece of information we needed. To precisely measure the baryon density, we needed to know where in the sky an FRB came from. If we knew the source galaxy, we would know how far the radio waves traveled. With that and the amount of dispersion they experienced, perhaps we could calculate how much matter they passed through on the way to Earth?

Unfortunately, the telescopes in 2007 weren’t good enough to pinpoint exactly which galaxy – and therefore how far away – an FRB came from.

We knew what information would allow us to solve the problem, now we just had to wait for technology to develop enough to give us that data.

Technical innovation

It was 11 years until we were able to place – or localize – our first FRB. In August 2018, our collaborative project called CRAFT began using the Australian Square Kilometre Array Pathfinder (ASKAP) radio telescope in the outback of Western Australia to look for FRBs. This new telescope – which is run by Australia’s national science agency, CSIRO – can watch huge portions of the sky, about 60 times the size of a full moon, and it can simultaneously detect FRBs and pinpoint where in the sky they come from.

ASKAP captured its first FRB one month later. Once we knew the precise part of the sky the radio waves came from, we quickly used the Keck telescope in Hawaii to identify which galaxy the FRB came from and how far away that galaxy was. The first FRB we detected came from a galaxy named DES J214425.25–405400.81 that is about 4 billion light-years away from Earth, in case you were wondering.

The technology and technique worked. We had measured the dispersion from an FRB and knew where it came from. But we needed to catch a few more of them in order to attain a statistically significant count of the baryons. So we waited and hoped space would send us some more FRBs.

By mid-July 2019, we had detected five more events – enough to perform the first search for the missing matter. Using the dispersion measures of these six FRBs, we were able to make a rough calculation of how much matter the radio waves passed through before reaching earth.

We were overcome by both amazement and reassurance the moment we saw the data fall right on the curve predicted by the 5% estimate. We had detected the missing baryons in full, solving this cosmological riddle and putting to rest two decades of searching.
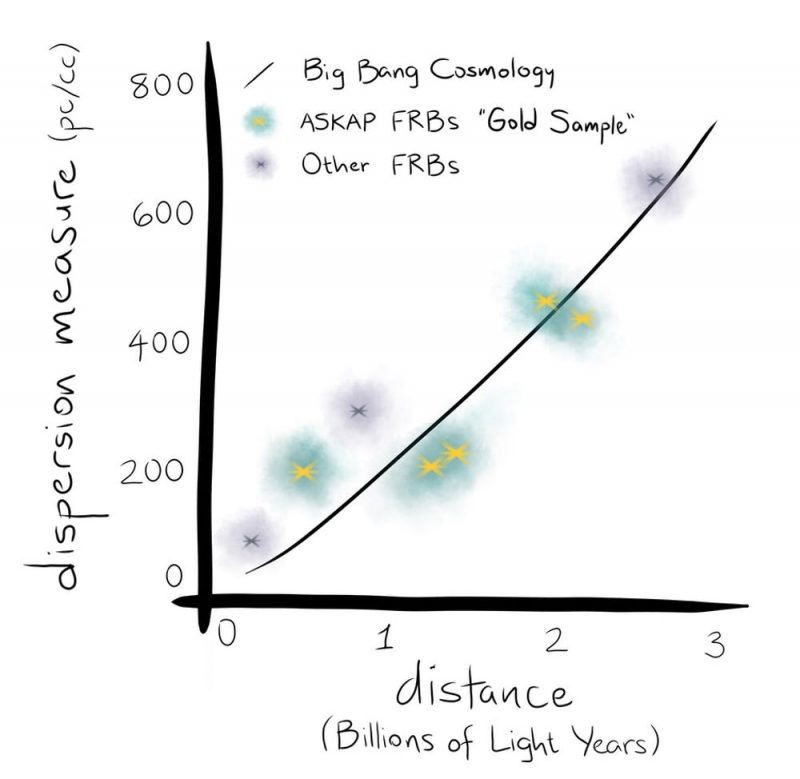
Graph with distance on X axis and precision measurement on Y axis and line with dots from lower left to upper right.

Sketch of the dispersion measure relation measured from FRBs (points) compared to the prediction from cosmology (black curve). The excellent correspondence confirms the detection of all the missing matter. Image via Hannah Bish (University of Washington).

This result, however, is only the first step. We were able to estimate the amount of baryons, but with only six data points, we can’t yet build a comprehensive map of the missing baryons. We have proof the WHIM likely exists and have confirmed how much there is, but we don’t know exactly how it is distributed. It is believed to be part of a vast filamentary network of gas that connects galaxies termed “the cosmic web,” but with about 100 fast radio bursts cosmologists could start building an accurate map of this web.

J. Xavier Prochaska, Professor of Astronomy & Astrophysics, University of California, Santa Cruz and Jean-Pierre Macquart, Associate Professor of Astrophysics, Curtin University

This article is republished from The Conversation under a Creative Commons license. Read the original article.

Bottom line: Half the matter in the universe was missing. Researchers say they have found it hiding in the cosmos.

The Conversation


from EarthSky https://ift.tt/2MjTu5F
Dish-shaped radio telescopes silhouetted under the Milky Way.

Diligence, technological progress and a little luck have together solved a 20 year mystery of the cosmos. Image via CSIRO/ Alex Cherney/ The Conversation.

By J. Xavier Prochaska, University of California, Santa Cruz and Jean-Pierre Macquart, Curtin University

In the late 1990s, cosmologists made a prediction about how much ordinary matter there should be in the universe. About 5%, they estimated, should be regular stuff with the rest a mixture of dark matter and dark energy. But when cosmologists counted up everything they could see or measure at the time, they came up short. By a lot.

The sum of all the ordinary matter that cosmologists measured only added up to about half of the 5% what was supposed to be in the universe.

This is known as the “missing baryon problem” and for over 20 years, cosmologists like us looked hard for this matter without success.

It took the discovery of a new celestial phenomenon and entirely new telescope technology, but earlier this year, our team finally found the missing matter.

Origin of the problem

Baryon is a classification for types of particles – sort of an umbrella term – that encompasses protons and neutrons, the building blocks of all the ordinary matter in the universe. Everything on the periodic table and pretty much anything that you think of as “stuff” is made of baryons.

Since the late 1970s, cosmologists have suspected that dark matter – an as of yet unknown type of matter that must exist to explain the gravitational patterns in space – makes up most of the matter of the universe with the rest being baryonic matter, but they didn’t know the exact ratios. In 1997, three scientists from the University of California, San Diego, used the ratio of heavy hydrogen nuclei – hydrogen with an extra neutron – to normal hydrogen to estimate that baryons should make up about 5% of the mass-energy budget of the universe.

Yet while the ink was still drying on the publication, another trio of cosmologists raised a bright red flag. They reported that a direct measure of baryons in our present universe – determined through a census of stars, galaxies, and the gas within and around them – added up to only half of the predicted 5%.

This sparked the missing baryon problem. Provided the law of nature held that matter can be neither created nor destroyed, there were two possible explanations: Either the matter didn’t exist and the math was wrong, or, the matter was out there hiding somewhere.

A long oval speckled with yellow, light blue, dark blue, light green, and dark green.

Remnants of the conditions in the early universe, like cosmic microwave background radiation, gave scientists a precise measure of the unverse’s mass in baryons. Image via NASA.

Unsuccessful search

Astronomers across the globe took up the search and the first clue came a year later from theoretical cosmologists. Their computer simulations predicted that the majority of the missing matter was hiding in a low-density, million-degree hot plasma that permeated the universe. This was termed the “warm-hot intergalactic medium” and nicknamed “the WHIM.” The WHIM, if it existed, would solve the missing baryon problem but at the time there was no way to confirm its existence.

In 2001, another piece of evidence in favor of the WHIM emerged. A second team confirmed the initial prediction of baryons making up 5% of the universe by looking at tiny temperature fluctuations in the universe’s cosmic microwave background – essentially the leftover radiation from the Big Bang. With two separate confirmations of this number, the math had to be right and the WHIM seemed to be the answer. Now cosmologists just had to find this invisible plasma.

Over the past 20 years, we and many other teams of cosmologists and astronomers have brought nearly all of the Earth’s greatest observatories to the hunt. There were some false alarms and tentative detections of warm-hot gas, but one of our teams eventually linked those to gas around galaxies. If the WHIM existed, it was too faint and diffuse to detect.

Blue speckled square with a dark blue spiral and small red circle.

The red circle marks the exact spot that produced a fast radio burst in a galaxy billions of light-years away. Image via J. Xavier Prochaska (UC Santa Cruz)/ Jay Chittidi (Maria Mitchell Observatory)/ Alexandra Mannings (UC Santa Cruz).

An unexpected solution in fast radio bursts

In 2007, an entirely unanticipated opportunity appeared. Duncan Lorimer, an astronomer at the University of West Virginia, reported the serendipitous discovery of a cosmological phenomenon known as a fast radio burst (FRB). FRBs are extremely brief, highly energetic pulses of radio emissions. Cosmologists and astronomers still don’t know what creates them, but they seem to come from galaxies far, far away.

As these bursts of radiation traverse the universe and pass through gasses and the theorized WHIM, they undergo something called dispersion.

The initial mysterious cause of these FRBs lasts for less a thousandth of a second and all the wavelengths start out in a tight clump. If someone was lucky enough – or unlucky enough – to be near the spot where an FRB was produced, all the wavelengths would hit them simultaneously.

But when radio waves pass through matter, they are briefly slowed down. The longer the wavelength, the more a radio wave “feels” the matter. Think of it like wind resistance. A bigger car feels more wind resistance than a smaller car.

The “wind resistance” effect on radio waves is incredibly small, but space is big. By the time an FRB has traveled millions or billions of light-years to reach Earth, dispersion has slowed the longer wavelengths so much that they arrive nearly a second later than the shorter wavelengths.

Two galaxies with a streamer of light halfway between them.

Fast radio bursts originate from galaxies millions and billions of light-years away and that distance is one of the reasons we can use them to find the missing baryons. Image via ICRAR.

Therein lay the potential of FRBs to weigh the universe’s baryons, an opportunity we recognized on the spot. By measuring the spread of different wavelengths within one FRB, we could calculate exactly how much matter – how many baryons – the radio waves passed through on their way to Earth.

At this point we were so close, but there was one final piece of information we needed. To precisely measure the baryon density, we needed to know where in the sky an FRB came from. If we knew the source galaxy, we would know how far the radio waves traveled. With that and the amount of dispersion they experienced, perhaps we could calculate how much matter they passed through on the way to Earth?

Unfortunately, the telescopes in 2007 weren’t good enough to pinpoint exactly which galaxy – and therefore how far away – an FRB came from.

We knew what information would allow us to solve the problem, now we just had to wait for technology to develop enough to give us that data.

Technical innovation

It was 11 years until we were able to place – or localize – our first FRB. In August 2018, our collaborative project called CRAFT began using the Australian Square Kilometre Array Pathfinder (ASKAP) radio telescope in the outback of Western Australia to look for FRBs. This new telescope – which is run by Australia’s national science agency, CSIRO – can watch huge portions of the sky, about 60 times the size of a full moon, and it can simultaneously detect FRBs and pinpoint where in the sky they come from.

ASKAP captured its first FRB one month later. Once we knew the precise part of the sky the radio waves came from, we quickly used the Keck telescope in Hawaii to identify which galaxy the FRB came from and how far away that galaxy was. The first FRB we detected came from a galaxy named DES J214425.25–405400.81 that is about 4 billion light-years away from Earth, in case you were wondering.

The technology and technique worked. We had measured the dispersion from an FRB and knew where it came from. But we needed to catch a few more of them in order to attain a statistically significant count of the baryons. So we waited and hoped space would send us some more FRBs.

By mid-July 2019, we had detected five more events – enough to perform the first search for the missing matter. Using the dispersion measures of these six FRBs, we were able to make a rough calculation of how much matter the radio waves passed through before reaching earth.

We were overcome by both amazement and reassurance the moment we saw the data fall right on the curve predicted by the 5% estimate. We had detected the missing baryons in full, solving this cosmological riddle and putting to rest two decades of searching.

Graph with distance on X axis and precision measurement on Y axis and line with dots from lower left to upper right.

Sketch of the dispersion measure relation measured from FRBs (points) compared to the prediction from cosmology (black curve). The excellent correspondence confirms the detection of all the missing matter. Image via Hannah Bish (University of Washington).

This result, however, is only the first step. We were able to estimate the amount of baryons, but with only six data points, we can’t yet build a comprehensive map of the missing baryons. We have proof the WHIM likely exists and have confirmed how much there is, but we don’t know exactly how it is distributed. It is believed to be part of a vast filamentary network of gas that connects galaxies termed “the cosmic web,” but with about 100 fast radio bursts cosmologists could start building an accurate map of this web.

J. Xavier Prochaska, Professor of Astronomy & Astrophysics, University of California, Santa Cruz and Jean-Pierre Macquart, Associate Professor of Astrophysics, Curtin University

This article is republished from The Conversation under a Creative Commons license. Read the original article.

Bottom line: Half the matter in the universe was missing. Researchers say they have found it hiding in the cosmos.

The Conversation


from EarthSky https://ift.tt/2MjTu5F
What’s a penumbral eclipse of the moon?

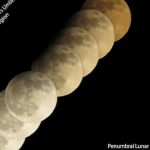
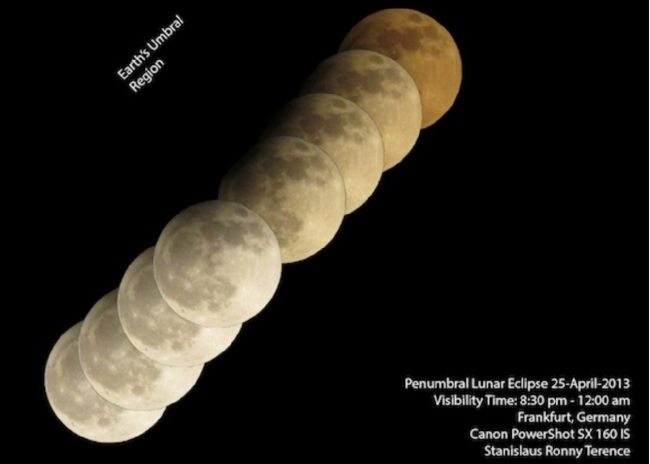
Row of full moons with increasing slight shadowiness on several at end of row.

April 2013 penumbral eclipse by Stanislaus Ronny Terrance. See the dark shading on one edge of the moon?

Next penumbral lunar eclipse: June 5, 2020

An eclipse of the moon can only happen at full moon, when the sun, Earth and moon line up in space, with Earth in the middle. At such times, Earth’s shadow falls on the moon, creating a lunar eclipse. Lunar eclipses happen a minimum of two times to a maximum of five times a year. There are three kinds of lunar eclipses: total, partial and penumbral.

In a total eclipse of the moon, the inner part of Earth’s shadow, called the umbra, falls on the moon’s face. At mid-eclipse, the entire moon is in shadow, which may appear blood red.

In a partial lunar eclipse, the umbra takes a bite out of only a fraction of the moon. The dark bite grows larger, and then recedes, never reaching the total phase.

In a penumbral lunar eclipse, only the more diffuse outer shadow of Earth – the penumbra – falls on the moon’s face. This third kind of lunar eclipse is much more subtle, and much more difficult to observe, than either a total or partial eclipse of the moon. There is never a dark bite taken out of the moon, as in a partial eclipse. The eclipse never progresses to reach the dramatic minutes of totality. At best, at mid-eclipse, very observant people will notice a dark shading on the moon’s face. Others will look and notice nothing at all.

According to eclipse expert Fred Espenak, about 35% of all eclipses are penumbral. Another 30% are partial eclipses, where it appears as if a dark bite has been taken out of the moon. And the final 35% go all the way to becoming total eclipses of the moon, a beautiful natural event.

Two full moons side by side with the one on the right slightly shaded.

View larger. | Left, an ordinary full moon with no eclipse. Right, full moon in penumbral eclipse on November 20, 2002. Master eclipse photographer Fred Espenak took this photo when the moon was 88.9% immersed in Earth’s penumbral shadow. There’s no dark bite taken out of the moon. A penumbral eclipse creates only a dark shading on the moon’s face.

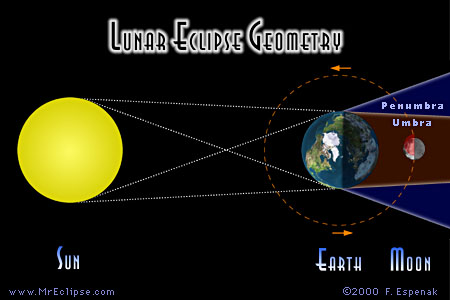
Diagram with Earth between sun and moon showing moon passing through Earth's shadow.

In a lunar eclipse, Earth’s shadow falls on the moon. If the moon passes through the dark central shadow of Earth – the umbra – a partial or total lunar eclipse takes place. If the moon only passes through the outer part of the shadow (the penumbra), a subtle penumbral eclipse occurs. Diagram via Fred Espenak’s Lunar Eclipses for Beginners.

Round, bright circle with a dark bite out of it in a deep blue sky over a green field.

Here’s what a partial lunar eclipse looks like. Astronomer Alan Dyer caught it from his home in southern Alberta, Canada, in June 2012. It was pre-dawn, near moonset. Image copyright Alan Dyer. Used with permission.

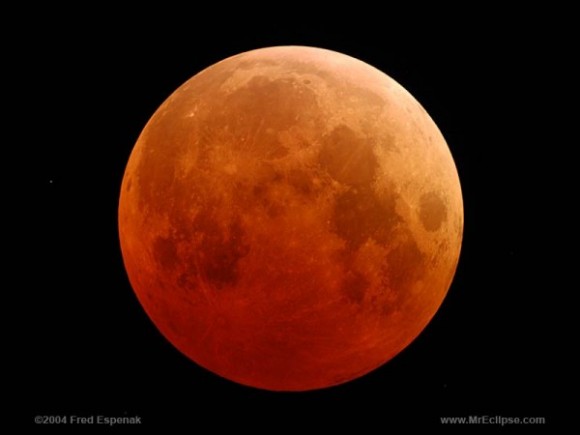
Orange-red full moon.

This is what a total eclipse looks like. This is the total eclipse of October 27, 2004, via Fred Espenak of NASA, otherwise known as Mr. Eclipse. Visit Fred’s page here.

Bottom line: There are three kinds of lunar eclipses: total, partial and penumbral. A penumbral eclipse is very subtle. At no time does a dark bite appear to be taken out of the moon. Instead, at mid-eclipse, observant people will notice a shading on the moon’s face.


from EarthSky https://ift.tt/2rMqzRl

June 2020 guide to the bright planets

Click the name of a planet to learn more about its visibility in June 2020.

Evening planets: Mercury (dusk), Jupiter and Saturn (rise at mid-to-late evening)

Morning planets: Venus (dawn), Jupiter, Saturn and Mars (predawn/dawn sky).

Try Stellarium for a precise view of the planets from your location.

Want precise planet rise and set times? Click here for recommended almanacs

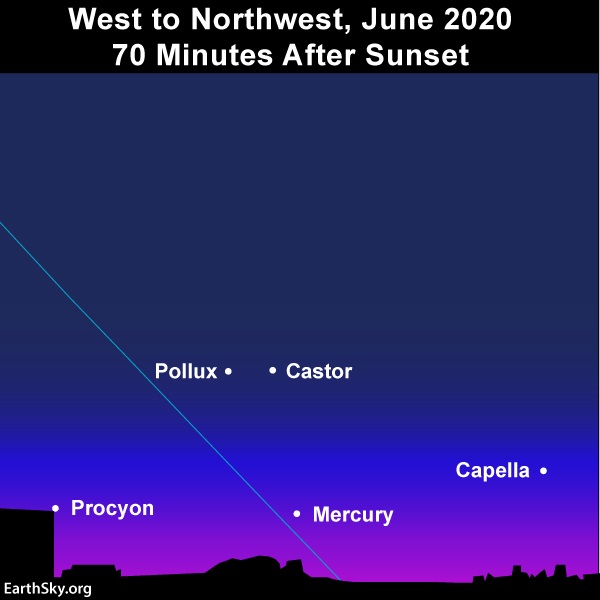
Chart: Line of ecliptic, with Mercury and four stars.

Mercury reaches its greatest evening elongation on June 4, 2020. Read more.

Chart: Moon, Jupiter and Saturn with line of ecliptic.

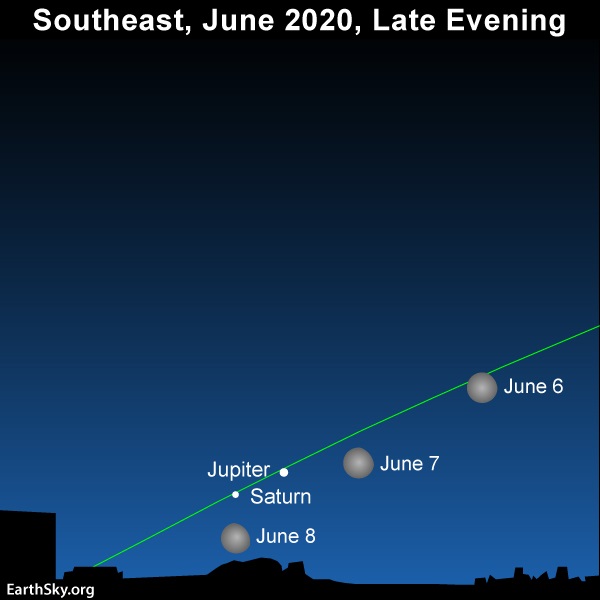
On June 7 and 8, at mid-to-late evening, look for the waning gibbous moon to rise in your southeast sky. The moon will be near the planets Jupiter and Saturn. Read more.

Chart: Ecliptic line, Mars, Fomalhaut, and arrow pointing at location of Neptune.

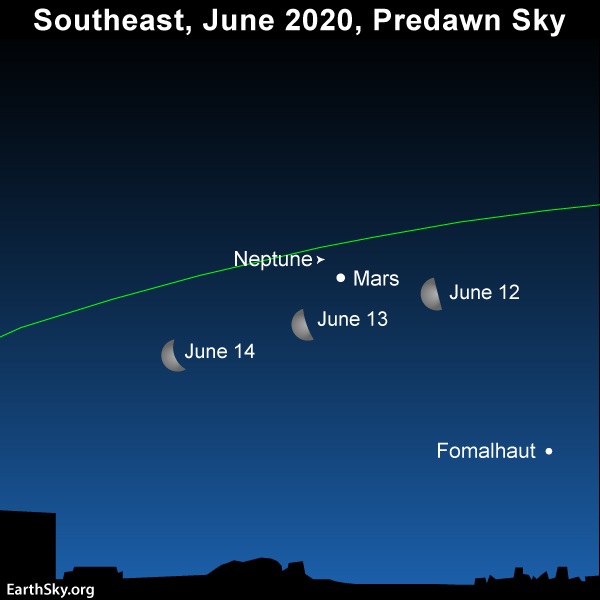
At mid-northern latitudes, you’ll have to get up mighty early to catch the moon and the red planet Mars in the predawn sky! Read more.

Chart: Ecliptic, moon, Venus and the Pleiades at dawn.

The lit side of the waning crescent moon points to the planet Venus on June 17 and 18, 2020. If you live at the right spot worldwide, you can watch the lunar occultation of Venus on June 19, 2020. Read more.

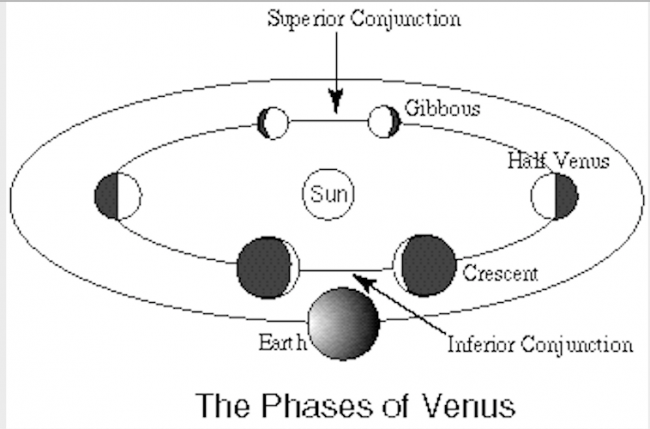
Venus – the brightest planet – is lost in the sun’s glare for the first week or two in June 2020. Venus swings in front of the sun (at inferior conjunction) on June 3, 2020, to transition out of the evening sky and into the morning sky. Look for Venus to reappear in the eastern dawn by around mid-June.

Diagram showing positions of Venus in orbit and its phases at inferior and superior conjunction.

Inferior conjunction – when Venus sweeps between the sun and Earth – happens on June 3, 2020. Just before inferior conjunction, we see Venus as a thin waning crescent in the evening sky; and just after inferior conjunction, we see Venus as a thin waxing crescent in the morning sky. Image via UCLA.

Around the world, Venus pretty much rises and sets with the sun in early June 2020.

At mid-northern latitudes, Venus rises about an hour before the sun in mid-June, increasing to about 2 hours by the month’s end.

At and near the equator, Venus rises about 1 1/4 hours before the sun in mid-June, increasing to about 2 1/3 hours near the month’s end.

At temperate latitudes in the Southern Hemisphere, Venus rises about 1 1/3 hours before the sun in mid-June, increasing to about 2 2/3 hours by the month’s end.

After Venus swings over into the morning sky in early June, Venus in its faster orbit around the sun will be going farther and farther away from Earth. As viewed through the telescope, Venus’ waxing crescent phase will widen, yet its overall disk size will shrink. Venus’ disk is 0% illuminated on June 3, and about 18% illuminated by the month’s end; Venus’ angular diameter, on the other hand, will shrink to 3/4th the size by the month’s end.

All the same, Venus will brighten throughout the month and into July. Look for Venus to beam at its brightest in the morning sky on or around July 10, 2020, when Venus displays its greatest illuminated extent on the sky’s dome. Venus always beams at its brightest best when its disk is about one-quarter illuminated by sunshine.

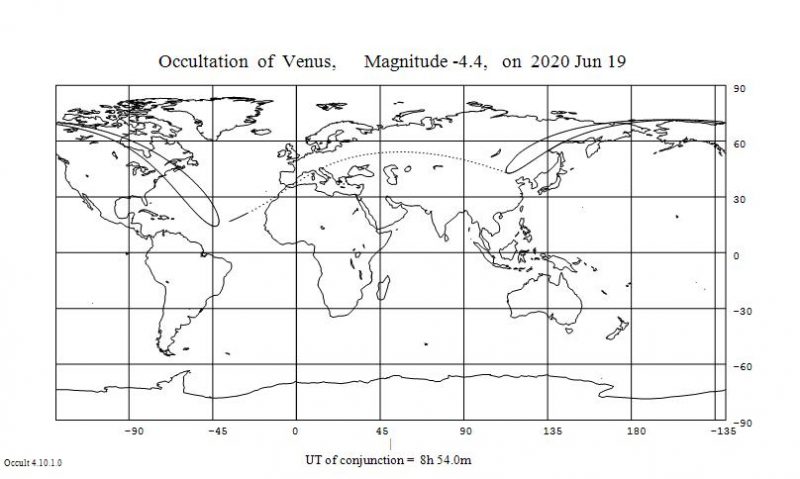
Look for the waning crescent moon in the vicinity of Venus for several days, starting on or near June 17. In fact, if you live at the right spot on Earth, you can watch the moon occult (cover over) Venus on June 19, 2020.

Map of the world with a curved line crossing it and a big loop from Siberia across Canada and down in to the Atlantic.

The swath of the globe to the north of, or above, the dotted curve (Greenland, northwestern Europe and northern Asia) has the June 19th occultation of Venus in a daytime sky. At the far west (left) of the occultation viewing area (northeast North America), the occultation takes place at dawn June 19. Worldwide map via the International Occultation Timing Association (IOTA). Read more.

Mercury reaches its greatest eastern (evening) elongation from the setting sun on June 4, 2020. Have binoculars handy, however, for Mercury has to compete with the glow of evening twilight. Given an unobstructed horizon in the direction of sunset, you have a reasonably good chance of catching Mercury during the first week of June. This world is dimming daily, though, and by mid-June, Mercury will be about four times fainter. In other words, early June presents your best shot for catching Mercury after sunset.

At mid-northern latitudes, Mercury sets about 1 5/6 hours after the sun in early June, tapering to 1 1/4 hours by mid-month.

At or near the equator, Mercury sets about 1 2/3 hours after the sun in early June, tapering to 1 1/3 hours by mid-month.

At temperate latitudes in the Southern Hemisphere, Mercury sets about 1 1/2 hours after sunset throughout the the first half of June.

Mercury transitions out of the evening sky and into the morning sky on July 1, and then reaches its greatest elongation in the morning sky on July 22, 2020.

Jupiter and Saturn are near one another on the sky’s dome, with Saturn following Jupiter westward across the sky from mid-to-late evening till dawn. Look first for brilliant Jupiter and you’ll find Saturn a short hop to the east of the king planet. Remember, east is in the direction of sunrise. Although Saturn is easily as bright as a 1st-magnitude star, the ringed planet pales next the the king planet Jupiter, which outshines Saturn by some 15 times.

At mid-northern latitudes, Jupiter and nearby Saturn rise at late evening in early June and by the month’s end at nightfall.

At temperate latitudes in the Southern Hemisphere, Jupiter and Saturn rise at mid-evening in early June, and by nightfall at the month’s end.

Mars, which is a bit brighter than Saturn, more or less aligns with Jupiter and Saturn in the predawn/dawn sky. However, standoffish Mars is a long jump to the east of Jupiter and Saturn. Saturn shines between Jupiter and Mars, though much closer to Jupiter.

Watch for the moon in the vicinity of Jupiter and Saturn for several days, centered on or near June 8.

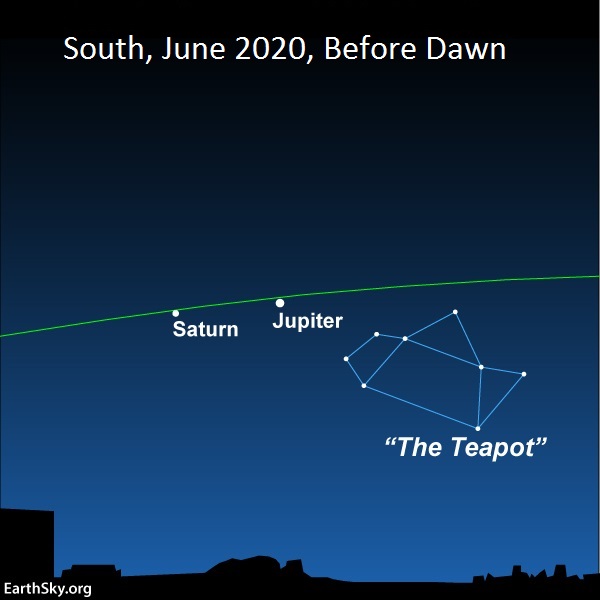
The ecliptic line, Jupiter, Saturn and the Teapot beautiful before dawn June 2020.

Are you an early riser? In June 2020, Jupiter and Saturn climb up highest for the night just before dawn. If you’re not one to get up early, try catching the planets Jupiter and Saturn low in the southeast sky before your bedtime. Read more.

Mars is the last of the three bright morning planets to rise in June 2020. Jupiter rises first, closely followed by Saturn, and then a few to several hours later by Mars. Whereas Jupiter and Saturn almost rise in tandem, Mars is off by itself in a rather dim section of sky.

At mid-northern latitudes, Mars rises about an hour after midnight in early June, and near the midnight hour by the month’s end. By midnight, we mean midway between sunset and sunrise.

At temperate latitudes in the Southern Hemisphere, Mars comes up at or near the midnight hour throughout the month.

Let the waning crescent moon help guide your eye to Mars for several mornings, centered around June 13.

In June 2020 … you’ll find Mars respectably bright – easily as brilliant as a 1st-magnitude star – before dawn. Earth will be rushing along in its smaller, faster orbit, gaining on Mars, the fourth planet outward from the sun. Throughout the next several months, watch for Mars to brighten dramatically as Earth closes in on Mars. The red planet will appear brightest in our sky and fiery red – around the time of its opposition – when Earth passes between Mars and the sun on October 13, 2020. At that wondrous time, Mars will actually supplant Jupiter as the sky’s fourth-brightest celestial body, after the sun, moon, and the planet Venus, respectively.

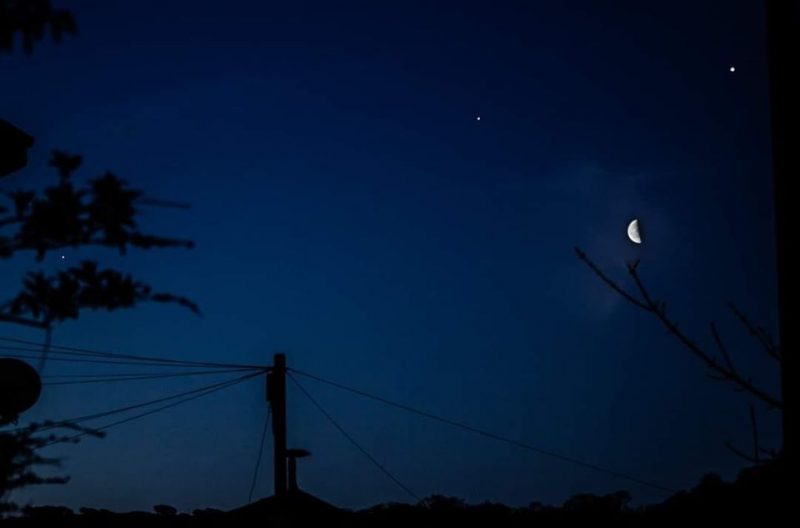
3 planets, crescent moon in deep blue sky above telephone lines before sunup on April 15.

View at EarthSky Community Photos. | From Paul Armstrong, who took this photo of Mars, Saturn and Jupiter on the morning of April 15, 2020, from Exmoor, U.K. Jupiter is at the upper right, Mars at center left, with Saturn between them. In May 2020, Jupiter and Saturn were closer together, whereas Mars was farther away from Jupiter and Saturn. Thanks, Paul!

What do we mean by bright planet? By bright planet, we mean any solar system planet that is easily visible without an optical aid and that has been watched by our ancestors since time immemorial. In their outward order from the sun, the five bright planets are Mercury, Venus, Mars, Jupiter and Saturn. These planets actually do appear bright in our sky. They are typically as bright as – or brighter than – the brightest stars. Plus, these relatively nearby worlds tend to shine with a steadier light than the distant, twinkling stars. You can spot them, and come to know them as faithful friends, if you try.

silhouette of man against the sunset sky with bright planet and crescent moon.

Skywatcher, by Predrag Agatonovic.

Bottom line: June 2020 presents all 5 bright solar system planets. Catch Mercury at dusk in early June, and Venus at dawn in the second half of the month. Jupiter and Saturn are rising earlier in the evening each day, and may be up before bedtime by mid-month. Look for Mars in the predawn/dawn sky, a long way to the east of Jupiter and Saturn.

Don’t miss anything. Subscribe to EarthSky News by email

Visit EarthSky’s Best Places to Stargaze, and recommend a place we can all enjoy.

Help EarthSky keep going! Donate now.

Post your planet photos at EarthSky Community Photos


from EarthSky https://ift.tt/1YD00CF

First-year students' stories of a pandemic: Study seeks data to help them flourish

The data gathered from student stories "may help us to create interventions to support students who may be struggling as they navigate disruptive and stressful events," says Emory psychologist Robyn Fivush.

By Carol Clark

The Silent Generation grew up dealing with the Great Depression and World War II. Now the first-year college students of Generation Z are coming of age amid climate change and the COVID-19 pandemic.

“The whole world was opening up to students that started college last fall,” says Robyn Fivush, an Emory professor of psychology and director of the Institute for the Liberal Arts. “They reached the threshold of adulthood. And then the pandemic hit, pulling the rug out from under them. What does it mean for their dreams of research, of travel, of what they want to do with their lives? It creates an even more uncertain future at a point when they were just starting to home in on their passions and form their adult identities.”

Emory University is one of five universities across the country collaborating on a study focused on narratives written by first-year college students from last fall about their experiences of the COVID-19 pandemic. The longitudinal study will follow the students for a year or more to track their psychological well-being and academic performance. The goal of the study is to determine whether the self-narratives can predict better outcomes for the students, and to gather data for any interventions that may be needed to help students to have more rewarding and successful academic experiences.

Fivush, director of the Family Narratives Lab in Emory’s Department of Psychology, is a leader in the field of narrative identity — how we use stories to understand ourselves and to make sense of the world and our place within it. She launched the student narratives study in collaboration with colleagues from the University of Kansas, the University of Missouri, the University of Utah and Western Washington University.

“I’ve become particularly interested in college-age individuals because it’s such an important time in the formation of identity,” Fivush says. “Even though the majority of Americans do not go away to college, the ones that do are living away from home for the first time, learning time management, how to feed themselves, how to interact with peers and how to make their own decisions.”

The researchers are recruiting students from all five of the universities now for the study. They hope to enroll between 600 and 1,000 participants to write two detailed narratives. The first narrative asks them to describe an event that best captures the challenges they have faced as a result of COVID-19. The second narrative focuses on an event that best captures what they have learned about themselves as a result of COVID-19.

Participants will also fill out questionnaires at the start of the study, and at periodic intervals during the course of it. The questions cover the participants’ living situations and their physical health. They also aim at assessing the participants’ levels of anxiety, stress and depression, whether they are flourishing, and whether they are experiencing positive personal growth and making academic progress.

The hypothesis is that more coherent, positive narratives will be predictive of better mental health, more effective identity processing and better academic progress. “The data may help us create interventions to support students who may be struggling as they navigate disruptive and stressful events,” Fivush says.

Students from lower-income families and first-generation college attendees were already more at risk for not making it to graduation so the fallout from the pandemic may be especially difficult for them to navigate, Fivush says. “If we don’t get some really deep data about what they are experiencing and how they are making decisions we are not going to be able to help them to stay the course and graduate,” she says. “It’s vital to understand and support them. Education remains the single most important path to upward mobility and for resolving inequalities.”

The researchers launched the study with available funds as a year-long project, and they will release useful data as it becomes available. They are currently writing grants to secure funding to extend the study for longer.

Fivush has served in administrative roles at Emory designed to create more integrated and reflective experiences for undergraduates. “I really enjoy administrative work because it’s a chance to think strategically about education and what it is that we’re trying to accomplish,” she says. “Emory is well-situated in terms of its resources and its commitment to the undergraduate experience. We are teaching the change agents and the leaders of tomorrow. The role we play as educators is critical for the future of the world.”

Generation Z, or those born from around the mid-1990s to early 2010s, now make up the largest segment of the population and are the first true “digital natives” — those who have never known the world without the Internet.

“Every college student has a smart phone and is continuously flooded with information,” Fivush says. “That has broken down and fractured shared social narratives. It may give you more leeway to create your own story. On the other hand, it makes the world more complicated, more ambiguous and uncertain. And all of those things can make the identity journey more challenging.”

Related:
How family stories help children weather hard times
Psychologists document the age our earliest memories fade

from eScienceCommons https://ift.tt/2AoBLrb

Moon and Spica on June 1 and 2

On June 1 and 2, 2020, use the waxing gibbous moon to find Spica, the brightest star in the constellation Virgo the Maiden. In fact, Spica is Virgo’s one and only 1st-magnitude star. Although the bright moon will wipe out a number of fainter stars from the canopy of night tonight, bright Spica should withstand the moonlit glare. If you have trouble seeing Spica, place your finger over the moon and look for a bright star nearby.

We in the Northern Hemisphere associate the star Spica with the spring and summer seasons. That’s because Spica first lights up the early evening sky in late March or early April, and then disappears from the evening sky around the September equinox.

The constellation Virgo stands as a memorial to that old legend of Hades, god of the underworld, who was said to have abducted Persephone, daughter of Demeter, goddess of the harvest. According to the legend, Hades took Persephone to his underground hideaway. Demeter’s grief was so great that she abandoned her role in insuring fruitfulness and fertility. In some parts of the globe, it’s said, winter cold came out of season and turned the once-verdant Earth in to a frigid wasteland. Elsewhere, summer heat was said to scorch the Earth and give rise to pestilence and disease. According to the myth, Earth would not bear fruit again until Demeter was reunited with her daughter.

Zeus, the king of the gods, intervened, insisting that Persephone be returned to her mother. However, Persephone was instructed to abstain from food until the reunion with her mother was a done deal. Alas, Hades purposely gave Persephone a pomegranate to take along, knowing she would eat a few seeds on her way home. Because of Persephone’s slip-up, Persephone has to return to the underworld for a number of months each year. When she does so, Demeter grieves, and winter reigns.

The constellation Virgo is linked to Demeter (and also Ishtar of Babylonian mythology, Isis of Egyptian mythology and Ceres of Roman mythology). Virgo is seen as a Maiden, associated with the harvest and fertility. The Latin word spicum refers to the ear of wheat Virgo holds in her left hand. The star Spica takes its name from this ear of wheat. Each evening, if you watch at the same time, you’ll see Spica slowly shift westward, toward the sunset direction. Eventually, Spica will get so close to the sunset that it’ll fade into the glare of evening twilight. Once Spica disappears from the evening sky, we at northerly latitudes must harvest our crops and put away firewood, because the cold winter season is on its way.

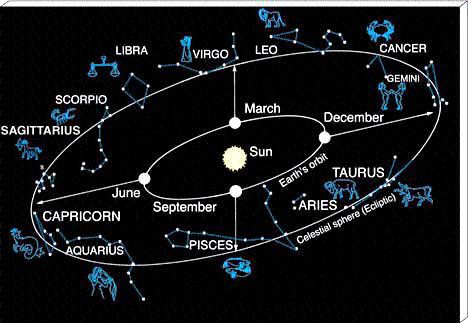
Diagram of solar system with figures of zodiac (Virgo, Scorpio, Aquarius, etc.) around the edge.

We are surrounded by stars. Because Earth orbits in a flat plane around the sun, we see the sun against the same stars again and again throughout the year. Those constellations, which have been special to people throughout the ages, are the constellations of the zodiac. Image via Professor Marcia Rieke.

The constellations of the zodiac – like Virgo – define the sun’s path across our sky. Putting it another way, each year, the sun passes in front of all the constellations of the zodiac. This year, 2020, the sun leaves the constellation Leo to enter the constellation Virgo on September 16, 2020. Then the sun leaves the constellation Virgo to enter the constellation Libra on October 30, 2020 (one day before Halloween).

Three other 1st-magnitude zodiacal stars join up with Spica to help sky gazers to envision the ecliptic – the sun’s annual path in front of the backdrop stars: Aldebaran, Regulus and Antares. Every year, the sun has its annual conjunction with Aldebaran on or near June 1, Regulus on or near August 23, Spica around mid-October, and Antares on or near December 1.

Of course, all these stars are invisible on their conjunction dates with the sun because they are totally lost in the sun’s glare at that time. However, six months before or after these stars’ conjunction dates, these stars are out all night long. Six months one way or the other of their conjunction, these stars reside opposite the sun in the sky and therefore stay out all night (Regulus around February 23, Spica around mid-April, Antares around June 1 and Aldebaran around December 1).

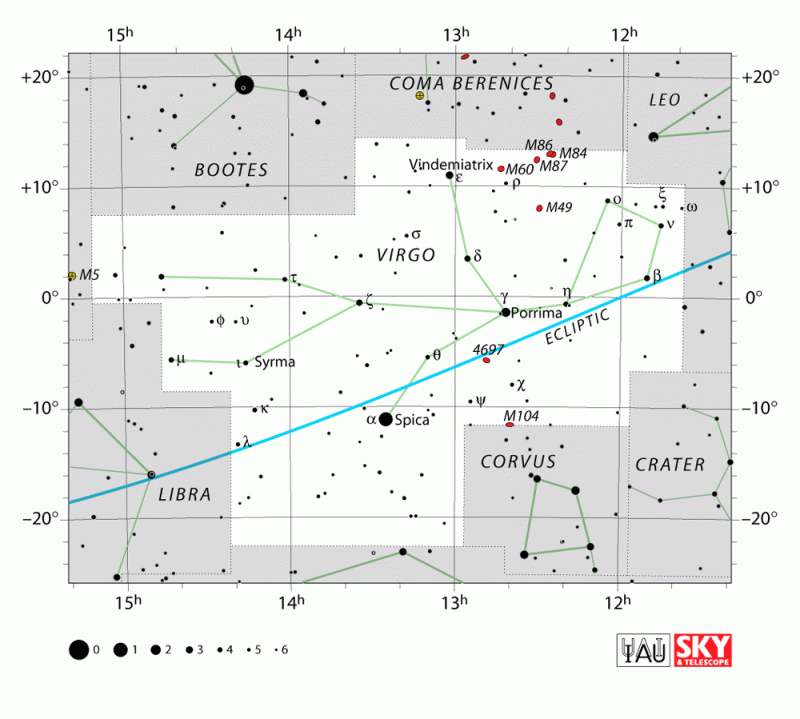
Sky chart of the constellation Virgo with latitude lines and blue line of ecliptic.

The ecliptic – Earth’s orbital plane projected onto the constellations of the zodiac – crosses the celestial equator (declination of O degrees) in the constellation Virgo. Because Spica resides so close to the ecliptic, it is considered a major star of the zodiac. Virgo constellation chart via the International Astronomical Union (IAU).

Bottom line: Use the moon to see the star Spica at nightfall on June 1 and 2, 2020, and celebrate this star’s presence in the evening sky.


from EarthSky https://ift.tt/2XJrJcc

NOAA predicts a ‘busy’ 2020 Atlantic hurricane season

Welcome to the 2020 Atlantic hurricane season. Although we’ve had two named storms already, the official season starts today – June 1 – and runs until November 30.

The two named storms that formed before hurricane season’s official start are Arthur, which formed May 16 and passed just 25 miles (40 km) south of Cape Hatteras, North Carolina, and Bertha, which formed off the East Coast early this past week, and made landfall on Wednesday (May 27) east of Charleston, South Carolina, with 50 mile-per-hour (80 km-per-hour) winds.

The U.S. National Oceanic and Atmospheric Administration (NOAA) released a statement on May 21, 2020, saying its forecasters are calling for an active 2020 Atlantic hurricane season, perhaps similar to last year’s, with more named storms than in an average season.

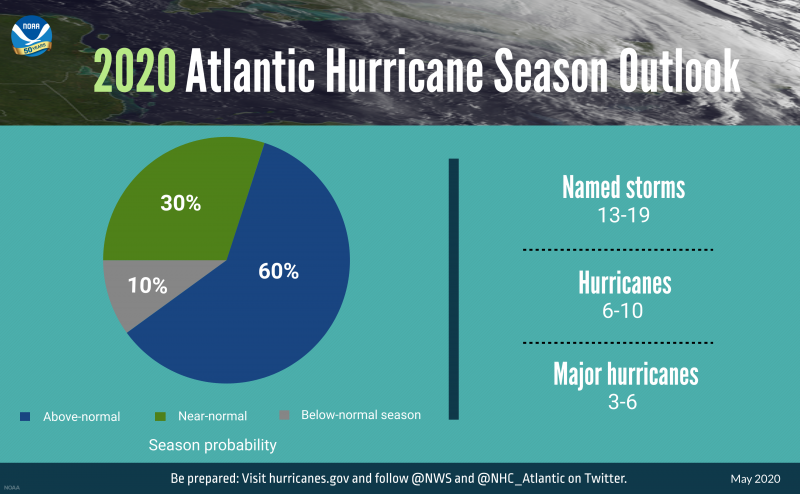
The 2020 NOAA forecast calls for a likely range of 13 to 19 named storms (winds of 39 mph – 63 kph – or higher), of which six to 10 could become hurricanes (winds of 74 mph – 119 kph – or higher), including three to six major hurricanes (category 3, 4 or 5; with winds of 111 mph – 179 kph – or higher). The powerful 2019 Atlantic hurricane season saw 18 named storms, six of which were hurricanes, including three major hurricanes. An average hurricane season produces 12 named storms, of which six become hurricanes, including three major hurricanes.

Hurricane names for 2020, plus how hurricanes get their names

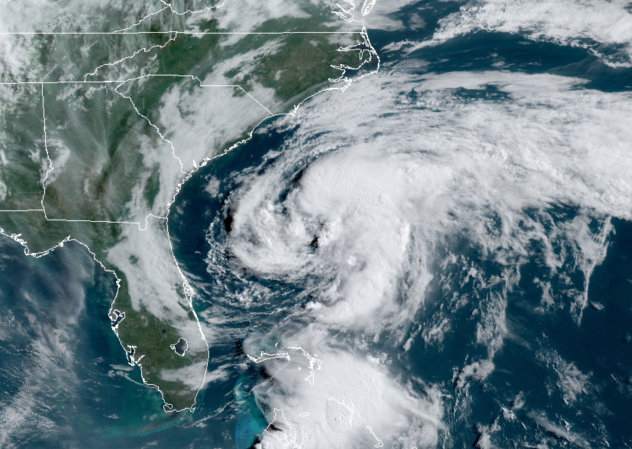
Orbital view of white spiral over ocean next to South Carolina, Georgia, and Florida.

Tropical Storm Arthur swirls off the southeast coast of the U.S. on the morning of Sunday, May 17, 2020. Image via CIRA/ RAMMB/ Accuweather.

NOAA said its outlook calls for a 60% chance of an above-normal season, a 30% chance of a near-normal season and only a 10% chance of a below-normal season, and it said the agency:

… provides these ranges with a 70% confidence.

The annual Atlantic hurricane forecast comes from NOAA’s Climate Prediction Center, a division of the U.S. National Weather Service.

Find NOAA’s full 2020 Atlantic Hurricane Season Outlook here

In addition to the Atlantic hurricane season outlook, NOAA also issued seasonal hurricane outlooks for the eastern Pacific and central Pacific basins.

NOAA’s 2020 Atlantic hurricane outlook comes on the heels of a new study from scientists at the University of Wisconsin suggesting that global warming is making hurricanes stronger. The study was based on analysis of nearly 40 years of satellite imagery of hurricanes. Their results say that – over the past four decades – hurricanes have become more intense and destructive.

Pie chart with 60% area marked 'above normal' along with text.

Hurricane season probabilities and numbers of named storms predicted via NOAA’s 2020 Atlantic Hurricane Season Outlook. Image via NOAA.

NOAA linked its forecast of an active 2020 hurricane season to Earth’s current climate, saying:

El Nino Southern Oscillation (ENSO) conditions are expected to either remain neutral or to trend toward La Nina, meaning there will not be an El Nino present to suppress hurricane activity. Also, warmer-than-average sea surface temperatures in the tropical Atlantic ocean and Caribbean sea, coupled with reduced vertical wind shear, weaker tropical Atlantic trade winds, and an enhanced west African monsoon all increase the likelihood for an above-normal Atlantic hurricane season.

Similar conditions have been producing more active seasons since the current high-activity era began in 1995.

Orbital view of giant round storm with deep eye, around the time it's making landfall in the Bahamas.

Hurricane Dorian on September 1, 2019. It was the most destructive storm of 2019, a monster hurricane that battered the Bahamas last September. It was the 4th named storm, 2nd hurricane and 1st Category 5 hurricane of the 2019 Atlantic hurricane season. It’s also the 4th-strongest Atlantic hurricane (as measured by 1-minute sustained wind speeds) since reliable record-keeping began in 1851. Image via National Weather Service.

According to Samantha Montano, an emergency-management expert at Massachusetts Maritime Academy, one concern for officials regarding 2020’s Atlantic hurricane season is the effect that the coronavirus will have on the volunteer responders. Many volunteers won’t be able to fly to disaster zones, she said, and those who are able to go will have a harder time interacting with people. Montano told the New York Times:

Volunteers do everything, handing out donations, moving debris off the roads, gutting houses, helping survivors navigate state and federal aid programs.

Back view of 4 people in headphones looking toward the front windows of an aircraft.

The flight deck of NOAA Lockheed WP-3D Orion N42RF during a flight into Hurricane Harvey in August 2017. Harvey was a devastating Category 4 hurricane that made landfall in Texas and Louisiana, causing catastrophic flooding and many deaths. It is tied with 2005’s Hurricane Katrina as the costliest tropical cyclone on record. Image via Lt. Kevin Doremus/ NOAA.

Bottom line: Multiple climate factors indicate above-normal activity is most likely in 2020, according to NOAA’s 2020 Atlantic Hurricane Season Outlook.

Via NOAA

Read more: Global warming is making hurricane stronger


from EarthSky https://ift.tt/2yQKulu

Impact of coronavirus on cancer services revealed – over 2 million people waiting for screening, tests and treatments

Cancer Research doctor in PPE

COVID-19 has placed a huge strain on cancer services in the UK.  

It’s been felt in all areas of cancer care – from screening and diagnosis through to cancer treatment, as we’ve blogged about before. And new figures have revealed the sheer scale of this disruption – estimating that over 2 million people in the UK are waiting for screening, tests and treatments since lockdown began 10 weeks ago 

Our chief clinician, Professor Charles Swanton, has seen firsthand the devastating impact this pandemic is having on patients. “Delays to diagnosis and treatment could mean that some cancers will become inoperable. Patients shouldn’t need to wait for this to be over before getting the treatment they need.” 

“We can create a safe environment for both staff and cancer patients if testing efforts ramp up quickly.” 

Screening and diagnosis 

When you break down the figures, delays to cancer screening is responsible for the bulk of the backlog, with around 2.1 million people waiting for breast, bowel or cervical screening.  

Screening services have been formally ‘paused in Scotland, Wales and Northern Ireland due to COVID-19 and are effectively paused in England – with invitations not being sent out from screening hubs.  

For every week that’s screening is paused, 7,000 people aren’t being referred for further tests and 380 cancers aren’t being diagnosed through screening programmes.  

But while the screening backlog is big, potentially the biggest impact on survival is being felt in cancer diagnosis and treatment.  

There’s been a significant drop in the number of urgent referrals for cancer, often reported as ‘two-week wait figures’, with 290,000 fewer people being referred for further tests than normal.  

This drop is largely because fewer people are going to their GP with symptoms that might be cancer, but we’ve heard that some GPs are also reluctant to risk sending their patient to hospital for further tests, and some diagnostic services – such as endoscopies – have been put on hold due to the risk of spreading COVID-19.  

Urgent referrals dropped to around 25% of usual levels in England at the start of the pandemic but have since started to rebound, with figures at around 50% of usual levels in recent weeks. But for each week referrals stay below 100%, the number of cancer cases that are going undiagnosed will continue to stack up.  

The cancer community has been working hard to get the message out there that the NHS is still open for business and that people should contact their doctor if they are worried about symptoms – and this must continue.  

But patients also need to be confident that they are safe if they do go to the doctor, so ensuring that hospitals have ‘COVID-protected’ safe spaces to carry out cancer tests will be vital to getting urgent and non-urgent referrals back on track. 

Treatment 

Despite national guidelines stating that urgent and essential cancer treatments must continue, the impact of COVID-19 has been felt in cancer wards across the country, with surgery worst hit.  

Around 12,750 people are waiting for cancer surgery across the UK, as the number of operations has fallen to around 60% of expected levels. Chemotherapy has also taken a hit, with 6,000 fewer people than expected receiving chemotherapy since lockdown began. 

Radiotherapy services have experienced the least disruption, with appointments falling by 10% during the pandemic. But the real impact to the service might be masked by the fact that some people have had radiotherapy instead of other treatments like surgery. It’s estimated that 2,800 fewer people have received radiotherapy because of COVID-19.  

While some of this is due to the pressures faced by an overstretched NHS and a lack of recovery or ICU beds, some treatment was delayed because it could make people more vulnerable to severe illness with coronavirus.  

“There have been some difficult discussions with patients about their safety and ability to continue treatment during this time,” says Michelle Mitchell, our chief executive. But we’re over the peak of the pandemic now, and cancer care is starting to get up and running.” 

We’re seeing cancer services across the UK adapting to COVID-19, with COVID-protected safe spaces being set up to allow cancer treatment to be delivered safely 

But for this to work, it requires regular testing for COVID-19 in all patients and staff working in these places, whether they have COVID-19 symptoms or not. 

The road ahead – more COVID-19 testing 

The Government has committed to reach 200,000 tests day in the UK. But we’ve heard from Trusts that not everyone who needs to get a test are able to access it, and test results are taking too long to come back. 

We’ve estimated that between 21,000 and 37,000 COVID-19 tests must be done each day to ensure COVID-protected safe spaces for cancer diagnosis and treatment. This assumes that staff are tested weekly and patients are tested before they come into hospital and potentially when they are there for treatment – but more regular testing will be needed.    

While testing is vital, this must also be supported by staff having enough PPE and embedding infection control measures consistently.  

Securing safe spaces for cancer services is an urgent the first step that must be taken to support the recovery for cancer services. It is critical that testing is ramped up as quickly as possible.  

Staff in hospitals around the country are working extremely hard and with more testing of staff and patients – with and without symptoms – we will have hospitals and centres free of COVID-19 where patients can be treated safely,” says Swanton.  

Katie

We need your help to secure safe spaces for cancer services.

> Demand urgent action now.  


from Cancer Research UK – Science blog https://ift.tt/2BoV0S9