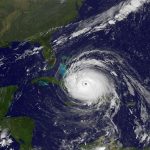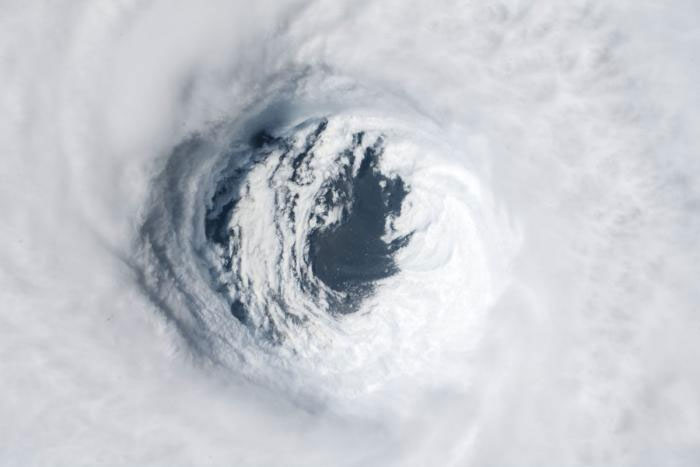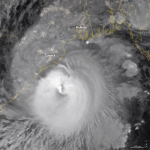
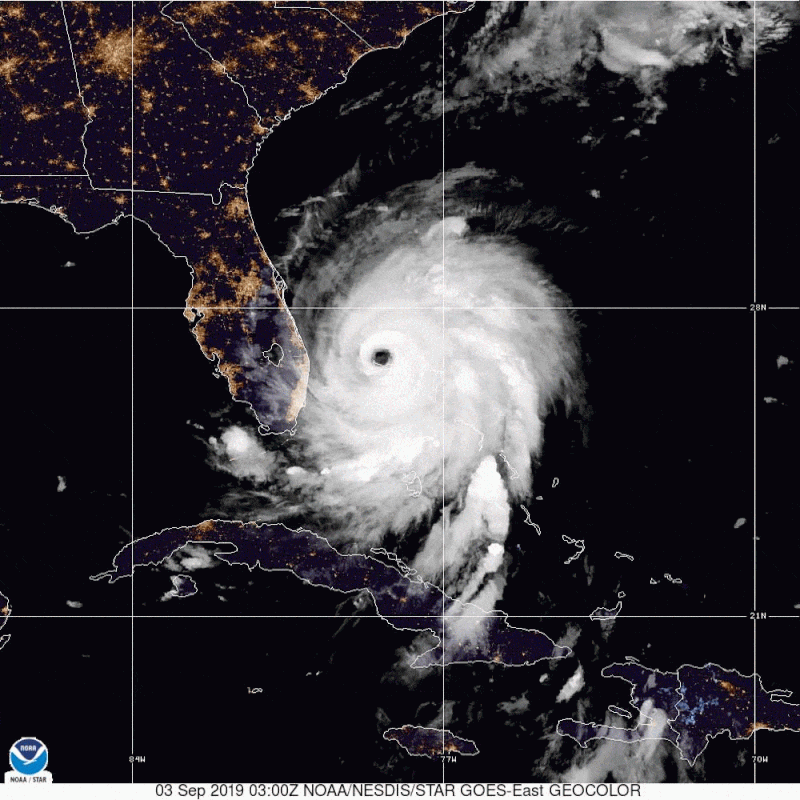
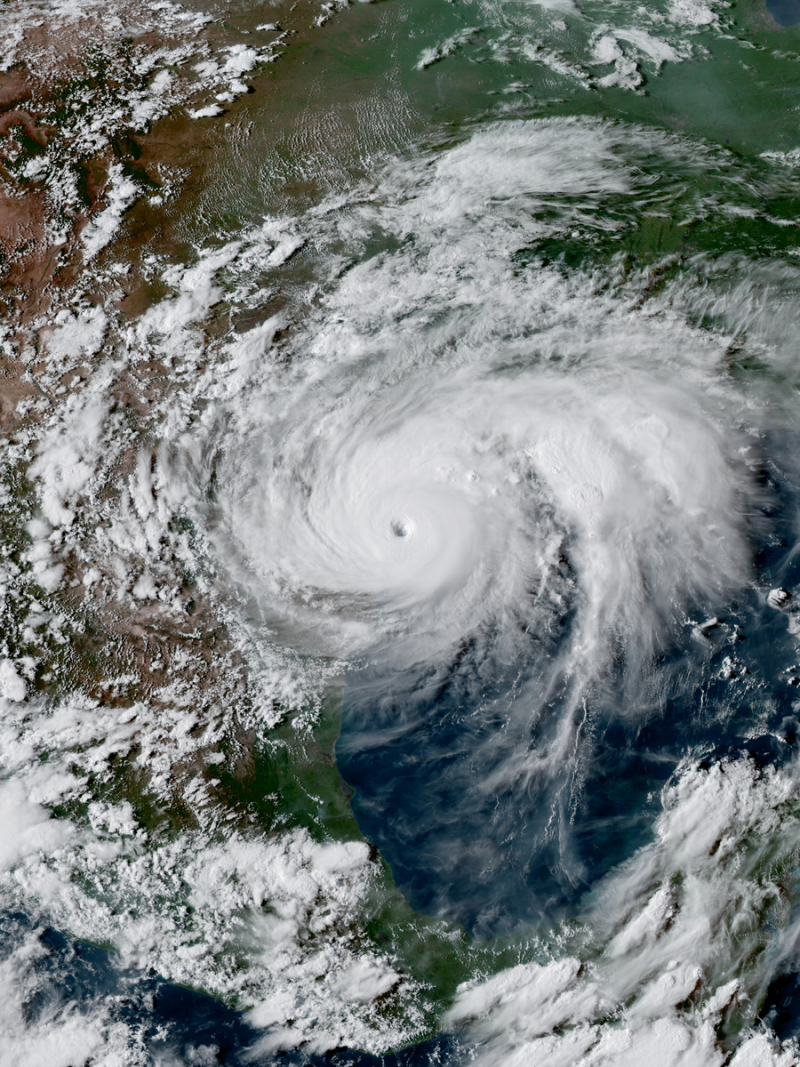
Hurricane Dorian on September 3, 2019. It was the 4th named storm, 2nd hurricane and 1st Category 5 hurricane of the 2019 Atlantic hurricane season. It’s also the 4th-strongest Atlantic hurricane (as measured by 1-minute sustained wind speeds) since reliable record-keeping began in 1851. Image via GOES-East.
Scientists study all the ways hurricanes are likely to change in this century as Earth gets warmer. They also want to know – and this is a hard question to answer – if hurricanes are already being affected by the Earth warming that’s happened thus far. This week, scientists at the University of Wisconsin weighed in with a new analysis of nearly 40 years of satellite imagery of hurricanes. Their results say that – over the past four decades – hurricanes have become more intense and destructive.
James Kossin is a NOAA scientist based at the University of Wisconsin-Madison. He’s lead author of the new paper published May 18 in the peer-reviewed Proceedings of the National Academy of Sciences. The analysis shows that Earth warming has increased the likelihood of a hurricane developing into a major one of Category 3 or higher, with sustained winds greater than 110 miles an hour (177 kph), by about 8% a decade. Kossin said in a statement:
Through modeling and our understanding of atmospheric physics, the study agrees with what we would expect to see in a warming climate like ours.
He was even more definite about the link between global warming and stronger hurricanes in what he told the New York Times:
The trend is there, and it is real. There’s this remarkable building of this body of evidence that we’re making these storms more deleterious.
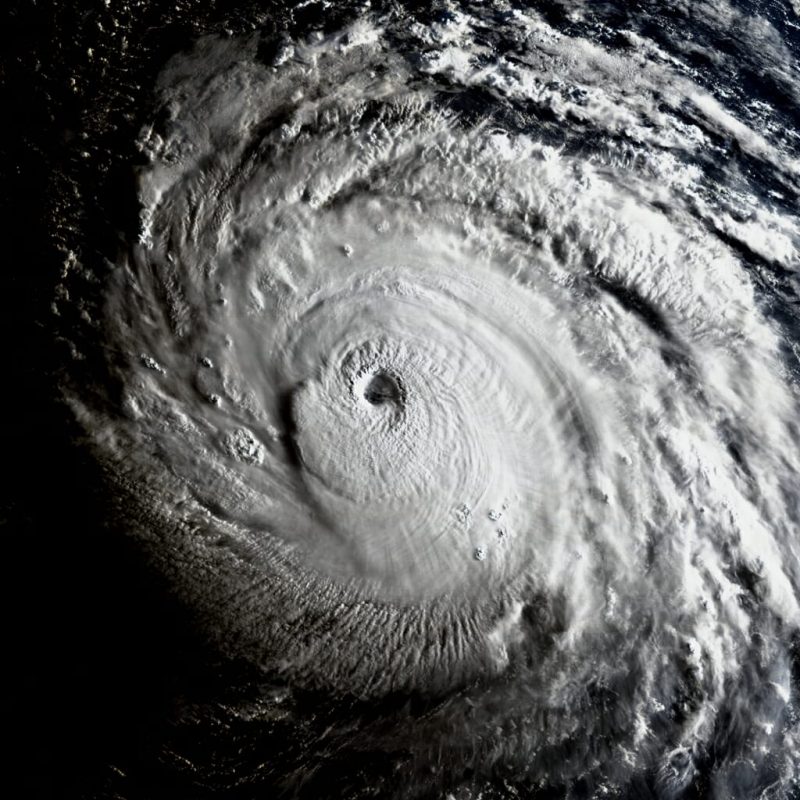
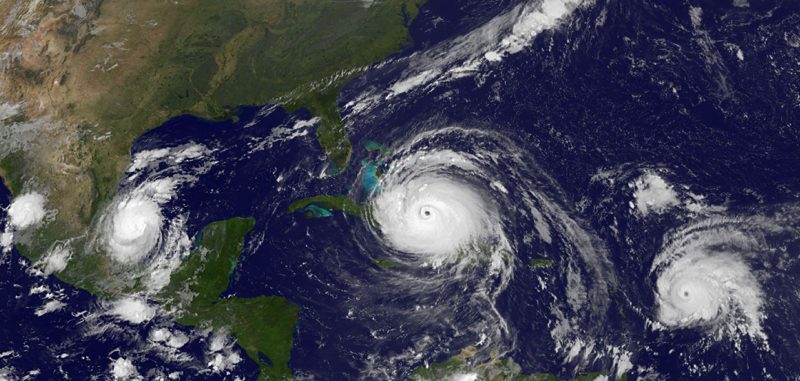
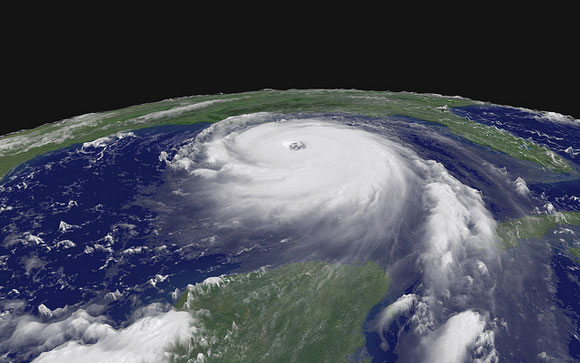
A visible light image of Hurricane Irma in 2017. Irma was the first Category 5 hurricane on record to strike the Leeward Islands (including the Virgin Islands and Puerto Rico), followed by Hurricane Maria 2 weeks later. At the time, Irma was considered the most powerful hurricane on record in the open Atlantic region, outside of the Caribbean Sea and Gulf of Mexico, until it was surpassed by Hurricane Dorian just 2 years later. Image via GOES-16.
The study comes from scientists at the National Oceanic and Atmospheric Administration (NOAA) National Center for Environmental Information and the University of Wisconsin-Madison Cooperative Institute for Meteorological Satellite Studies. According to these scientists’ statement:
The research builds on Kossin’s previous work, published in 2013, which identified trends in hurricane intensification across a 28-year data set. However, says Kossin, that timespan was less conclusive and required more hurricane case studies to demonstrate statistically significant results.
To increase confidence in the results, the researchers extended the study to include global hurricane data from 1979-2017. Using analytical techniques, including the CIMSS Advanced Dvorak Technique that relies on infrared temperature measurements from geostationary satellites to estimate hurricane intensity, Kossin and his colleagues were able to create a more uniform data set with which to identify trends.
Kossin said:
The main hurdle we have for finding trends is that the data are collected using the best technology at the time. Every year the data are a bit different than last year, each new satellite has new tools and captures data in different ways, so in the end we have a patchwork quilt of all the satellite data that have been woven together.
Kossin’s previous research has shown other changes in hurricane behavior over the decades, such as where they travel and how fast they move. In 2014, he identified poleward migrations of hurricanes, where tropical cyclones are travelling farther north and south, exposing previously less-affected coastal populations to greater risk.
In 2018, he demonstrated that hurricanes are moving more slowly across land due to changes in Earth’s climate. This has resulted in greater flood risks as storms hover over cities and other areas, often for extended periods of time. He said:
Our results show that these storms have become stronger on global and regional levels, which is consistent with expectations of how hurricanes respond to a warming world. It’s a good step forward and increases our confidence that global warming has made hurricanes stronger, but our results don’t tell us precisely how much of the trends are caused by human activities and how much may be just natural variability.
Still, with this study, scientific confidence in the link between global warming and stronger hurricanes continues to grow. As the Weather Channel pointed out in its May 19, 2020, article on this research:
New algorithms by NOAA’s National Centers for Environmental Information (NCEI) indicate that most of the years this decade are very likely to rank among the 10 warmest years, and according to a NOAA/NCEI statistical analysis, 2020 is very likely to rank among the five warmest years. What’s more, hurricanes rank as the costliest U.S. weather and climate disaster. Therefore, it’s important to understand the potential impacts climate change will have on hurricanes in the future.
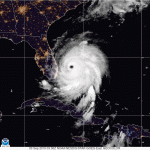
Hurricane Harvey near the coast of Texas at peak intensity late on August 25, 2017. Harvey was a devastating Category 4 hurricane that made landfall in Texas and Louisiana, causing catastrophic flooding and many deaths. It is tied with 2005’s Hurricane Katrina as the costliest tropical cyclone on record. According to Wikipedia, Harvey inflicted $125 billion (2017 USD) in damage, primarily from catastrophic rainfall-triggered flooding in the Houston metropolitan area and Southeast Texas. Image via GOES-16/ Wikimedia Commons.
Bottom line: As Earth gets warmer, hurricanes are expected to get stronger. A study of 40 years of satellite data suggests it’s already happening.
Source: Global increase in major tropical cyclone exceedance probability over the past four decades
Read more from the New York Times
Read more from the The Weather Channel
from EarthSky https://ift.tt/2LGftDP
Hurricane Dorian on September 3, 2019. It was the 4th named storm, 2nd hurricane and 1st Category 5 hurricane of the 2019 Atlantic hurricane season. It’s also the 4th-strongest Atlantic hurricane (as measured by 1-minute sustained wind speeds) since reliable record-keeping began in 1851. Image via GOES-East.
Scientists study all the ways hurricanes are likely to change in this century as Earth gets warmer. They also want to know – and this is a hard question to answer – if hurricanes are already being affected by the Earth warming that’s happened thus far. This week, scientists at the University of Wisconsin weighed in with a new analysis of nearly 40 years of satellite imagery of hurricanes. Their results say that – over the past four decades – hurricanes have become more intense and destructive.
James Kossin is a NOAA scientist based at the University of Wisconsin-Madison. He’s lead author of the new paper published May 18 in the peer-reviewed Proceedings of the National Academy of Sciences. The analysis shows that Earth warming has increased the likelihood of a hurricane developing into a major one of Category 3 or higher, with sustained winds greater than 110 miles an hour (177 kph), by about 8% a decade. Kossin said in a statement:
Through modeling and our understanding of atmospheric physics, the study agrees with what we would expect to see in a warming climate like ours.
He was even more definite about the link between global warming and stronger hurricanes in what he told the New York Times:
The trend is there, and it is real. There’s this remarkable building of this body of evidence that we’re making these storms more deleterious.
A visible light image of Hurricane Irma in 2017. Irma was the first Category 5 hurricane on record to strike the Leeward Islands (including the Virgin Islands and Puerto Rico), followed by Hurricane Maria 2 weeks later. At the time, Irma was considered the most powerful hurricane on record in the open Atlantic region, outside of the Caribbean Sea and Gulf of Mexico, until it was surpassed by Hurricane Dorian just 2 years later. Image via GOES-16.
The study comes from scientists at the National Oceanic and Atmospheric Administration (NOAA) National Center for Environmental Information and the University of Wisconsin-Madison Cooperative Institute for Meteorological Satellite Studies. According to these scientists’ statement:
The research builds on Kossin’s previous work, published in 2013, which identified trends in hurricane intensification across a 28-year data set. However, says Kossin, that timespan was less conclusive and required more hurricane case studies to demonstrate statistically significant results.
To increase confidence in the results, the researchers extended the study to include global hurricane data from 1979-2017. Using analytical techniques, including the CIMSS Advanced Dvorak Technique that relies on infrared temperature measurements from geostationary satellites to estimate hurricane intensity, Kossin and his colleagues were able to create a more uniform data set with which to identify trends.
Kossin said:
The main hurdle we have for finding trends is that the data are collected using the best technology at the time. Every year the data are a bit different than last year, each new satellite has new tools and captures data in different ways, so in the end we have a patchwork quilt of all the satellite data that have been woven together.
Kossin’s previous research has shown other changes in hurricane behavior over the decades, such as where they travel and how fast they move. In 2014, he identified poleward migrations of hurricanes, where tropical cyclones are travelling farther north and south, exposing previously less-affected coastal populations to greater risk.
In 2018, he demonstrated that hurricanes are moving more slowly across land due to changes in Earth’s climate. This has resulted in greater flood risks as storms hover over cities and other areas, often for extended periods of time. He said:
Our results show that these storms have become stronger on global and regional levels, which is consistent with expectations of how hurricanes respond to a warming world. It’s a good step forward and increases our confidence that global warming has made hurricanes stronger, but our results don’t tell us precisely how much of the trends are caused by human activities and how much may be just natural variability.
Still, with this study, scientific confidence in the link between global warming and stronger hurricanes continues to grow. As the Weather Channel pointed out in its May 19, 2020, article on this research:
New algorithms by NOAA’s National Centers for Environmental Information (NCEI) indicate that most of the years this decade are very likely to rank among the 10 warmest years, and according to a NOAA/NCEI statistical analysis, 2020 is very likely to rank among the five warmest years. What’s more, hurricanes rank as the costliest U.S. weather and climate disaster. Therefore, it’s important to understand the potential impacts climate change will have on hurricanes in the future.
Hurricane Harvey near the coast of Texas at peak intensity late on August 25, 2017. Harvey was a devastating Category 4 hurricane that made landfall in Texas and Louisiana, causing catastrophic flooding and many deaths. It is tied with 2005’s Hurricane Katrina as the costliest tropical cyclone on record. According to Wikipedia, Harvey inflicted $125 billion (2017 USD) in damage, primarily from catastrophic rainfall-triggered flooding in the Houston metropolitan area and Southeast Texas. Image via GOES-16/ Wikimedia Commons.
Bottom line: As Earth gets warmer, hurricanes are expected to get stronger. A study of 40 years of satellite data suggests it’s already happening.
Source: Global increase in major tropical cyclone exceedance probability over the past four decades
Read more from the New York Times
Read more from the The Weather Channel
from EarthSky https://ift.tt/2LGftDP