Touching the asteroid Ryugu

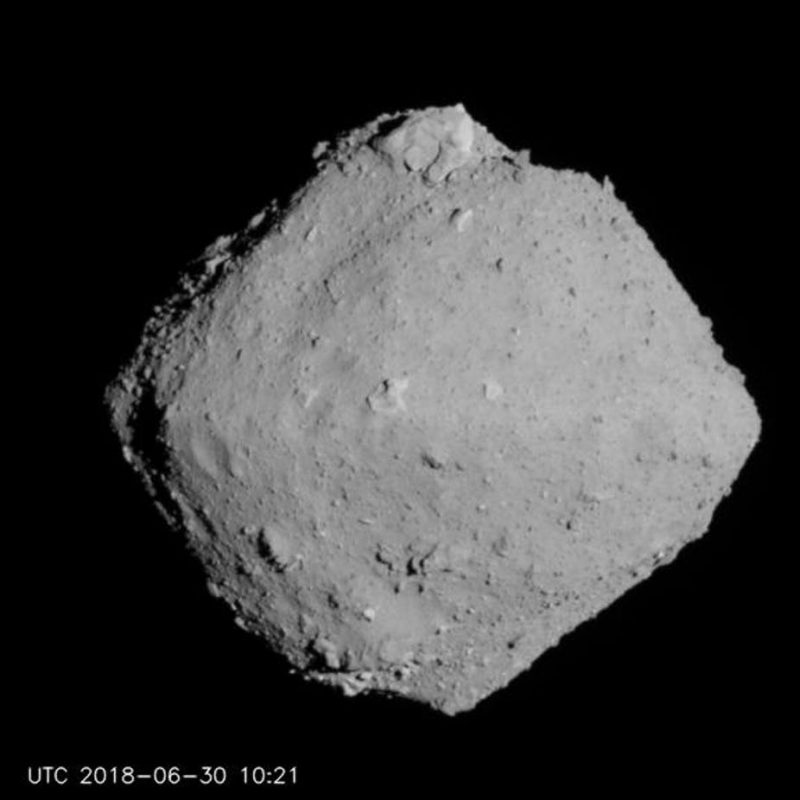
Bumpy, gray squarish object on a black background.

Asteroid Ryugu photographed from a distance of about 12 miles (20 kilometers) looks just gray and bland, but a close-up provides more color. Image via JAXA/ University of Tokyo/ Kochi University/ Rikkyo University/ Nagoya University/ Chiba Institute of Technology/ Meiji University, University of Aizu/ AIST/ The Conversation.

By Paul K. Byrne, North Carolina State University

On February 21, 2019, we shot an asteroid.

More precisely, the Hayabusa2 spacecraft, built and operated by the Japan Aerospace Exploration Agency, or JAXA, fired a 5-gram metal projectile into the surface of the near-Earth asteroid Ryugu, a spinning-top-shaped body about 1 kilometer (.6 mi) across and some 210 million miles (350 million km) from Earth. This projectile disrupted the surface of the asteroid, allowing Hayabusa2 to capture some of the lofted material and tuck it safely away on board. Having departed from Ryugu in November 2019, Hayabusa2 is expected to fly past Earth in late 2020 and release its samples in a reentry capsule for detailed analyses in labs across the world.

In a new paper

published in Science, the Hayabusa2 team reports on their observations of the sampling process itself, and what measurements of Ryugu’s surface generally can tell us of its evolution. These observations paint a remarkable story of a cosmic traveler that traveled from the main asteroid belt, taking a short-lived excursion near the sun, before ultimately settling into an orbit in our neighborhood as a near-Earth asteroid.

I’m a planetary scientist, and I’m fascinated by why planetary bodies look the way they do. By understanding better how and why Ryugu gained its current appearance, we’ll have a more comprehensive model for how solar system bodies form and develop – including common, “C-type” carbonaceous asteroids, of which Ryugu is one.

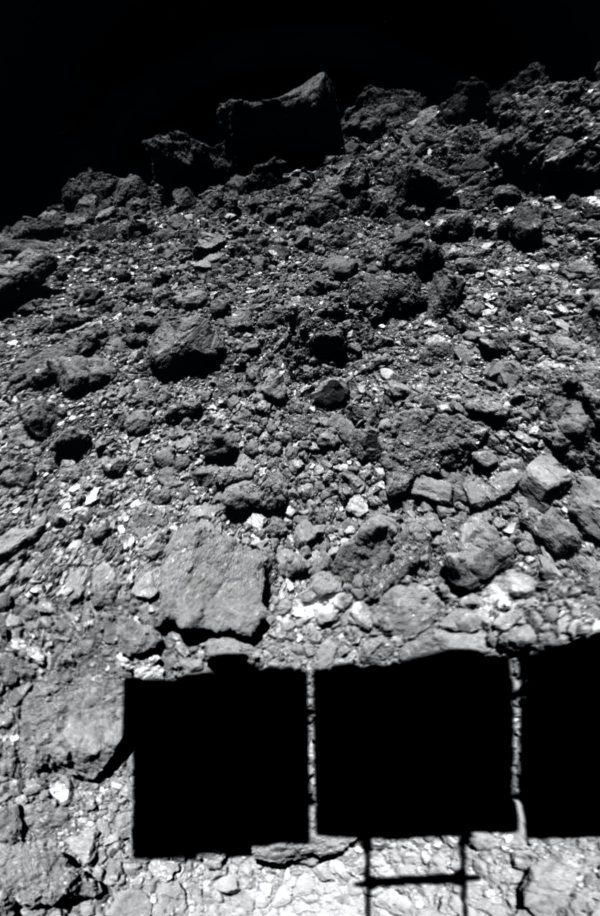
Stark black and white gravelly ground with a rectangular black shadow.

The surface of near-Earth carbonaceous asteroid 162173 Ryugu, as observed by the Hayabusa2 spacecraft just before its landing. The spacecraft’s solar ray paddle casts a shadow on Ryugu’s surface.
JAXA/U. Tokyo/ Kochi U./ Rikkyo U./ Nagoya U./ Chiba Inst. Tech./ Meiji U./ U. Aizu/ AIST/ The Conversation.

A colorful past

The new paper describes how some parts of Ryugu are “bluer” and others are “redder.”

These terms relate to subtle variations in color of the asteroid surface across the visible spectrum. The Hayabusa2 team found that the equator and poles of the asteroid are bluer, whereas the midlatitudes are redder. Intriguingly, this color difference may be tied to age – or, rather, how long material is directly exposed to space. That’s because exposed surfaces are darkened and reddened by space weathering – bombardment by micrometeorites, solar and cosmic particles – and heating by the sun, which is the primary mechanism for Ryugu.

When Hayabusa2 fired its projectile from a distance of about a meter, and then its thrusters to move away from the asteroid, a cloud of redder, dark pebbles and fine grains blew outward before falling back onto the surface. The mission team concluded that these particles, originally only on the exposed surfaces of boulders, landed all over the sampling site, turning it from a slightly blue color to slightly red.

This observation offered the team an insight into the latitudinal “stripes” on Ryugu. Exposed material, reddened by the Sun and by space weathering, slowly moves under the asteroid’s weak gravity from the topographically high equator and poles to the topographically low midlatitudes. This movement exposes fresher, bluer material at the equator and poles and deposits the reddened material in between.

What I found most exciting was that, from the analysis of the size and colors of craters on Ryugu, the Hayabusa2 team concluded that at some point the asteroid must have been closer to the sun that it is now. That would explain the amount of reddening of the surface. Using two different models for calculating the age of craters, the team estimated that this solar heating-induced reddening must have happened either eight million years ago or as recently as 300,000 years ago – a mere blink of an eye, cosmologically speaking.

These crater statistics, based on images collected by Hayabusa2, even show that the age of the overall asteroid surface itself is likely no more than around 17 million years, much younger than the time when the main-belt parent asteroids of Ryugu are thought to have broken apart, which happened hundreds of millions to over a billion years ago.

Moon and Mars before sunrise May 14

Before daybreak on May 14, 2020, look for the moon to be at or near its last quarter phase, and close to the red planet Mars.

Mars is respectably bright now and getting brighter. Still, you’ll want to get up early (an hour or more before sunrise) to view Mars in the predawn sky; it’ll fade from view as dawn is breaking. Excluding our sun, Mars presently ranks as the 8th-brightest “star” to light up the sky. Mars is no match for the king planet Jupiter, which is near it on the sky’s dome and which outshines Mars by nearly 12 times. Jupiter ranks as the 4th-brightest celestial body, after the sun, moon and the planet Venus, respectively.

Earth in its smaller, faster orbit is gaining ground on Jupiter and Mars daily. These planets, in turn, are both brightening in Earth’s sky day by day.

Some 5 months from now – On October 13, 2020 – the Earth will swing in between the sun and Mars, and Mars, in turn, will beam at its brightest best in Earth’s sky for the year. This event is called opposition by astronomers. On October 13, 2020, Mars will be a whopping 16 times brighter than it appears on May 14. In fact, from October 1 to 30, 2020, Mars will actually replace Jupiter as the 4th-brightest celestial object to light up the heavens, after the sun, moon and Venus, respectively.

By the way, Jupiter’s opposition will come only two months from now, on July 14, 2020. Then Jupiter will shine at its brightest in Earth’s sky for the year. On July 14, 2010, Jupiter will be about 1.2 times brighter than it appears on May 14, 2020.

Thus the brightness of Mars changes precipitously, while that of Jupiter remains close to constant. That’s because the percentage of change in the Earth/Mars distance is large whereas the percentage of change in the Earth/Jupiter distance remains rather small.

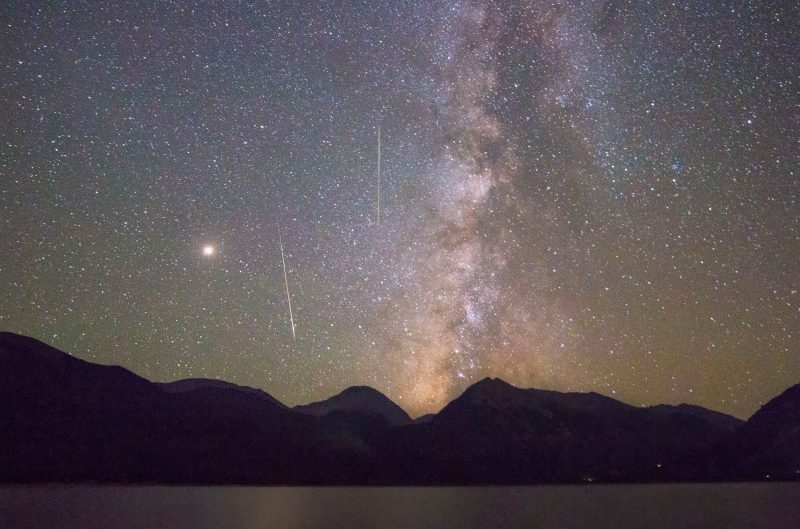
Here is Mars (left) not long after its last opposition in 2018. It was exceptionally bright that year! Joe Randall at Twin Lakes, Colorado caught the planet and the Milky Way during the Perseid meteor shower, August 12, 2018.

About the last quarter moon. Although the moon and Mars appear fairly close together on the sky’s dome, they are not particularly close together in space. The last quarter moon lodges about 247,000 miles (nearly 398,000 km) from Earth, while Mars lies way beyond the moon, at about 425 times the moon’s distance.

Although the last quarter moon occurs at the same instant for all of us worldwide (May 14 at 14:03 UTC), our clocks read differently by time zone. At United States time zones, the last quarter moon comes at 10:03 a.m. EDT, 9:03 a.m. CDT, 8:03 a.m. MDT, 7:03 a.m. PST, 6:03 a.m. AKDT and 4:03 am. HST. The last quarter phase will happen after sunrise May 14 for the most of the United States. As with all last quarter moons, this one will rise around midnight and appear highest in the sky around the time dawn breaks. You might still notice the half-lit quarter moon in a blue daytime sky, as morning progresses. It’ll set around midday. Read more about the last quarter moon.

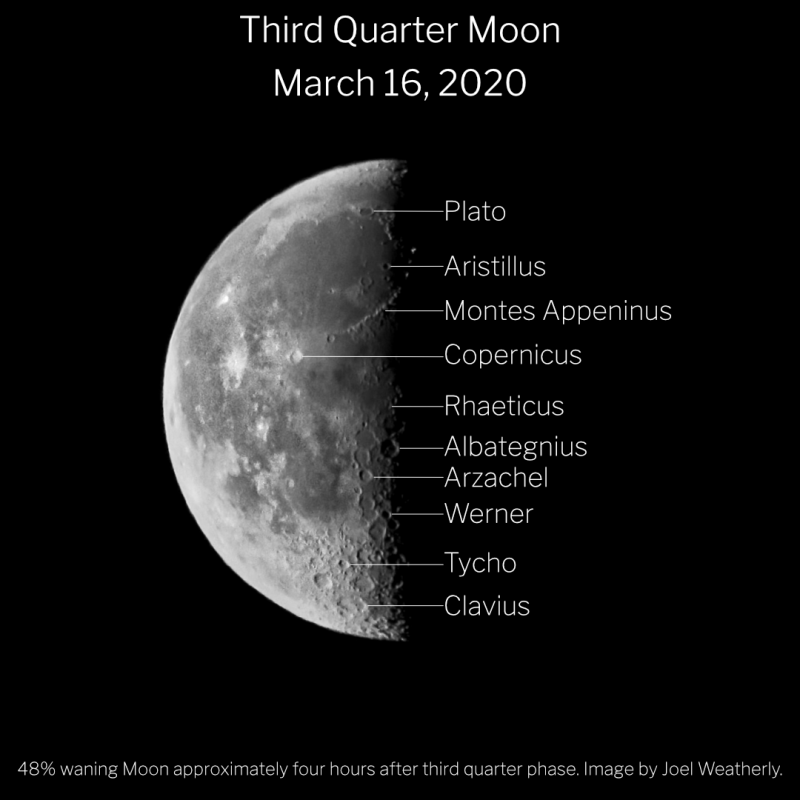
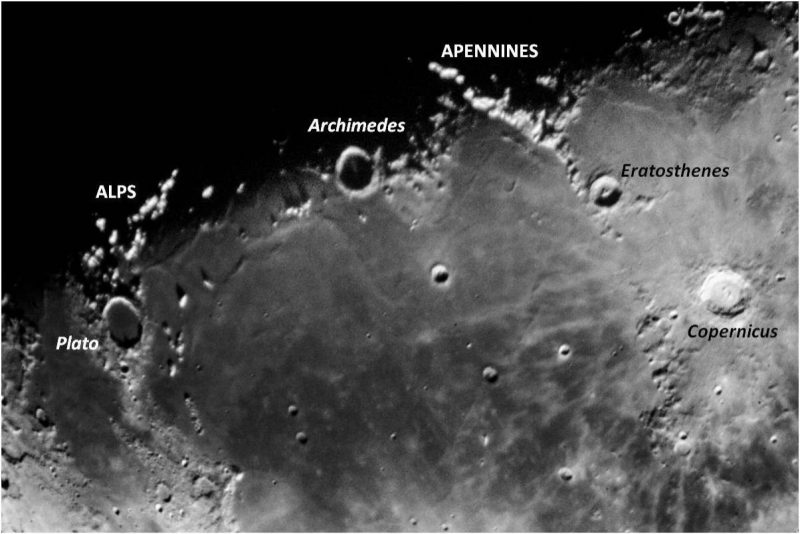
Last quarter moon, with some prominent lunar features annotated.

View at EarthSky Community Photos. | Joel Weatherly in Edmonton, Aberta, Canada wrote on March 16, 2020: “I have been enjoying selenography lately, so here is this morning’s last quarter moon with labels for 10 features I found interesting. This image was captured about 4 hours after the moon exactly reached its last quarter phase.” Thank you, Joel!

Bottom line: On May 14, 2020, the moon is at or near its last quarter phase and close to the red planet Mars on the sky’s dome. Watch for the half-lit moon in the predawn sky; the red planet will be near it.


from EarthSky https://ift.tt/2YXNFCH

The 'Uplift of the Tibetan Plateau' Myth

The 'Uplift of the Tibetan Plateau' Myth

'The uplift of the Tibetan Plateau' is invoked to explain various phenomena, from monsoon dynamics to biodiversity evolution and everything in between. It's not accurate, finds a new paper.

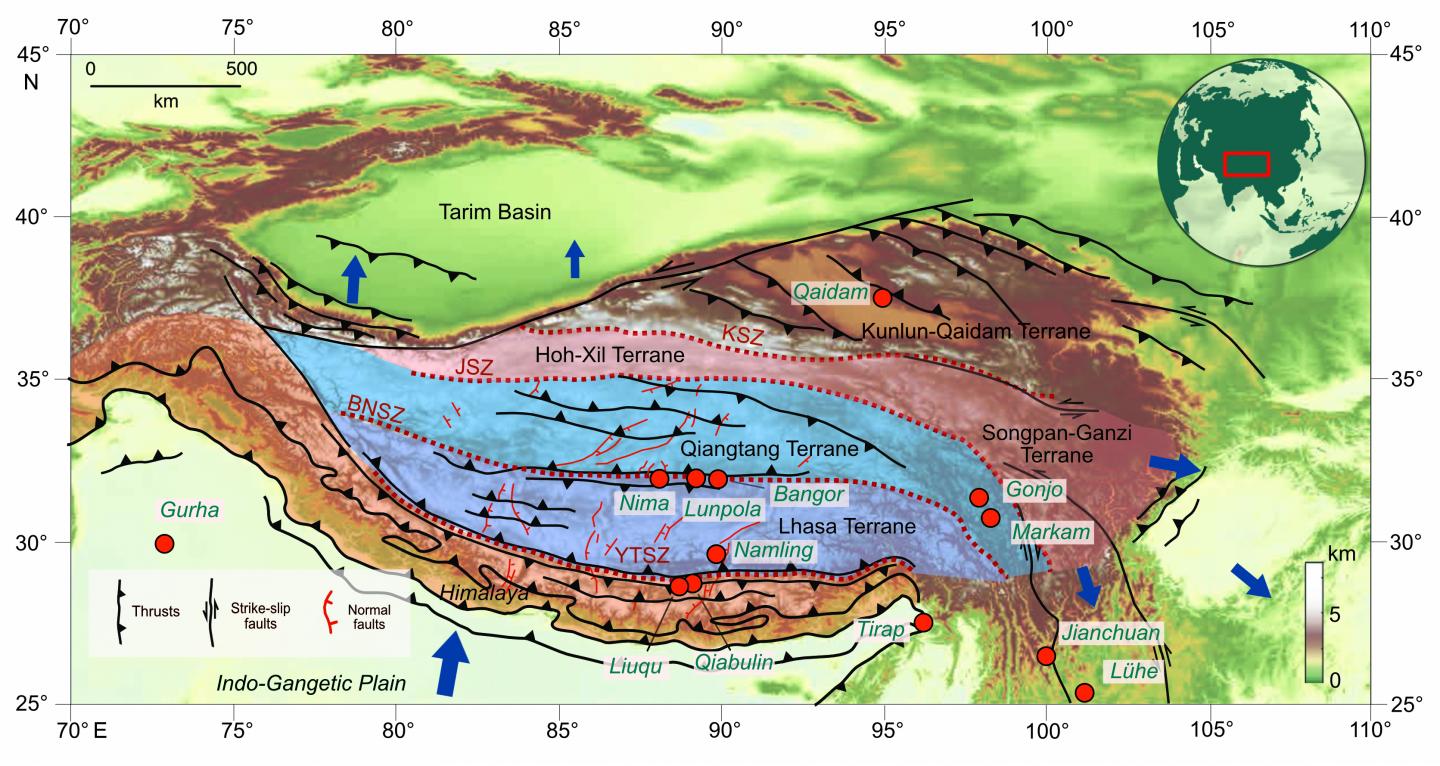
The orogeny of the Tibetan region (Tibet, The Himalaya and the Hengduan Mountains) dates back approximately 200 million years, long before the arrival of India, and was the product of earlier Gondwanan tectonic block collisions that produced a complex of mountain chains and valleys. The review finds that the concept of an extensive low-relief Tibet, rising in its entirety as a result of the India-Eurasia collision, is false, and the product of overly simplistic modeling.

Previous stable isotope and fossil-based estimates of past surface heights were often contradictory; isotopes tend to record the height of mountain crests, while the fossils are more indicative of where sediments accumulate in valley bottoms. The isotopic bias towards uplands means that even valleys appear as uplands at the height of the bounding mountains and so appear as an elevated plateau, a result confirmed by isotope-enabled climate modelling. By combining well-dated multiple paleoaltimetric methods a better understanding of past topography emerges.

The formation of a complex topography, and in places thickened crust, before the arrival of India suggests that the formation of the Tibetan Plateau was not only due to the India-Eurasia collision and this has important implications for the amount of crustal shortening and the size of 'greater India' before collision.


Tibet was assembled by a succession of Gondwanan tectonic blocks (terranes) colliding with Eurasia over a period of about 200 million years.

Previous work pointed to a rise of eastern Tibet and the Hengduan Mountains in the Miocene, but recent radiometric re-dating of key sites shows the region was elevated before plateau formation and the rise of the Himalaya. Uplift began in the Eocene in large part due to extrusion of parts of Tibet beginning as early as ~ 52 million years ago and extended into the early Oligocene, with landscape dissection through the expansion of river drainages taking place in the Miocene (subject to the dating being correct) as the monsoons strengthened.

The Himalaya began to rise in the Eocene, but only crested the pre-existing Gangdese mountains that already formed a 4-5 km high 'wall' along southern Tibet after the mid Miocene. North of the Gangdese, along the Bangong-Nujiang Suture south of the Tangula mountains, a deep ancient east-west aligned great central valley existed until early in the Neogene (approximately 23 million years ago) and later in its history was internally-drained. Numerous fossil finds show lakeside sub-tropical vegetation in this valley remained below 2.3 km above sea level for much of its history, the valley floor only rising in the Neogene to form today's flat plateau through ongoing tectonic compression from India and sediment infilling.

'Uplift' in geology relates to the rise of rocks and work done against gravity, so the infilling of basins by sediment to contribute to the formation of a low-relief surface means that Tibet was never 'uplifted' as a plateau, nor was that rise solely a consequence of the India-Eurasia collision.

sb admin Tue, 05/12/2020 - 10:40
Categories


from ScienceBlogs - Where the world discusses science https://ift.tt/2WsTAOx

Last quarter moon is May 14

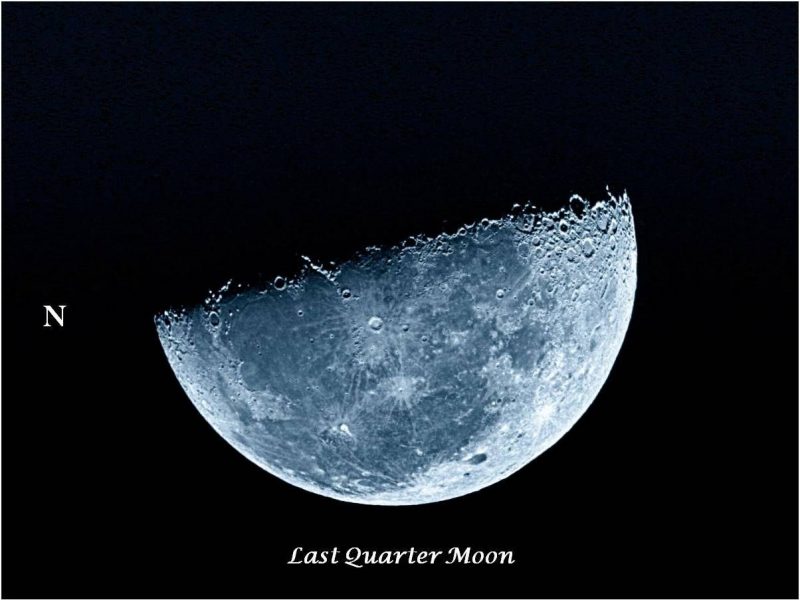
One half the moon's face in sunlight, lighted portion facing downward, left side marked N for north.

View at EarthSky Community Photos. | Dr Ski in Valencia, Philippines, caught the last quarter moon shortly after it rose around midnight on the morning of September 22, 2019. This moon phase is perfect for helping you envision the location of the sun … below your feet. Thanks, Dr Ski!

A last quarter moon appears half-lit by sunshine and half-immersed in its own shadow. It rises in the middle of the night, appears at its highest in the sky around dawn, and sets around midday.

A last quarter moon provides a great opportunity to think of yourself on a three-dimensional world in space. Watch for this moon just after moonrise, shortly after midnight. Then the lighted portion points downward, to the sun below your feet. Think of the last quarter moon as a mirror to the world you’re standing on. Think of yourself standing in the midst of Earth’s nightside, on the midnight portion of Earth.

On a last quarter moon, the lunar terminator – the shadow line dividing day and night – shows you where it’s sunset on the moon.

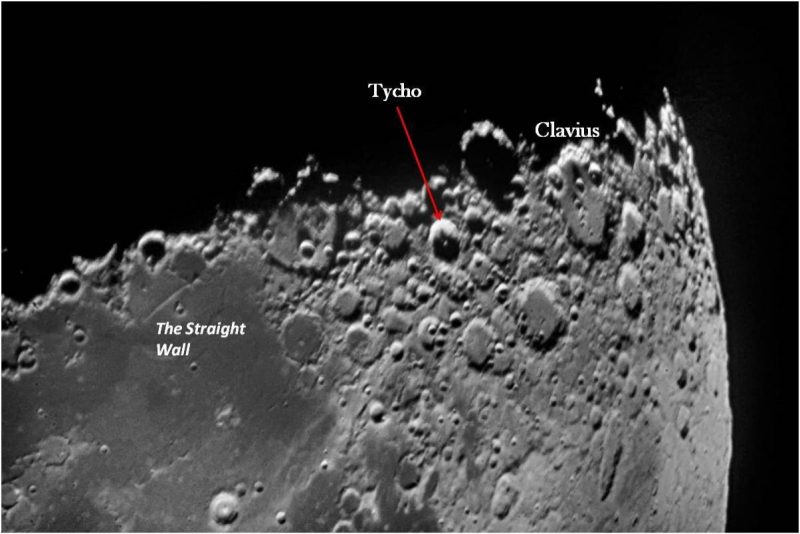
Craters and other features, including a short straight white line on a dark flat mare floor.

View at EarthSky Community Photos. | September 22, 2019, photo by Dr Ski. He wrote: “The moon’s southern limb at last quarter. The Straight Wall is either black or white depending on the angle of the sun’s rays. At lunar sunset (now), it’s white. Around full moon, Tycho is one of the easiest craters to find due to the impact rays emanating from it. It’s like the hub of a spoked wheel! At last quarter, Tycho becomes unremarkable. Clavius, on the other hand, becomes remarkable at high magnification.”

Labeled craters and mountain ranges at the edge between dark and light.

View at EarthSky Community Photos. | September 22, 2019, photo by Dr Ski. He wrote: “The Sea of Rains at last quarter. The lunar Alps and Apennines are bisected by the moon’s meridian. You can get an idea of the height of these mountains by how far they extend into the dark side of the terminator. At an elevation of over 5,000 meters [16,000 feet], the Apennines are twice as tall as the Alps.”

Also, a last quarter moon can be used as a guidepost to Earth’s direction of motion in orbit around the sun.

In other words, when you look toward a last quarter moon high in the predawn sky, for example, you’re gazing out approximately along the path of Earth’s orbit, in a forward direction. The moon is moving in orbit around the sun with the Earth and never holds still. But, if we could somehow anchor the moon in space … tie it down, keep it still … Earth’s orbital speed of 18 miles per second would carry us across the space between us and the moon in only a few hours.

Want to read more about the last quarter moon as a guidepost for Earth’s motion? Astronomer Guy Ottewell talks about it here.

A great thing about using the moon as a guidepost to Earth’s motion is that you can do it anywhere … as, for example, in the photo below, from large cities.

Daytime sky. High small moon, left half visible, above conical-top water tower and tall tan brick chimney.

Ben Orlove wrote from New York City: “I was sitting in the roof garden of my building, and there was the moon, right in front of me. You were right, this is a perfect time to visualize … the Earth’s motion.”

As the moon orbits Earth, it changes phase in an orderly way. Read more: 4 keys to understanding moon phases

Bottom line: The moon reaches its last quarter phase on May 14, 2020, at 14:03 UTC. Translate UTC to your time. In the coming week, watch for the moon to rise in the east in the hours after midnight, waning thinner each morning.


from EarthSky https://ift.tt/2ze0n1D

Listen to the sounds of BepiColombo’s Earth flyby

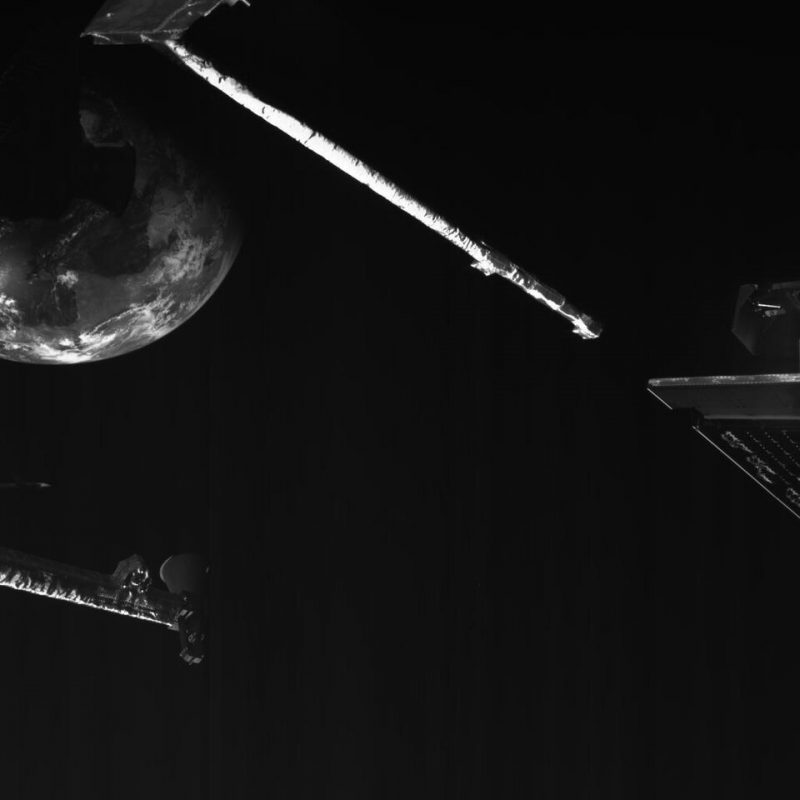
A piece of the spacecraft's antenna in the foreground, and planet Earth in the background.

The BepiColombo mission to Mercury used one of its M-CAM selfie cameras to capture this glimpse of Earth, as the spacecraft hurtled past our planet on April 9. Images like these accompany the audio recordings below; the images correspond with the time when the audio recording was obtained. Read more about this image. Image via ESA.

Here are several more interesting examples of data sonification. The European Space Agency (ESA) released these on May 5, 2020. The data came from the Mercury-bound BepiColombo spacecraft, a mission developed by Europe and Japan. The craft – launched in 2018 – shot past us on April 9, in its first and only Earth flyby of the mission. During the flyby, the craft used Earth’s gravity to speed up and have its course altered slightly, sending it on its way to Mercury and the innermost planet’s many mysteries.

The audio recordings below are a byproduct of the mission, and they yield some science, too. The first two represent the sound of the craft approaching Earth and then passing it. The third comes from data collected when BepiColombo entered Earth’s shadow. The fourth – and eeriest – is based on the spacecraft’s passage through Earth’s magnetic field.

First sonification: BepiColombo approaching Earth

In a statement from ESA, scientist Carmelo Magnafico compared the following recording – of the spacecraft on approach to Earth – to the sound conducted through the rail when a train is approaching. He said:

It’s the same principle as when you put your ear on the rail to hear whether the train is coming.

Magnafico is a team member for an instrument called the Italian Spring Accelerometer (ISA) aboard the BepiColombo spacecraft. This instrument recorded the data used in the sonification above as the craft neared Earth ahead of its April 9 flyby. ESA explained:

The data in the recording were obtained on April 9, as the spacecraft approached the planet from the distance of 256,393 km to 129,488 km [about 160,000 miles to 80,000 miles]. Eight hours of measurements are condensed into a minute of audio. The original frequency of the dataset, inaudible to humans, had to be enhanced by the team from Italy’s National Institute for Astrophysics (INAF) in order to create the audio track.

Second sonification: BepiColombo nearing Earth

The ISA instrument also gathered data used to create the next sonification as BepiColombo approached Earth’s surface from a distance of about 17,000 to about 8,000 miles (27,844 km to 13,107 km). ESA said:

The closest point of the flyby, which enabled BepiColombo to harness Earth’s gravity to tighten its trajectory around the sun, was at the distance of 12,689 km [about 7,900 miles] from Earth’s surface.

Again, the original frequency of the dataset was inaudible to humans. The data were enhanced and condensed so that one hour of measurements would equal about a minute of audio.

Third sonification: BepiColombo in Earth’s shadow

Scientists were particularly interested in data from BepiColombo’s ISA instrument as it showed the moment when the spacecraft entered a 34-minute eclipse period, that is, when BepiColombo was traveling through Earth’s shadow. The craft was past its closest approach to Earth at this point. It was the first time since the craft’s 2018 launch that its solar panels were not in direct sunlight. Carmelo Magnafico said:

The sun produces a little bit of force that acts on the spacecraft’s surface and also on the solar panel surface. When the spacecraft goes into the shadow, the effect disappears, and you can see a jump in acceleration in our plot and hear a change in the volume and characteristics of the related sound …

This is an extraordinary situation. Since we started the cruise, we have only been in direct sunshine, so we did not have the possibility to check effectively whether our instrument is measuring the variations of the force of the sunlight. This is a proof for us that the instrument is quite well-calibrated because the jump in the acceleration we measured is in line with our expectations.

When the spacecraft enters the shadow and the force of the sun disappears, we can hear a slight vibration. The solar panels, previously flexed by the sun, then find a new balance. Upon exiting the shadow, we can hear the effect again.

Hearing a clear effect of such a subtle influence showed the instrument is capable of registering the smallest differences in motion.

You can hear it when the spacecraft enters the shadow and then exits it at about 15,500 miles (24,861 km) from Earth. The recording ends when the spacecraft reaches the distance of nearly 20,000 miles (31,785 km).

Fourth sonification: Sound of Earth’s magnetic field

The magnetometer on board the Mercury Planetary Orbiter, one of the two orbiters composing the BepiColombo mission, made measurements of Earth’s magnetic field during the spacecraft’s April 9 flyby.

ESA explained what you heard in the audio recording above this way:

The audio, accompanied by the animation, is a sonification of the captured data created by the MPO-MAG team and not an actual sound recorded in space. The audio, compressing 8 hours of recorded data into a 26-second audio track, shows the moment when BepiColombo encounters the so-called bow shock at the outer edge of the Earth’s magnetosphere where the Earth’s magnetic field interacts with the solar wind. The spacecraft then passes through the magnetosheath, a turbulent region still considerably affected by the cosmic plasma, and crosses the magnetopause, the boundary after which the magnetic field of Earth dominates.

After that point, the sound of BepiColombo’s reaction wheels, which keep the spacecraft oriented in the correct direction, comes to the fore in the recording.

According to MPO-MAG Principal Investigator Daniel Heyner, of the Technical University of Braunschweig, Germany, the team could use the data recorded during the flyby to calibrate the instrument and prepare it for future measurements. The magnetometer will be on for most of BepiColombo’s seven-year cruise to the innermost planet of the solar system, measuring the solar wind at various distances from the sun.

Bottom line: ESA has released several audio recordings that use the technique of data sonification, based on data collected by the European-Japanese spacecraft BepiColombo during its April 9, 2020, Earth flyby.

Via ESA

Top 5 mysteries that BepiColombo will solve

Cool! A Hubble photo translated to music


from EarthSky https://ift.tt/3ctnFmG

The Yeast All Around Us

The Yeast All Around Us

With people confined to their homes, there is more interest in home-baked bread than ever before. And that means a lot of people are making friends with yeast for the first time. I am a professor of hospitality management and a former chef, and I teach in my university’s fermentation science program.

As friends and colleagues struggle for success in using yeast in their baking – and occasionally brewing – I’m getting bombarded with questions about this interesting little microorganism.

A little cell with a lot of power

Yeasts are single-celled organisms in the fungus family. There are more than 1,500 species of them on Earth. While each individual yeast is only one cell, they are surprisingly complex and contain a nucleus, DNA and many other cellular parts found in more complicated organisms.

Yeasts break down complex molecules into simpler molecules to produce the energy they live on. They can be found on most plants, floating around in the air and in soils across the globe. There are 250 or so of these yeast species that can convert sugar into carbon dioxide and alcohol – valuable skills that humans have used for millennia. Twenty-four of these make foods that actually taste good.

Among these 24 species is one called Saccharomyces cerevisiae, which means “sugar-eating fungus.” This is bread yeast, the yeast we humans know and love most dearly for the food and drinks it helps us make.

<p>An invisible organism with worldwide influence. <span><a href="https://www.gettyimages.com/detail/illustration/yeast-saccharomyces-cerevisiae-illustration-royalty-free-illustration/1088373806?adppopup=true"> KATERYNA KON/SCIENCE PHOTO LIBRARY via Getty Images via The Conversation</a></span></p>

An invisible organism with worldwide influence. KATERYNA KON/SCIENCE PHOTO LIBRARY via Getty Images via The Conversation

The process starts out the same whether you are making bread or beer. Enzymes in the yeast convert sugar into alcohol and carbon dioxide. With bread, a baker wants to capture the carbon dioxide to leaven the bread and make it rise. With beer, a brewer wants to capture the alcohol.

Bread has been “the staff of life” for thousands of years. The first loaf of bread was probably a happy accident that occurred when some yeast living on grains began to ferment while some dough for flatbreads – think matzo or crackers – was being made. The first purposely made leavened bread was likely made by Egyptians about 3,000 years ago. Leavened bread is now a staple in almost every culture on Earth. Bread is inexpensive, nutritious, delicious, portable and easy to share. Anywhere wheat, rye or barley could be grown in sufficient quantities, bread became the basic food in most people’s diet.


Yeast makes bread fluffy and flavorful. Poh Kim Yeoh/EyeEm via Getty Images via The Conversation


No yeast, no bread


When you mix yeast with a bit of water and flour, the yeast begins to eat the long chains of carbohydrates found in the flour called starches. This does two important things for baking: It changes the chemical structure of the carbohydrates, and it makes bread rise.

When yeast breaks down starch, it produces carbon dioxide gas and ethyl alcohol. This CO2 is trapped in the dough by stringy protein strands called gluten and causes the dough to rise. After baking, those little air pockets are locked into place and result in airy, fluffy bread.

But soft bread is not the only result. When yeast break down the starches in flour, it turns them into flavorful sugars. The longer you let the dough rise, the stronger these good flavors will be, and some of the most popular bread recipes use this to their advantage.


The supermarket’s out of yeast; now what?


Baking bread at home is fun and easy, but what if your store doesn’t have any yeast? Then it’s sourdough to the rescue!

Yeast is everywhere, and it’s really easy to collect yeast at home that you can use for baking. These wild yeast collections tend to gather yeasts as well as bacteria – usually Lactobacillus brevis that is used in cheese and yogurt production – that add the complex sour flavors of sourdough. Sourdough starters have been made from fruits, vegetables or even dead wasps. Pliny the Elder, the Roman naturalist and philosopher, was the first to suggest the dead wasp recipe, and it works because wasps get coated in yeasts as they eat fruit. But please don’t do this at home! You don’t need a wasp or a murder hornet to make bread. All you really need to make sourdough starter is wheat or rye flour and water; the yeast and bacteria floating around your home will do the rest.

To make your own sourdough starter, mix a half-cup of distilled water with a half-cup of whole wheat flour or rye flour. Cover the top of your jar or bowl loosely with a cloth, and let it sit somewhere warm for 24 hours. After 24 hours, stir in another quarter-cup of distilled water and a half-cup of all-purpose flour. Let it sit another 24 hours. Throw out about half of your doughy mass and stir in another quarter-cup of water and another half-cup of all-purpose flour.

Keep doing this every day until your mixture begins to bubble and smells like rising bread dough. Once you have your starter going, you can use it to make bread, pancakes, even pizza crust, and you will never have to buy yeast again.


Lab yeast

Yeast is used in laboratories and factories as well as kitchens. borzywoj/iStock/Getty Images Plus via Getty Images via The Conversation


More than just bread and booze


Because of their similarity to complicated organisms, large size and ease of use, yeasts have been central to scientific progress for hundreds of years. Study of yeasts played a huge role in kick-starting the field of microbiology in the early 1800s. More than 150 years later, one species of yeast was the first organism with a nucleus to have its entire genome sequenced. Today, scientists use yeast in drug discovery and as tools to study cell growth in mammals and are exploring ways to use yeast to make biofuel from waste products like cornstalks.

Yeast is a remarkable little creature. It has provided delicious food and beverages for millennia, and to this day is a huge part of human life around the world. So the next time you have a glass of beer, toast our little friends that make these foods part of our enjoyment of life.

By Jeffrey Miller, Associate Professor, Hospitality Management, Colorado State University. This article is republished from The Conversation under a Creative Commons license. Read the original article.

The Conversation

sb admin Mon, 05/11/2020 - 11:54
Categories


from ScienceBlogs - Where the world discusses science https://ift.tt/2SUDZ7U

Jupiter gives us Pluto in 2020

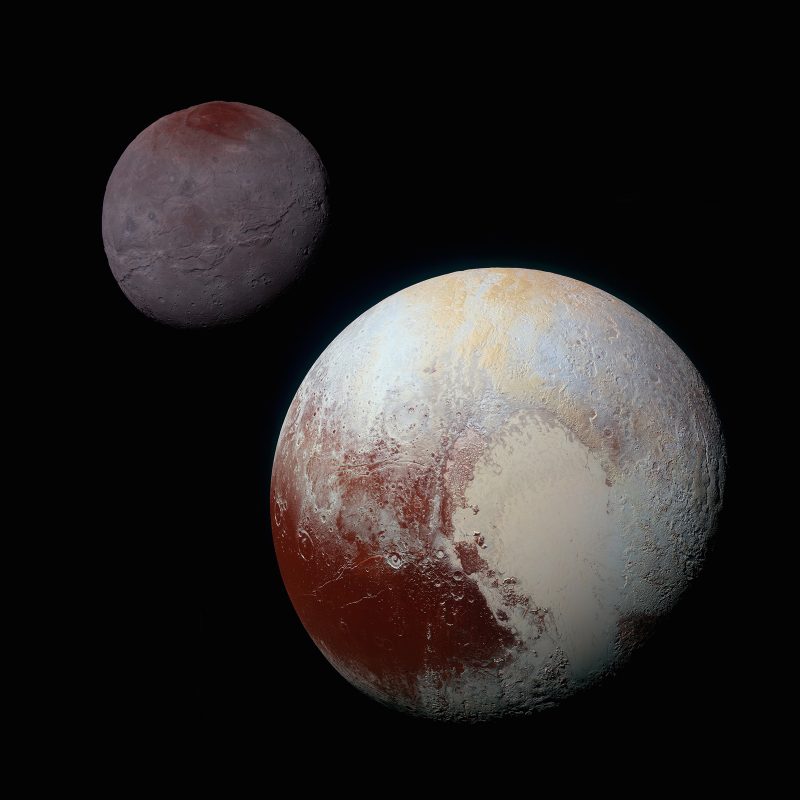
Multi-colored gray, russet, and tan planet with gray moon.

Mosaic image of Pluto and its largest moon Charon, captured around the time the New Horizons spacecraft swept closest to them on July 14, 2015. Image via NASA/ JHUAPL/ SwRI.

The king planet Jupiter is as hard to miss with the eye alone as the dwarf planet Pluto is difficult to find with the telescope. Jupiter is bright! It ranks as the fourth-brightest celestial object to light up the heavens, after the sun, moon and planet Venus. Pluto, on the other hand, is faint. It’s about 1,600 times dimmer than the faintest star visible to the unaided eye. It’s true that the best time of year to see Pluto through a small telescope is around the planet’s yearly opposition, when Earth is going between Pluto and the sun. That’ll happen this year on July 15-16, 2020.

However, this year – 2020 – is exceptional for Jupiter and Pluto. These two worlds are having a triple conjunction. They’ll come together, move apart, and come together again three times in 2020. The first conjunction took place on April 5. The second one will come on June 30, and the final one on November 12. Because all of these Jupiter-Pluto conjunctions happen when these two planets are actually visible in our night sky (as opposed to being lost in the sun’s glare), this year’s Jupiter-Pluto alignment may be the best for centuries to come.

This year, very bright Jupiter and very faint Pluto will remain near each other throughout the year, closely aligned in front of the constellation Sagittarius. Pluto requires a telescope to be seen. No telescope? Try NASA’s Night Sky Network to find star parties and/or astronomy clubs near you. And you don’t need a telescope to use your imagination. Throughout 2020, dazzling Jupiter will enable us to envision Pluto with the mind’s eye on the sky’s dome. First find Jupiter and – presto – you’ve nearly stumbled upon Pluto. Just remember, Jupiter outshines Pluto by several million times.

Where are these worlds now? Both Pluto and Jupiter came out from behind the sun in January 2020, and then hovered low in the east before sunrise. Now – in May 2020 – these two worlds come up around midnight (midway between sunset and sunrise) at mid-northern latitudes, and at late evening for the Southern Hemisphere. Jupiter and Pluto climb upward throughout the nighttime morning hours, to reach the meridian at or near dawn on these May 2020 mornings.
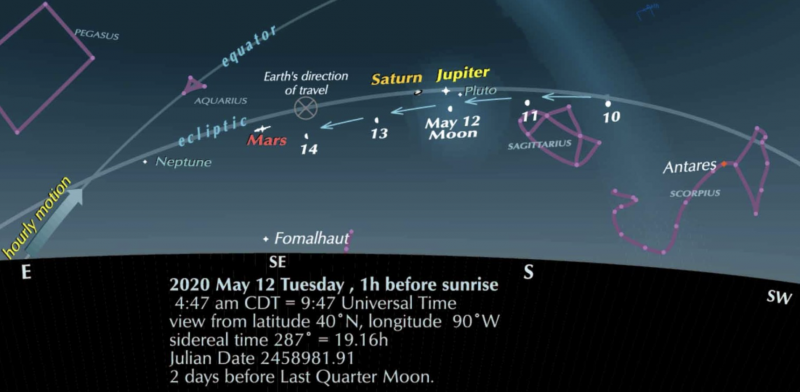
Chart showing the morning sky for several dates around May 12, 2020.

View larger. | Use the waning moon to catch the morning planets – Jupiter, Saturn and Mars – from May 11 to 14, 2020. Pluto is up there, too, near Jupiter, but it’s much too faint to view with the eye alone and very tough to catch in the moon’s glare, even with a telescope. On May 12, the moon sweeps to the south of Pluto around 6 UTC, and then some four hours later, swings south of Jupiter around 10 UTC. The 2nd of 3 Jupiter/Pluto conjunctions will occur on June 30. Read more about the view on May 12 from Guy Ottewell or from EarthSky’s Bruce McClure.

Of course, although Jupiter and Pluto nearly align along the same line of sight throughout 2020, these two worlds aren’t close together in space. Jupiter is a bit more than 5 astronomical units (AU) from the sun, while Pluto lodges way beyond Jupiter, in the Kuiper Belt, at about 34 AU from the sun. One astronomical unit (AU) = one sun/Earth distance.

Jupiter’s and Pluto’s present distance in AU via Heavens-Above

Here’s some observational data about Pluto for 2020, from In-the-Sky.org
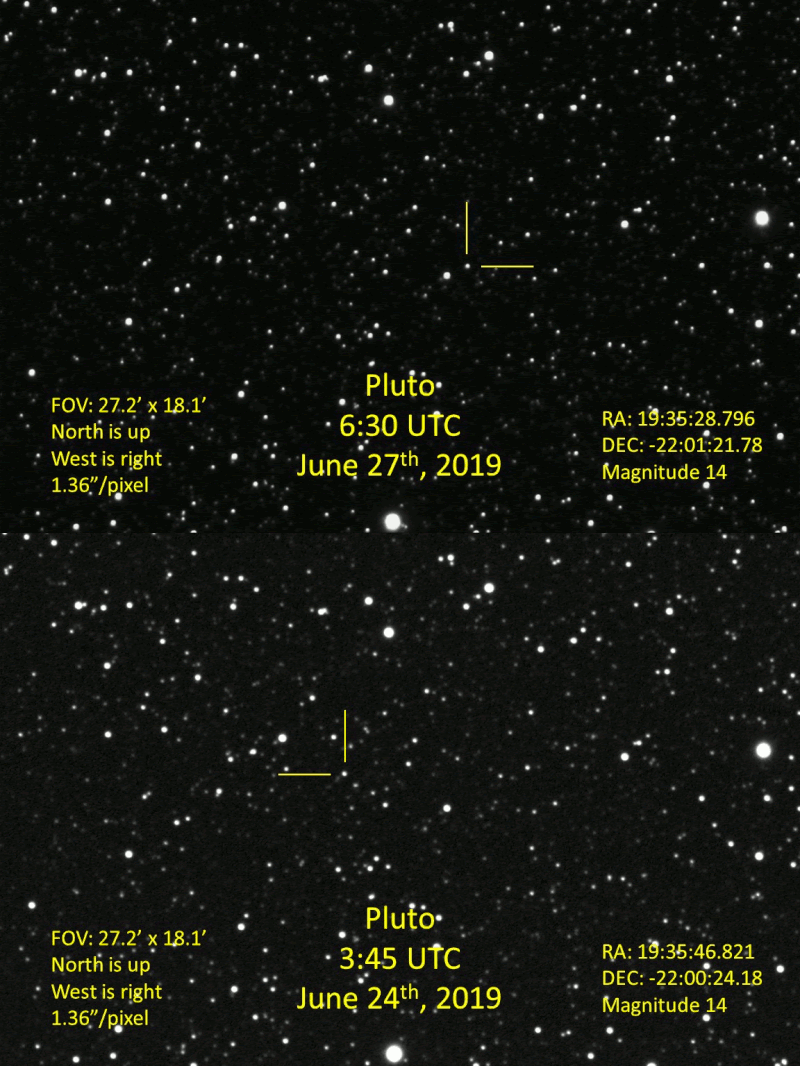
In a star field, one tiny dot jumps from one position to another.

Steven Bellavia in Mattituck, New York, captured Pluto on 2 separate nights, June 24 and June 27, 2019. In this animated gif, you can see that Pluto moved in front of the stars between those 2 nights. Steven wrote: “Most of the motion you see is actually from the Earth, not Pluto, since our motion changes our perspective of the much-closer Pluto against the backdrop of the much-farther stars.” Thanks, Steven!

Two planets are said to be in conjunction whenever they reside north and south of one another on the sky’s dome. Conjunctions of Jupiter and Pluto recur in periods of 12 to 13 years. The previous Jupiter-Pluto conjunction happened on December 11, 2007, and the one before that on December 2, 1994. After 2020, the next Jupiter-Pluto conjunction will occur on February 4, 2033, and the one following that on April 12, 2045. But the gap between Jupiter and Pluto at each one of these conjunctions is quite far apart, and the conjunctions of 1994, 2007, and 2033 happen so close to the sun that even Jupiter is lost in the sun’s glare.

Far and away, 2020 presents the best alignment of Jupiter and Pluto in the 21st century (2001 to 2100). What’s more, Jupiter and Pluto stage three conjunctions this year, as Jupiter passes less than one degree north of Pluto at each conjunction on April 5, June 30 and November 12, 2020. (For reference, the moon’s angular diameter spans about 1/2 degree of sky.) All of these conjunctions in 2020 take place in front of the constellation Sagittarius, with Jupiter first passing Pluto on April 5 in prograde (going eastward in front of the backdrop stars), then sweeping past Pluto on June 30 in retrograde (going westward relative to the background stars), and then for the final Jupiter-Pluto conjunction on November 12 in prograde (eastward).
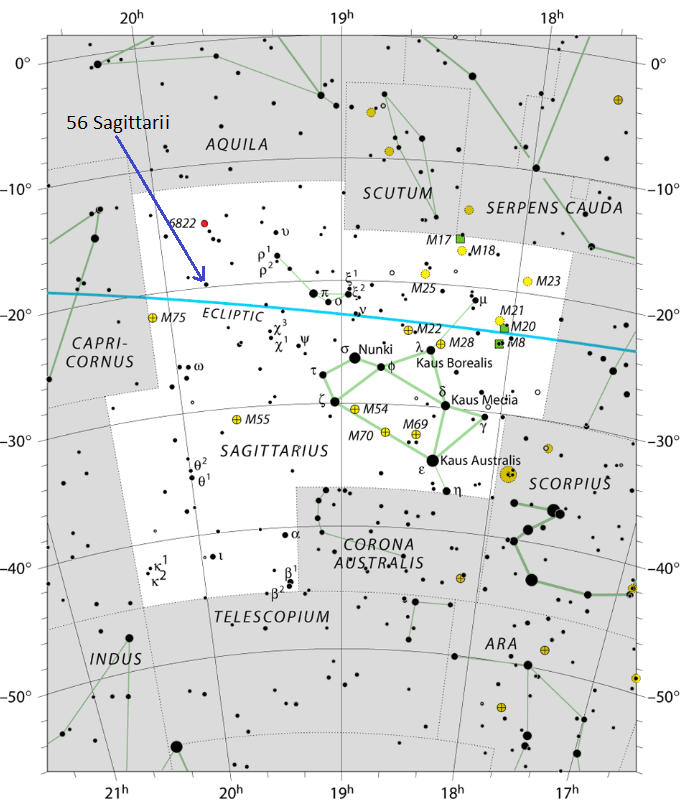
Sky chart of the constellation Sagittarius with the ecliptic running across the chart.

All three Jupiter-Saturn conjunctions on April 5, June 30 and November 12, 2020 take pace place in front of the constellation Sagittarius, not far from the 5th-magnitude star 56 Sagittarii. Constellation chart via International Astronomical Union (IAU).

Most of the time, a Jupiter-Pluto conjunction in any year is a solitary event, as Jupiter laps Pluto going eastward, and never looks back. Triple conjunctions of Jupiter and Pluto – which occur over a period of about 7.4 months – are rare because Jupiter has to first catch Pluto going prograde (eastward), then in retrograde (westward) and then in prograde (eastward) again. The three-peat performance last happened in 1955-56 (November 2, 1955; February 8 and June 16, 1956), and will next occur in 2106-07 (July 13 and November 2, 2106; February 19, 2107). Yet, all three conjunctions in 1955-56 were widely spaced, and all three conjunctions in 2106-07 will be widely spaced, too.
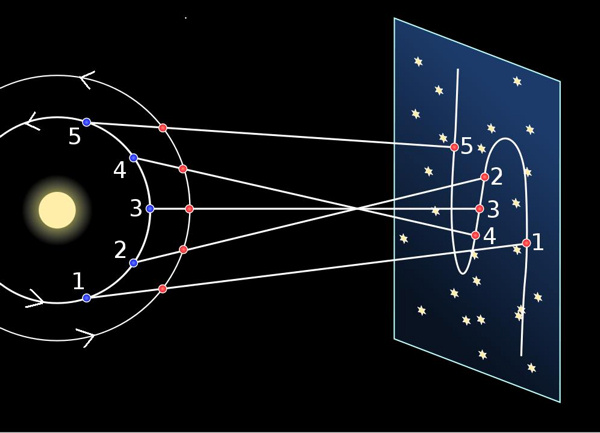
Diagram of planetary orbits projected onto a vertical screen.

Illustration showing why a superior planet appears to go in retrograde (westward in front of the backdrop stars of the zodiac). As seen from the north side of the solar system, all the planets orbit counter-clockwise. When the faster-moving Earth goes by a slower-moving superior planet, that planet appears to go backward (in retrograde). In 2020, Mars is in retrograde from September 9 to November 15, Jupiter from May 14 to September 13, and Saturn from May 11 to September 29. Image via Wikimedia Commons.

In other words, as we said above, 2020 may well showcase the best Jupiter-Pluto alignment for centuries to come. Most excitingly, both Jupiter and Pluto will reach opposition in mid-July 2020. At opposition, a superior planet – any planet revolving around the sun outside of Earth’s orbit – resides opposite the sun in Earth’s sky.
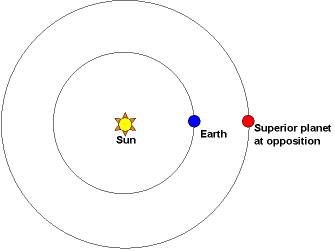
Diagram showing Earth between an outer planet and the sun.

Opposition happens when Earth flies between a superior planet, like Mars, and the sun. This happens yearly for most of the outer planets (and every other year for Mars). Illustration via Heavens-Above.

At opposition, a superior planet (or superior dwarf planet) rises at sunset and sets at sunrise, and is out all night long. It’s at opposition that a planet shines at its brightest best in Earth’s sky, and it’s at or near opposition that a planet comes closest to Earth for the year.

Jupiter reaches opposition on July 14, 2020, at about 8:00 UTC, and comes closest to Earth on July 15, 2020, at about 10:00 UTC.

Pluto reaches opposition on July 15, 2020, at about 19:00 UTC, and comes closest to Earth on July 13, 2020, at about 9:00 UTC.

In an uncanny bit of timing, the oppositions of Jupiter and Pluto happen almost concurrently in mid-July 2020. A planet reaches opposition midway through a retrograde. However, since Pluto resides so much farther from the sun than Jupiter does, Pluto’s retrograde lasts nearly 1 1/2 months (six weeks) longer than Jupiter’s four-month retrograde. So for near-unison oppositions, Pluto’s retrograde has to start – and end – approximately three weeks before – and after – Jupiter’s retrograde.

Jupiter and Pluto retrograde/opposition in 2020

Jupiter begins retrograde: May 14, 2020, in front of the constellation Sagittarius
Jupiter at opposition: July 14, 2020, in front of the constellation Sagittarius
Jupiter ends retrograde: September 13, 2020, in front of the constellation Sagittarius

Pluto begins retrograde: April 25, 2020, in front of the constellation Sagittarius
Pluto at opposition: July 15, 2020, in front of the constellation Sagittarius
Pluto ends retrograde: October 4, 2020, in front of the constellation Sagittarius

Jupiter-Pluto conjunction tables via Richard Nolle

Call it serendipity or synergy – or whatever – but the spectacular alignment of the king planet Jupiter with the dwarf planet Pluto doesn’t get much better than in 2020. A similarly good Jupiter-Pluto rendezvous might not happen again for a number of centuries to come.

Scattered bright dots of stars with one smaller one marked, the planet Pluto.

Pluto as seen with a 12″ S/C telescope (14.3 mag.) on July 10, 2015. Photo by Efrain Morales of Sociedad de Astronomia del Caribe. More information about Pluto’s current location.

Bottom line: Jupiter can help you find – or at least envision – Pluto in 2020. That’s because these two worlds are having a triple conjunction this year; they’ll be near each other 3 times in 2020.


from EarthSky https://ift.tt/2XkisVG
Multi-colored gray, russet, and tan planet with gray moon.

Mosaic image of Pluto and its largest moon Charon, captured around the time the New Horizons spacecraft swept closest to them on July 14, 2015. Image via NASA/ JHUAPL/ SwRI.

The king planet Jupiter is as hard to miss with the eye alone as the dwarf planet Pluto is difficult to find with the telescope. Jupiter is bright! It ranks as the fourth-brightest celestial object to light up the heavens, after the sun, moon and planet Venus. Pluto, on the other hand, is faint. It’s about 1,600 times dimmer than the faintest star visible to the unaided eye. It’s true that the best time of year to see Pluto through a small telescope is around the planet’s yearly opposition, when Earth is going between Pluto and the sun. That’ll happen this year on July 15-16, 2020.

However, this year – 2020 – is exceptional for Jupiter and Pluto. These two worlds are having a triple conjunction. They’ll come together, move apart, and come together again three times in 2020. The first conjunction took place on April 5. The second one will come on June 30, and the final one on November 12. Because all of these Jupiter-Pluto conjunctions happen when these two planets are actually visible in our night sky (as opposed to being lost in the sun’s glare), this year’s Jupiter-Pluto alignment may be the best for centuries to come.

This year, very bright Jupiter and very faint Pluto will remain near each other throughout the year, closely aligned in front of the constellation Sagittarius. Pluto requires a telescope to be seen. No telescope? Try NASA’s Night Sky Network to find star parties and/or astronomy clubs near you. And you don’t need a telescope to use your imagination. Throughout 2020, dazzling Jupiter will enable us to envision Pluto with the mind’s eye on the sky’s dome. First find Jupiter and – presto – you’ve nearly stumbled upon Pluto. Just remember, Jupiter outshines Pluto by several million times.

Where are these worlds now? Both Pluto and Jupiter came out from behind the sun in January 2020, and then hovered low in the east before sunrise. Now – in May 2020 – these two worlds come up around midnight (midway between sunset and sunrise) at mid-northern latitudes, and at late evening for the Southern Hemisphere. Jupiter and Pluto climb upward throughout the nighttime morning hours, to reach the meridian at or near dawn on these May 2020 mornings.

Chart showing the morning sky for several dates around May 12, 2020.

View larger. | Use the waning moon to catch the morning planets – Jupiter, Saturn and Mars – from May 11 to 14, 2020. Pluto is up there, too, near Jupiter, but it’s much too faint to view with the eye alone and very tough to catch in the moon’s glare, even with a telescope. On May 12, the moon sweeps to the south of Pluto around 6 UTC, and then some four hours later, swings south of Jupiter around 10 UTC. The 2nd of 3 Jupiter/Pluto conjunctions will occur on June 30. Read more about the view on May 12 from Guy Ottewell or from EarthSky’s Bruce McClure.

Of course, although Jupiter and Pluto nearly align along the same line of sight throughout 2020, these two worlds aren’t close together in space. Jupiter is a bit more than 5 astronomical units (AU) from the sun, while Pluto lodges way beyond Jupiter, in the Kuiper Belt, at about 34 AU from the sun. One astronomical unit (AU) = one sun/Earth distance.

Jupiter’s and Pluto’s present distance in AU via Heavens-Above

Here’s some observational data about Pluto for 2020, from In-the-Sky.org

In a star field, one tiny dot jumps from one position to another.

Steven Bellavia in Mattituck, New York, captured Pluto on 2 separate nights, June 24 and June 27, 2019. In this animated gif, you can see that Pluto moved in front of the stars between those 2 nights. Steven wrote: “Most of the motion you see is actually from the Earth, not Pluto, since our motion changes our perspective of the much-closer Pluto against the backdrop of the much-farther stars.” Thanks, Steven!

Two planets are said to be in conjunction whenever they reside north and south of one another on the sky’s dome. Conjunctions of Jupiter and Pluto recur in periods of 12 to 13 years. The previous Jupiter-Pluto conjunction happened on December 11, 2007, and the one before that on December 2, 1994. After 2020, the next Jupiter-Pluto conjunction will occur on February 4, 2033, and the one following that on April 12, 2045. But the gap between Jupiter and Pluto at each one of these conjunctions is quite far apart, and the conjunctions of 1994, 2007, and 2033 happen so close to the sun that even Jupiter is lost in the sun’s glare.

Far and away, 2020 presents the best alignment of Jupiter and Pluto in the 21st century (2001 to 2100). What’s more, Jupiter and Pluto stage three conjunctions this year, as Jupiter passes less than one degree north of Pluto at each conjunction on April 5, June 30 and November 12, 2020. (For reference, the moon’s angular diameter spans about 1/2 degree of sky.) All of these conjunctions in 2020 take place in front of the constellation Sagittarius, with Jupiter first passing Pluto on April 5 in prograde (going eastward in front of the backdrop stars), then sweeping past Pluto on June 30 in retrograde (going westward relative to the background stars), and then for the final Jupiter-Pluto conjunction on November 12 in prograde (eastward).

Sky chart of the constellation Sagittarius with the ecliptic running across the chart.

All three Jupiter-Saturn conjunctions on April 5, June 30 and November 12, 2020 take pace place in front of the constellation Sagittarius, not far from the 5th-magnitude star 56 Sagittarii. Constellation chart via International Astronomical Union (IAU).

Most of the time, a Jupiter-Pluto conjunction in any year is a solitary event, as Jupiter laps Pluto going eastward, and never looks back. Triple conjunctions of Jupiter and Pluto – which occur over a period of about 7.4 months – are rare because Jupiter has to first catch Pluto going prograde (eastward), then in retrograde (westward) and then in prograde (eastward) again. The three-peat performance last happened in 1955-56 (November 2, 1955; February 8 and June 16, 1956), and will next occur in 2106-07 (July 13 and November 2, 2106; February 19, 2107). Yet, all three conjunctions in 1955-56 were widely spaced, and all three conjunctions in 2106-07 will be widely spaced, too.

Diagram of planetary orbits projected onto a vertical screen.

Illustration showing why a superior planet appears to go in retrograde (westward in front of the backdrop stars of the zodiac). As seen from the north side of the solar system, all the planets orbit counter-clockwise. When the faster-moving Earth goes by a slower-moving superior planet, that planet appears to go backward (in retrograde). In 2020, Mars is in retrograde from September 9 to November 15, Jupiter from May 14 to September 13, and Saturn from May 11 to September 29. Image via Wikimedia Commons.

In other words, as we said above, 2020 may well showcase the best Jupiter-Pluto alignment for centuries to come. Most excitingly, both Jupiter and Pluto will reach opposition in mid-July 2020. At opposition, a superior planet – any planet revolving around the sun outside of Earth’s orbit – resides opposite the sun in Earth’s sky.

Diagram showing Earth between an outer planet and the sun.

Opposition happens when Earth flies between a superior planet, like Mars, and the sun. This happens yearly for most of the outer planets (and every other year for Mars). Illustration via Heavens-Above.

At opposition, a superior planet (or superior dwarf planet) rises at sunset and sets at sunrise, and is out all night long. It’s at opposition that a planet shines at its brightest best in Earth’s sky, and it’s at or near opposition that a planet comes closest to Earth for the year.

Jupiter reaches opposition on July 14, 2020, at about 8:00 UTC, and comes closest to Earth on July 15, 2020, at about 10:00 UTC.

Pluto reaches opposition on July 15, 2020, at about 19:00 UTC, and comes closest to Earth on July 13, 2020, at about 9:00 UTC.

In an uncanny bit of timing, the oppositions of Jupiter and Pluto happen almost concurrently in mid-July 2020. A planet reaches opposition midway through a retrograde. However, since Pluto resides so much farther from the sun than Jupiter does, Pluto’s retrograde lasts nearly 1 1/2 months (six weeks) longer than Jupiter’s four-month retrograde. So for near-unison oppositions, Pluto’s retrograde has to start – and end – approximately three weeks before – and after – Jupiter’s retrograde.

Jupiter and Pluto retrograde/opposition in 2020

Jupiter begins retrograde: May 14, 2020, in front of the constellation Sagittarius
Jupiter at opposition: July 14, 2020, in front of the constellation Sagittarius
Jupiter ends retrograde: September 13, 2020, in front of the constellation Sagittarius

Pluto begins retrograde: April 25, 2020, in front of the constellation Sagittarius
Pluto at opposition: July 15, 2020, in front of the constellation Sagittarius
Pluto ends retrograde: October 4, 2020, in front of the constellation Sagittarius

Jupiter-Pluto conjunction tables via Richard Nolle

Call it serendipity or synergy – or whatever – but the spectacular alignment of the king planet Jupiter with the dwarf planet Pluto doesn’t get much better than in 2020. A similarly good Jupiter-Pluto rendezvous might not happen again for a number of centuries to come.

Scattered bright dots of stars with one smaller one marked, the planet Pluto.

Pluto as seen with a 12″ S/C telescope (14.3 mag.) on July 10, 2015. Photo by Efrain Morales of Sociedad de Astronomia del Caribe. More information about Pluto’s current location.

Bottom line: Jupiter can help you find – or at least envision – Pluto in 2020. That’s because these two worlds are having a triple conjunction this year; they’ll be near each other 3 times in 2020.


from EarthSky https://ift.tt/2XkisVG