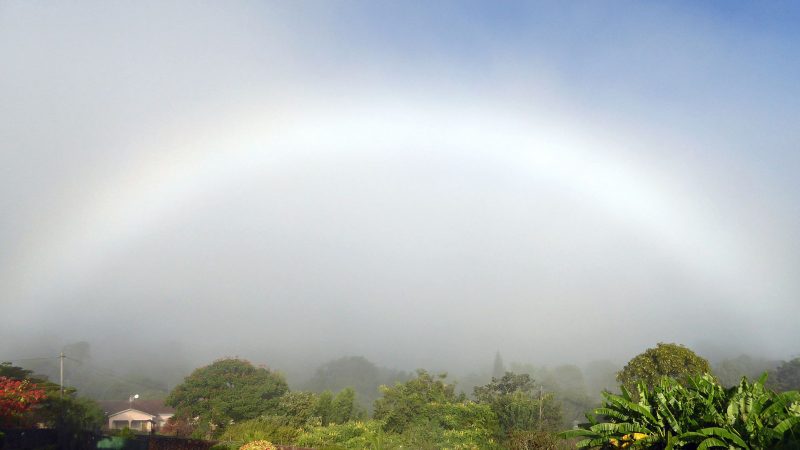
View larger at EarthSky Community Photos. | Peter Lowenstein caught this fogbow in Mutare, Zimbabwe, on April 29, 2020. He wrote: “Half-an-hour after the Sun rose behind my house on Wednesday, a beautiful fogbow developed in the middle of a misty morning view from my front veranda. All the conditions were right – bright sunshine from the rear with the Sun less than twenty degrees above the horizon and clearing clouds of mist at the antisolar point. The scene was framed by a beautiful flowering Poinsettia to the left, a lush banana grove to the right, and clear blue sky beginning to appear on top!”
Fogbows – sometimes called white rainbows, cloudbows or ghost rainbows – are made much as rainbows are, from the same configuration of sunlight and moisture. Rainbows happen when the air is filled with raindrops, and you always see a rainbow in the direction opposite the sun. Fogbows are much the same, always opposite the sun, but fogbows are caused by the small droplets inside a fog or cloud rather than larger raindrops.
Look for fogbows in a thin fog when the sun is bright. You might see one when the sun breaks through a fog. Or watch for fogbows over the ocean.
Because the water droplets in fog are so small, fogbows have only weak colors or are colorless.
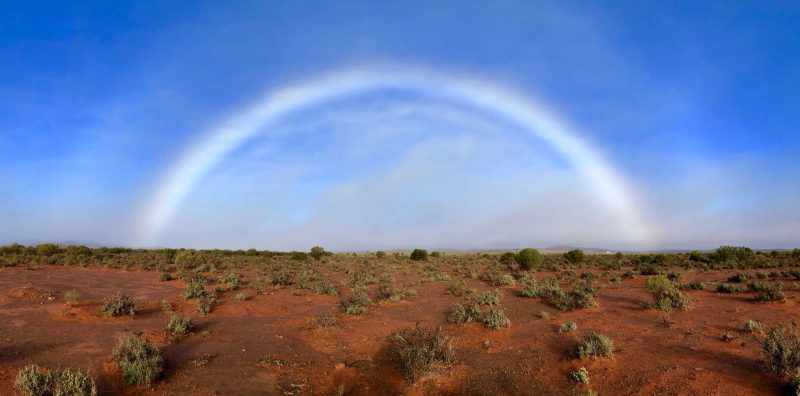
View at EarthSky Community Photos. | Alan Nicolle in New South Wales, Australia, captured this image on July 16, 2019. He wrote: “I was out geocaching in the outskirts of Broken Hill, when I turned back to see this fogbow developing. I took quite a few photos with the iPhone, and rode back to the car on my bike, but by the time I got back to the car to use my SLR, it had faded.” Thank you, Alan!

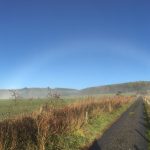
Edith Smith in Aberdeenshire, Scotland, captured this fogbow on November 1, 2018. She wrote: “The camera spotted it before I did with eye, as I was too engrossed in foggy conditions.”
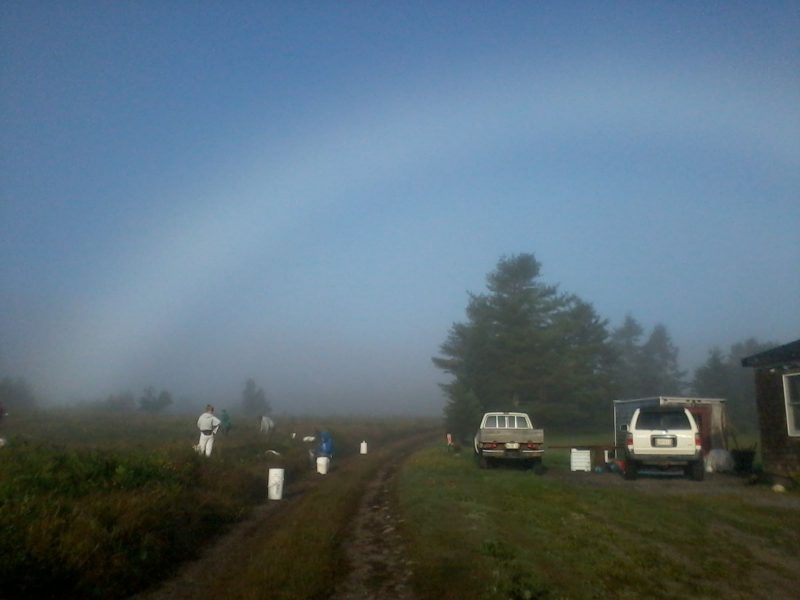
Tommy Johnson captured this early morning fogbow near Jonesport, Maine, in August 2016. He wrote: “Early in the morning and blueberry rakers are starting to fill their buckets with the fruit. I called out to them to look at the fogbow, it was the first time any of us had seen one.”
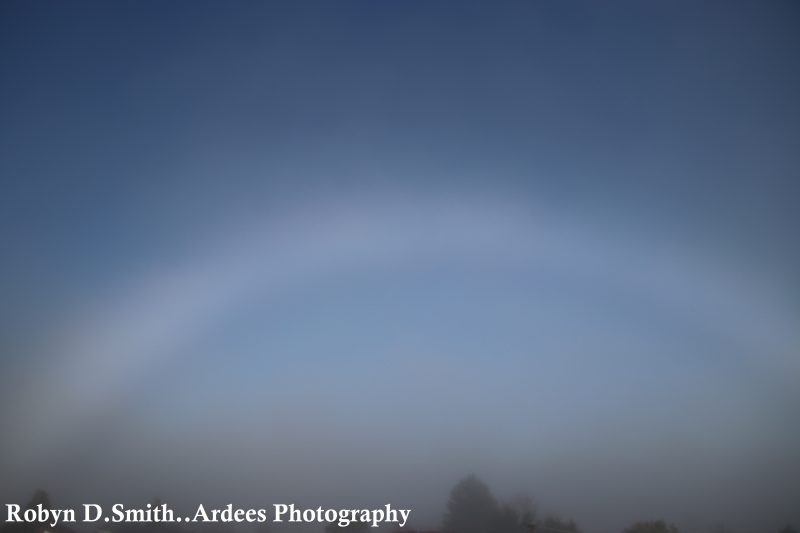
Wonderful fogbow caught by Robyn Smith in New Zealand on the morning of September 19, 2017 “… opposite the foggy sunrise.”
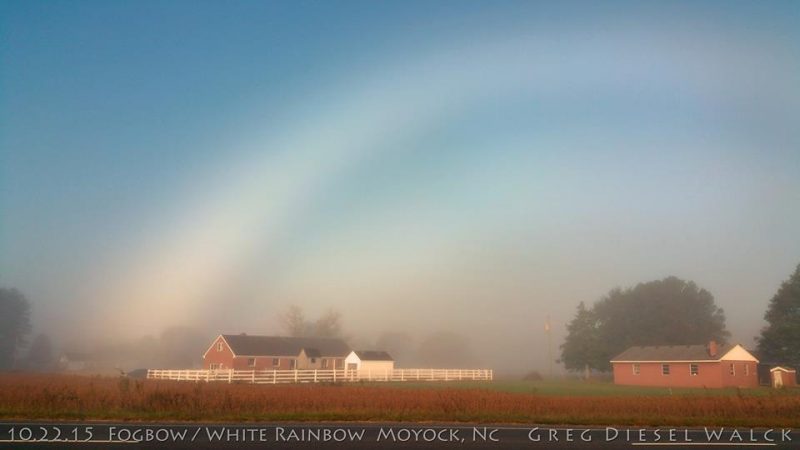
GregDiesel Landscape Photography wrote in October 2015: “Saw my first fogbow / white rainbow. Photo taken with cell phone. Moyock, North Carolina.”
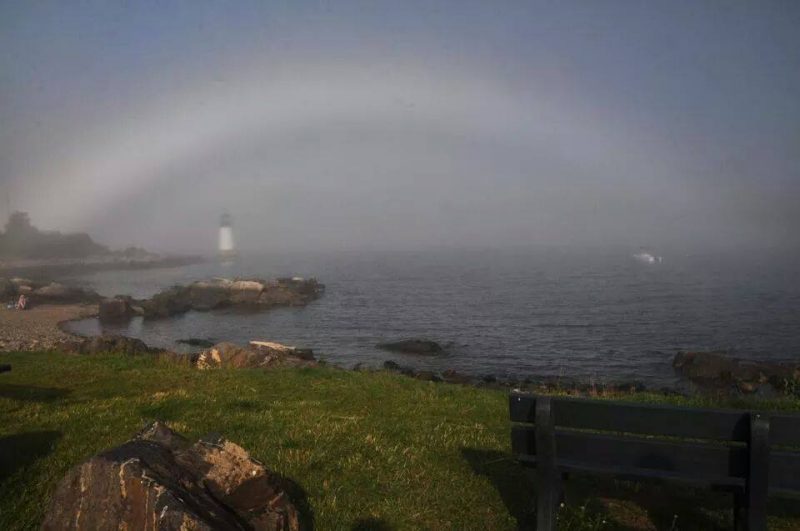
Katherine Keyes Millet captured this fogbow in July 2014 at Winter Island Park in Salem, Massachusetts.
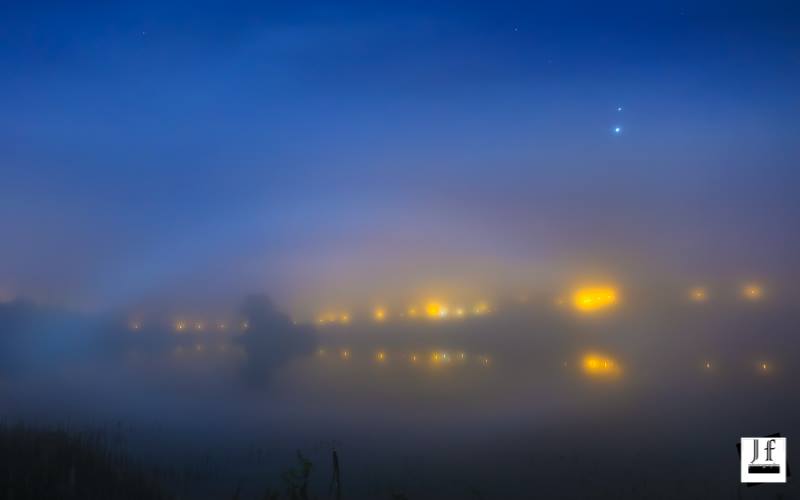
Venus and Jupiter above a fogbow in Blacklough, Dungannon, Ireland. Mars is up there, too, but tough to see. John Fagan captured them all in October 2015.
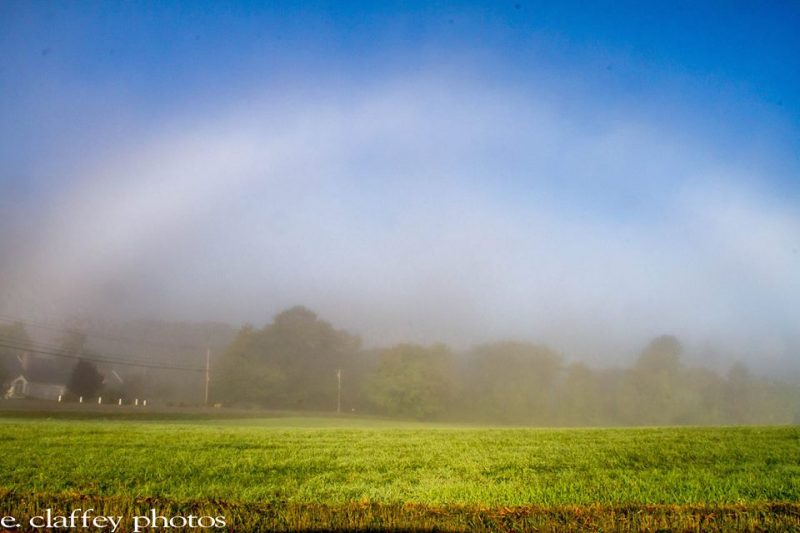
Eileen Claffey in Brookline, Massachusetts, captured this fogbow over a field in September 2014.
Les Cowley of the great website Atmospheric Optics says:
Look away from the sun and at an angle of 35-40 degrees from your shadow which marks the direction of the antisolar point. Some fogbows have very low contrast so look for small brightenings in the misty background. Once caught, they are unmistakable.
The sun must be less than 30-40 degrees high unless you are on a hill or high up on a ship where the mist and fogbow can be viewed from above.
Fogbows are huge, almost as large as a rainbow and much, much broader.
Look here for Les Cowley’s explanation of how fogbows form.
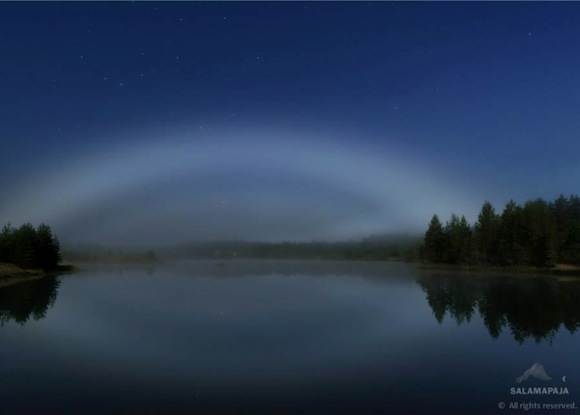
Thomas Kast in Finland captured this fogbow in 2013. He wrote: “In this rather cold August night (+8C [46F]) there was patchy fog, especially in open fields. This lake remained clear for a long time. At one point I saw this white bow with moon in waning gibbous phase behind me.”
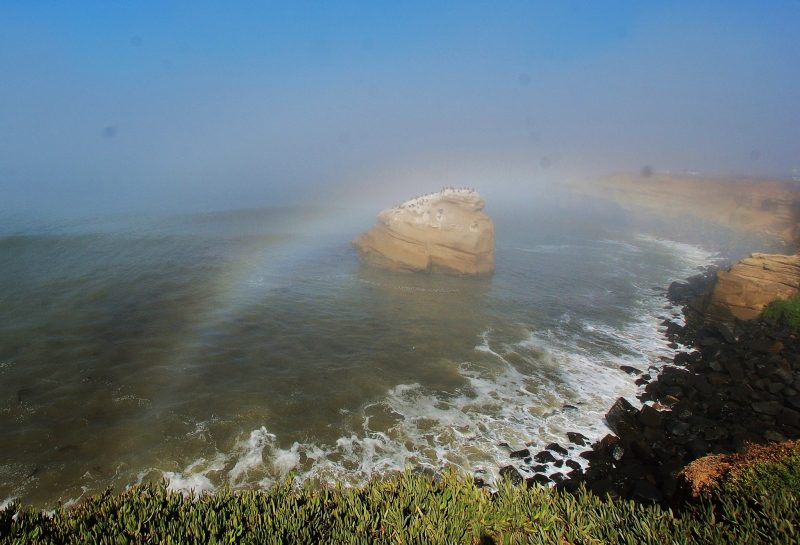
Jim Grant caught this fogbow over Sunset Cliffs in San Diego. He wrote: “The skies were sunny and clear, and then the fog rolled in, and with it this beautiful fogbow.”
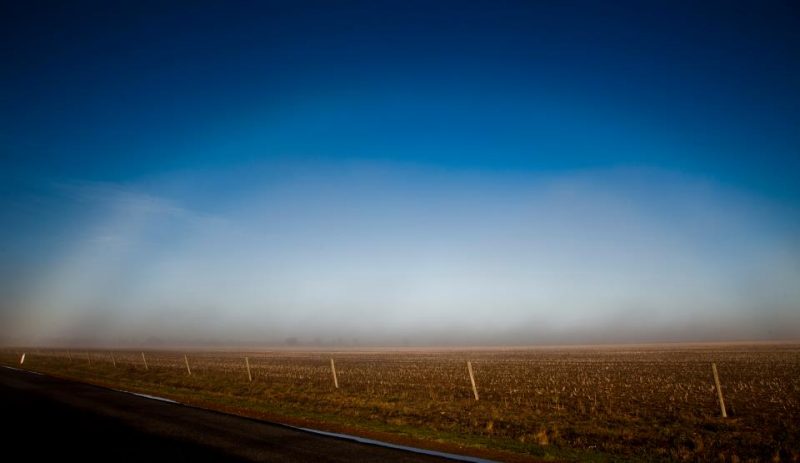
Lynton Brown of Australia captured this fogbow over a barren field in the autumn of 2012.
Bottom line: Fogbows are made by much the same process as rainbows, but with the small water droplets inside a fog instead of larger raindrops. Because the water droplets in fog are so small, fogbows have only weak colors or are colorless.
from EarthSky https://ift.tt/2RuWZ9W
View larger at EarthSky Community Photos. | Peter Lowenstein caught this fogbow in Mutare, Zimbabwe, on April 29, 2020. He wrote: “Half-an-hour after the Sun rose behind my house on Wednesday, a beautiful fogbow developed in the middle of a misty morning view from my front veranda. All the conditions were right – bright sunshine from the rear with the Sun less than twenty degrees above the horizon and clearing clouds of mist at the antisolar point. The scene was framed by a beautiful flowering Poinsettia to the left, a lush banana grove to the right, and clear blue sky beginning to appear on top!”
Fogbows – sometimes called white rainbows, cloudbows or ghost rainbows – are made much as rainbows are, from the same configuration of sunlight and moisture. Rainbows happen when the air is filled with raindrops, and you always see a rainbow in the direction opposite the sun. Fogbows are much the same, always opposite the sun, but fogbows are caused by the small droplets inside a fog or cloud rather than larger raindrops.
Look for fogbows in a thin fog when the sun is bright. You might see one when the sun breaks through a fog. Or watch for fogbows over the ocean.
Because the water droplets in fog are so small, fogbows have only weak colors or are colorless.
View at EarthSky Community Photos. | Alan Nicolle in New South Wales, Australia, captured this image on July 16, 2019. He wrote: “I was out geocaching in the outskirts of Broken Hill, when I turned back to see this fogbow developing. I took quite a few photos with the iPhone, and rode back to the car on my bike, but by the time I got back to the car to use my SLR, it had faded.” Thank you, Alan!
Edith Smith in Aberdeenshire, Scotland, captured this fogbow on November 1, 2018. She wrote: “The camera spotted it before I did with eye, as I was too engrossed in foggy conditions.”
Tommy Johnson captured this early morning fogbow near Jonesport, Maine, in August 2016. He wrote: “Early in the morning and blueberry rakers are starting to fill their buckets with the fruit. I called out to them to look at the fogbow, it was the first time any of us had seen one.”
Wonderful fogbow caught by Robyn Smith in New Zealand on the morning of September 19, 2017 “… opposite the foggy sunrise.”
GregDiesel Landscape Photography wrote in October 2015: “Saw my first fogbow / white rainbow. Photo taken with cell phone. Moyock, North Carolina.”
Katherine Keyes Millet captured this fogbow in July 2014 at Winter Island Park in Salem, Massachusetts.
Venus and Jupiter above a fogbow in Blacklough, Dungannon, Ireland. Mars is up there, too, but tough to see. John Fagan captured them all in October 2015.
Eileen Claffey in Brookline, Massachusetts, captured this fogbow over a field in September 2014.
Les Cowley of the great website Atmospheric Optics says:
Look away from the sun and at an angle of 35-40 degrees from your shadow which marks the direction of the antisolar point. Some fogbows have very low contrast so look for small brightenings in the misty background. Once caught, they are unmistakable.
The sun must be less than 30-40 degrees high unless you are on a hill or high up on a ship where the mist and fogbow can be viewed from above.
Fogbows are huge, almost as large as a rainbow and much, much broader.
Look here for Les Cowley’s explanation of how fogbows form.
Thomas Kast in Finland captured this fogbow in 2013. He wrote: “In this rather cold August night (+8C [46F]) there was patchy fog, especially in open fields. This lake remained clear for a long time. At one point I saw this white bow with moon in waning gibbous phase behind me.”
Jim Grant caught this fogbow over Sunset Cliffs in San Diego. He wrote: “The skies were sunny and clear, and then the fog rolled in, and with it this beautiful fogbow.”
Lynton Brown of Australia captured this fogbow over a barren field in the autumn of 2012.
Bottom line: Fogbows are made by much the same process as rainbows, but with the small water droplets inside a fog instead of larger raindrops. Because the water droplets in fog are so small, fogbows have only weak colors or are colorless.
from EarthSky https://ift.tt/2RuWZ9W