Click the name of a planet to learn more about its visibility in May 2020. Evening planets: Venus and Mercury. Morning planets: Jupiter, Saturn and Mars.
Try Stellarium for a precise view of the planets from your location.
Want precise planet rise and set times? Click here for recommended almanacs
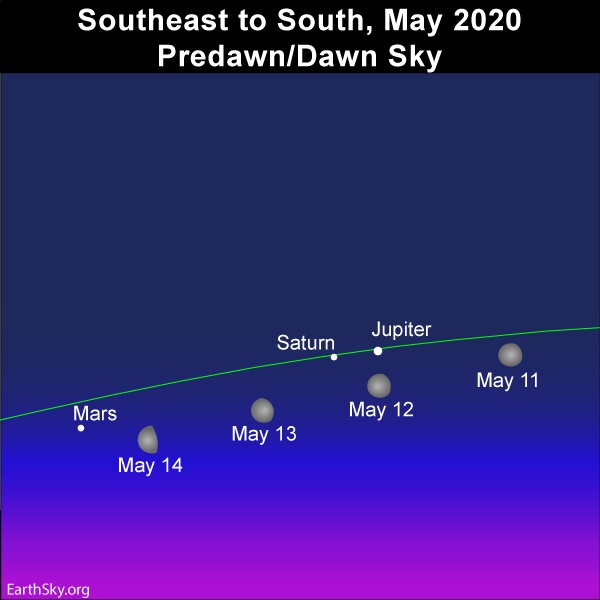
You can catch all 5 bright planets in May 2020. Use the waning moon to catch the morning planets – Jupiter, Saturn and Mars – from May 11 to 14, 2020. Read more.
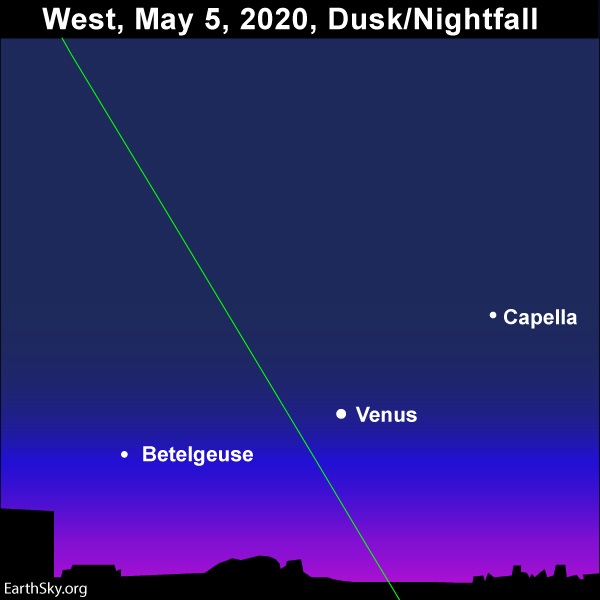
During the most of May 2020, the dazzling planet Venus appears between the bright stars Capella and Betelgeuse. Read more.
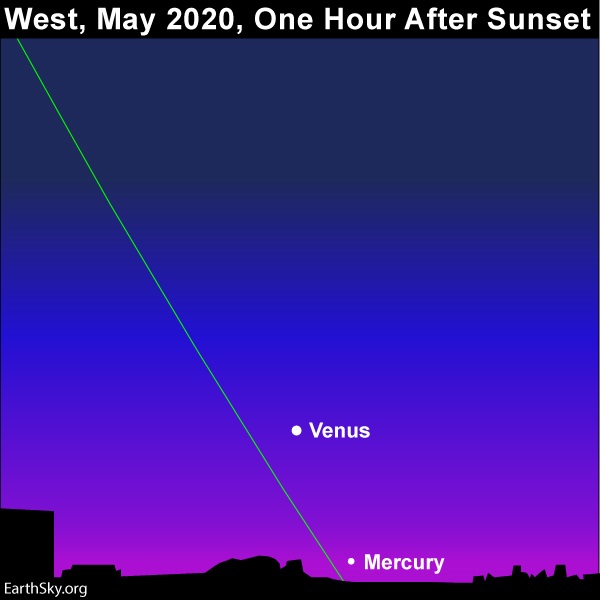
We expect Mercury, the innermost planet, to become visible by mid-May 2020, if not before. Conveniently, the dazzling planet Venus is there to help guide you to Mercury’s place near the horizon. Read more.
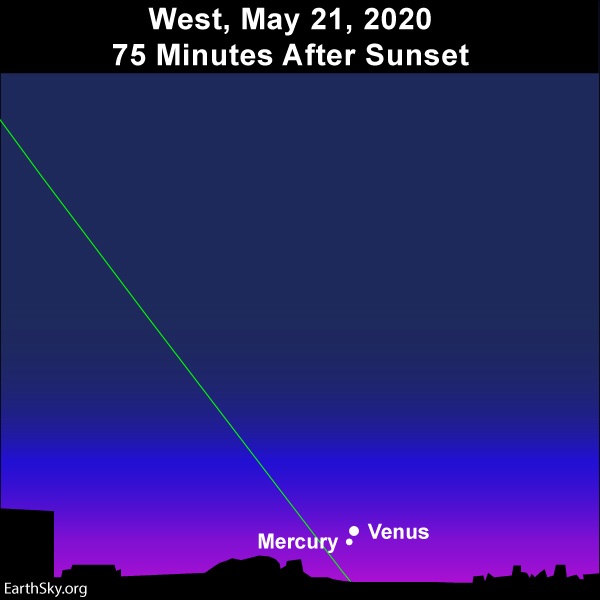
Depending on where you live worldwide, the planets Mercury and Venus will couple up most closely on the sky’s dome on May 21 or May 22, 2020. If you can see Venus, but not Mercury, aim binoculars at Venus to see Mercury and Venus taking stage in a single binocular field. Read more.
Venus – the brightest planet – blazes mightily in the western sky after sunset. Given clear skies, it’ll be hard to miss Venus, the third-brightest celestial body to light up the heavens, after the sun and moon, respectively. Some sharp-sighted people can even see Venus in a daytime sky.
May 2020 presents the last month for Venus’ reign in the evening sky. Day by day, Venus sinks closer to the glare of sunset, to swing behind the sun on June 3, 2020. After that, Venus transitions over to the morning sky. Look for Venus to reappear in the eastern dawn by around mid-June.
At mid-northern latitudes, Venus sets about 3 1/3 hours after the sun in early May, tapering to about 1/2 hour by the month’s end.
At and near the equator, Venus sets about 2 1/2 hours after the sun in early May, tapering to a bit over 1/3 hour near the month’s end.
At temperate latitudes in the Southern Hemisphere, Venus sets about 1 3/4 hours after the sun in early May, tapering to about 1/3 hour by the month’s end.
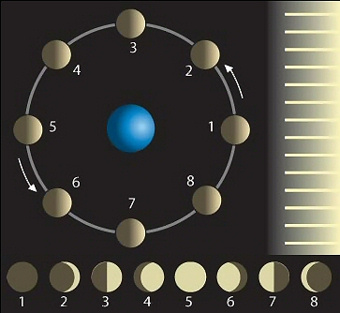
Around the world, Venus, in its faster orbit around the sun, comes closer to Earth day by day. Therefore, Venus’ thinning (yet elongating) phase becomes easier and easier to view through the telescope. Venus starts out the month about 25 percent illuminated in sunshine, and finishes the month about 0.5 percent illuminated. Venus’ angular diameter increases by 150% throughout the month, whereas its disk size more than doubles.
This month showcases Venus at its best in the evening sky as viewed through the telescope. Keep in mind, though, that you get a crisper view of Venus’ phase in a twilight or daytime sky than after dark. That’s because Venus’ glare is so overwhelming at nighttime. During the second half of the month, it might even be possible to view the crescent Venus through binoculars.
This month, as Venus sinks closer to the sunset day by day, Mercury will be climbing out of the sunset glare and in the direction of Venus. These two worlds will meet up for a conjunction on May 21, 2020. Once you see Venus, aim binoculars at Venus to spot nearby Mercury and Venus in the same binocular field together. As the evening twilight deepens, chances are that you’ll be able to spot Mercury next to Venus with the eye alone.
Read more: Mercury and Venus pair up at dusk May 21 and 22
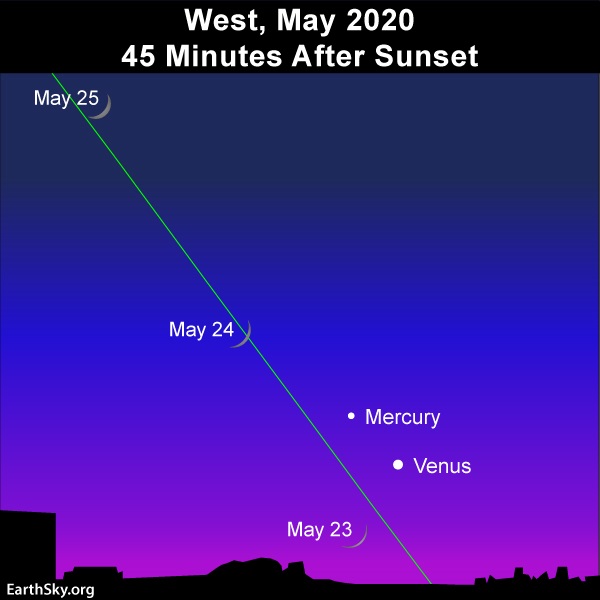
Look for the moon in the vicinity of Venus (and Mercury) for several days, starting on or near May 23, 2020.
Mercury enters the evening sky on May 4. However, this world probably won’t be far enough from the sun’s glare to be visible until a week or so later. Fortunately, Venus and Mercury will stage a conjunction on May 21, with Mercury passing one degree to the south of Venus. After their conjunction, Mercury will climb upward day by day while Venus will descend downward. As long as you can catch Venus after sunset, seek for Mercury above Venus with the eye alone or binoculars.
At mid-northern latitudes, Mercury sets about one hour after the sun at mid-month, increasing to nearby 2 hours by early June.
At or near the equator, Mercury sets a bit less than one hour after the sun at mid-month, increasing to 1 2/3 hours by early June.
At temperate latitudes in the Southern Hemisphere, Mercury sets about 1/2 hour after sunset at mid-month, increasing to about 1 1/2 hours by early June.
Look for the young waxing crescent moon to shine in the vicinity of Mercury (and Venus) on May 23 and 24.
Mars is the last of the three bright morning planets to rise in May 2020. Jupiter rises first, closely followed by Saturn, and then a few hours later by Mars. Whereas Jupiter and Saturn almost rise in tandem, Mars is off by itself.
At mid-northern latitudes, Mars rises about two hours after midnight in early May, and about an hour after midnight by the month’s end. By midnight, we mean midway between sunset and sunrise. At temperate latitudes in the Southern Hemisphere, Mars comes around the midnight hour throughout the month.
Let the waning crescent moon help guide your eye to Mars for several mornings, centered around May 15.
Mars was in conjunction with the sun – or almost behind the sun as seen from Earth – on September 2, 2019. It was far across the solar system from us at the time. But Earth is now moving toward the red planet, reducing the distance between us and Mars each month. Even so, it’ll be a number of months before we catch Mars, the swiftest-moving superior planet. And so it is, always, for Mars, which alternates years appearing bright in our sky, or faint. 2019 was a dull year, but 2020 will be an exciting one, for Mars!
The excitement will build slowly, though. In May 2020 … you’ll still find Mars respectably bright before dawn. We’ll be rushing along in our smaller, faster orbit, trying to catch up with Mars. As northern summer 2020 approaches, Mars will begin to change. It’ll brighten more dramatically as, finally, Earth begins to close in on Mars. The red planet will appear brightest in our sky and fiery red – around the time of its opposition – when Earth passes between Mars and the sun on October 13, 2020.
View at EarthSky Community Photos. | From Paul Armstrong, who took this photo of Mars, Saturn and Jupiter on the morning of April 15, 2020, from Exmoor, UK. Jupiter is at the upper right, Mars at center left, with Saturn in between. In May 2020, Jupiter and Saturn will be closer together, whereas Mars will be farther away from Jupiter and Saturn. Thanks, Paul!
Jupiter and Saturn are closely joined at the hip on the sky’s dome, remaining rather close together in the morning sky all month long. Look first for brilliant Jupiter and you’ll find Saturn a short hop to the east of Jupiter. Remember, east is in the direction of sunrise. Although Saturn is easily as bright as a 1st-magnitude star, the ringed planet pales next the the king planet Jupiter, which outshines Saturn by some 15 times.
At mid-northern latitudes, Jupiter and nearby Saturn rise about one hour after midnight in early May, and, by the month’s end, rise about one hour before midnight. By midnight, we mean midway between sunset and sunrise. At temperate latitudes in the Southern Hemisphere, Jupiter and Saturn rise at late evening in early May, and around mid-evening by the month’s end.
Mars, which is roughly the same brightness as Saturn, more or less aligns with Jupiter and Saturn in the predawn/dawn sky. However, standoffish Mars is long jump to the east of Jupiter and Saturn, with Saturn shining in between Jupiter and Mars.
Watch for the moon in the vicinity of Jupiter and Saturn for several days, centered on or near May 12 and 13.
What do we mean by bright planet? By bright planet, we mean any solar system planet that is easily visible without an optical aid and that has been watched by our ancestors since time immemorial. In their outward order from the sun, the five bright planets are Mercury, Venus, Mars, Jupiter and Saturn. These planets actually do appear bright in our sky. They are typically as bright as – or brighter than – the brightest stars. Plus, these relatively nearby worlds tend to shine with a steadier light than the distant, twinkling stars. You can spot them, and come to know them as faithful friends, if you try.

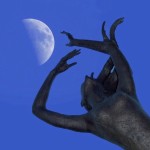
Skywatcher, by Predrag Agatonovic.
Bottom line: May 2020 presents all 5 bright solar system planets. Dazzling Venus is your ticket to finding Mercury in the evening sky, whereas brilliant Jupiter acts as your tour guide to Saturn and Mars in the morning sky. Quite by coincidence, the inferior planets – Mercury and Venus – reign in the evening sky while the superior planets – Mars, Jupiter and Saturn – predominate over the morning sky.
Don’t miss anything. Subscribe to EarthSky News by email
Visit EarthSky’s Best Places to Stargaze, and recommend a place we can all enjoy.
Help EarthSky keep going! Donate now.
Post your planet photos at EarthSky Community Photos
from EarthSky https://ift.tt/1YD00CF
Click the name of a planet to learn more about its visibility in May 2020. Evening planets: Venus and Mercury. Morning planets: Jupiter, Saturn and Mars.
Try Stellarium for a precise view of the planets from your location.
Want precise planet rise and set times? Click here for recommended almanacs
You can catch all 5 bright planets in May 2020. Use the waning moon to catch the morning planets – Jupiter, Saturn and Mars – from May 11 to 14, 2020. Read more.
During the most of May 2020, the dazzling planet Venus appears between the bright stars Capella and Betelgeuse. Read more.
We expect Mercury, the innermost planet, to become visible by mid-May 2020, if not before. Conveniently, the dazzling planet Venus is there to help guide you to Mercury’s place near the horizon. Read more.
Depending on where you live worldwide, the planets Mercury and Venus will couple up most closely on the sky’s dome on May 21 or May 22, 2020. If you can see Venus, but not Mercury, aim binoculars at Venus to see Mercury and Venus taking stage in a single binocular field. Read more.
Venus – the brightest planet – blazes mightily in the western sky after sunset. Given clear skies, it’ll be hard to miss Venus, the third-brightest celestial body to light up the heavens, after the sun and moon, respectively. Some sharp-sighted people can even see Venus in a daytime sky.
May 2020 presents the last month for Venus’ reign in the evening sky. Day by day, Venus sinks closer to the glare of sunset, to swing behind the sun on June 3, 2020. After that, Venus transitions over to the morning sky. Look for Venus to reappear in the eastern dawn by around mid-June.
At mid-northern latitudes, Venus sets about 3 1/3 hours after the sun in early May, tapering to about 1/2 hour by the month’s end.
At and near the equator, Venus sets about 2 1/2 hours after the sun in early May, tapering to a bit over 1/3 hour near the month’s end.
At temperate latitudes in the Southern Hemisphere, Venus sets about 1 3/4 hours after the sun in early May, tapering to about 1/3 hour by the month’s end.
Around the world, Venus, in its faster orbit around the sun, comes closer to Earth day by day. Therefore, Venus’ thinning (yet elongating) phase becomes easier and easier to view through the telescope. Venus starts out the month about 25 percent illuminated in sunshine, and finishes the month about 0.5 percent illuminated. Venus’ angular diameter increases by 150% throughout the month, whereas its disk size more than doubles.
This month showcases Venus at its best in the evening sky as viewed through the telescope. Keep in mind, though, that you get a crisper view of Venus’ phase in a twilight or daytime sky than after dark. That’s because Venus’ glare is so overwhelming at nighttime. During the second half of the month, it might even be possible to view the crescent Venus through binoculars.
This month, as Venus sinks closer to the sunset day by day, Mercury will be climbing out of the sunset glare and in the direction of Venus. These two worlds will meet up for a conjunction on May 21, 2020. Once you see Venus, aim binoculars at Venus to spot nearby Mercury and Venus in the same binocular field together. As the evening twilight deepens, chances are that you’ll be able to spot Mercury next to Venus with the eye alone.
Read more: Mercury and Venus pair up at dusk May 21 and 22
Look for the moon in the vicinity of Venus (and Mercury) for several days, starting on or near May 23, 2020.
Mercury enters the evening sky on May 4. However, this world probably won’t be far enough from the sun’s glare to be visible until a week or so later. Fortunately, Venus and Mercury will stage a conjunction on May 21, with Mercury passing one degree to the south of Venus. After their conjunction, Mercury will climb upward day by day while Venus will descend downward. As long as you can catch Venus after sunset, seek for Mercury above Venus with the eye alone or binoculars.
At mid-northern latitudes, Mercury sets about one hour after the sun at mid-month, increasing to nearby 2 hours by early June.
At or near the equator, Mercury sets a bit less than one hour after the sun at mid-month, increasing to 1 2/3 hours by early June.
At temperate latitudes in the Southern Hemisphere, Mercury sets about 1/2 hour after sunset at mid-month, increasing to about 1 1/2 hours by early June.
Look for the young waxing crescent moon to shine in the vicinity of Mercury (and Venus) on May 23 and 24.
Mars is the last of the three bright morning planets to rise in May 2020. Jupiter rises first, closely followed by Saturn, and then a few hours later by Mars. Whereas Jupiter and Saturn almost rise in tandem, Mars is off by itself.
At mid-northern latitudes, Mars rises about two hours after midnight in early May, and about an hour after midnight by the month’s end. By midnight, we mean midway between sunset and sunrise. At temperate latitudes in the Southern Hemisphere, Mars comes around the midnight hour throughout the month.
Let the waning crescent moon help guide your eye to Mars for several mornings, centered around May 15.
Mars was in conjunction with the sun – or almost behind the sun as seen from Earth – on September 2, 2019. It was far across the solar system from us at the time. But Earth is now moving toward the red planet, reducing the distance between us and Mars each month. Even so, it’ll be a number of months before we catch Mars, the swiftest-moving superior planet. And so it is, always, for Mars, which alternates years appearing bright in our sky, or faint. 2019 was a dull year, but 2020 will be an exciting one, for Mars!
The excitement will build slowly, though. In May 2020 … you’ll still find Mars respectably bright before dawn. We’ll be rushing along in our smaller, faster orbit, trying to catch up with Mars. As northern summer 2020 approaches, Mars will begin to change. It’ll brighten more dramatically as, finally, Earth begins to close in on Mars. The red planet will appear brightest in our sky and fiery red – around the time of its opposition – when Earth passes between Mars and the sun on October 13, 2020.
View at EarthSky Community Photos. | From Paul Armstrong, who took this photo of Mars, Saturn and Jupiter on the morning of April 15, 2020, from Exmoor, UK. Jupiter is at the upper right, Mars at center left, with Saturn in between. In May 2020, Jupiter and Saturn will be closer together, whereas Mars will be farther away from Jupiter and Saturn. Thanks, Paul!
Jupiter and Saturn are closely joined at the hip on the sky’s dome, remaining rather close together in the morning sky all month long. Look first for brilliant Jupiter and you’ll find Saturn a short hop to the east of Jupiter. Remember, east is in the direction of sunrise. Although Saturn is easily as bright as a 1st-magnitude star, the ringed planet pales next the the king planet Jupiter, which outshines Saturn by some 15 times.
At mid-northern latitudes, Jupiter and nearby Saturn rise about one hour after midnight in early May, and, by the month’s end, rise about one hour before midnight. By midnight, we mean midway between sunset and sunrise. At temperate latitudes in the Southern Hemisphere, Jupiter and Saturn rise at late evening in early May, and around mid-evening by the month’s end.
Mars, which is roughly the same brightness as Saturn, more or less aligns with Jupiter and Saturn in the predawn/dawn sky. However, standoffish Mars is long jump to the east of Jupiter and Saturn, with Saturn shining in between Jupiter and Mars.
Watch for the moon in the vicinity of Jupiter and Saturn for several days, centered on or near May 12 and 13.
What do we mean by bright planet? By bright planet, we mean any solar system planet that is easily visible without an optical aid and that has been watched by our ancestors since time immemorial. In their outward order from the sun, the five bright planets are Mercury, Venus, Mars, Jupiter and Saturn. These planets actually do appear bright in our sky. They are typically as bright as – or brighter than – the brightest stars. Plus, these relatively nearby worlds tend to shine with a steadier light than the distant, twinkling stars. You can spot them, and come to know them as faithful friends, if you try.
Skywatcher, by Predrag Agatonovic.
Bottom line: May 2020 presents all 5 bright solar system planets. Dazzling Venus is your ticket to finding Mercury in the evening sky, whereas brilliant Jupiter acts as your tour guide to Saturn and Mars in the morning sky. Quite by coincidence, the inferior planets – Mercury and Venus – reign in the evening sky while the superior planets – Mars, Jupiter and Saturn – predominate over the morning sky.
Don’t miss anything. Subscribe to EarthSky News by email
Visit EarthSky’s Best Places to Stargaze, and recommend a place we can all enjoy.
Help EarthSky keep going! Donate now.
Post your planet photos at EarthSky Community Photos
from EarthSky https://ift.tt/1YD00CF