View at EarthSky Community Photos. | Amrinderjit Singh in Vaatalya, Himachal Pradesh, India, captured this pileus cloud on April 18, 2026. A pileus cloud is a curved cap on top of a towering cumulus cloud. Amrinderjit wrote: “Pileus clouds are formed by strong updrafts (small-scale currents of rising air) within the cloud at lower altitudes. They are short-lived clouds and indicate severe weather ahead.” Thank you, Amrinderjit!
A pileus cloud is a sign of bad weather
Have you ever seen a bubbling, towering cloud wearing a curved white cap on its head? These cap clouds – or pileus clouds – are a sign of bad weather. They form above vigorously growing cumulus or cumulonimbus clouds. If you see one, be prepared for storms.
Cumulus clouds are serene, fluffy clouds. When most people are asked to draw a cloud, a cumulus cloud is the kind they will sketch. Cumulus clouds can start as fair-weather clouds, but if conditions are right they can become cumulonimbus clouds, or thunderheads. In a moist, unstable atmosphere, updrafts can cause cumulus clouds to grow, blossoming into the giant cauliflower shapes of cumulonimbus. Their bases grow dark as they grow thicker, because sunlight cannot penetrate them.
As these towering clouds push higher and higher into the atmosphere, they can bump into a stable layer of humid air. As the cloud continues to billow upward, it lifts that humid air above its dew point. The dew point is the temperature the air must cool to in order to become saturated with water vapor. At this point, the air cannot hold more moisture, so it condenses into clouds, resulting in the curved cloud cap on top of the thunderhead.
If you see one, snap a pic, because they won’t last long! The rising air continues its upward motion, mixing the air and merging the cap with the growing cloud.
More pics of pileus clouds
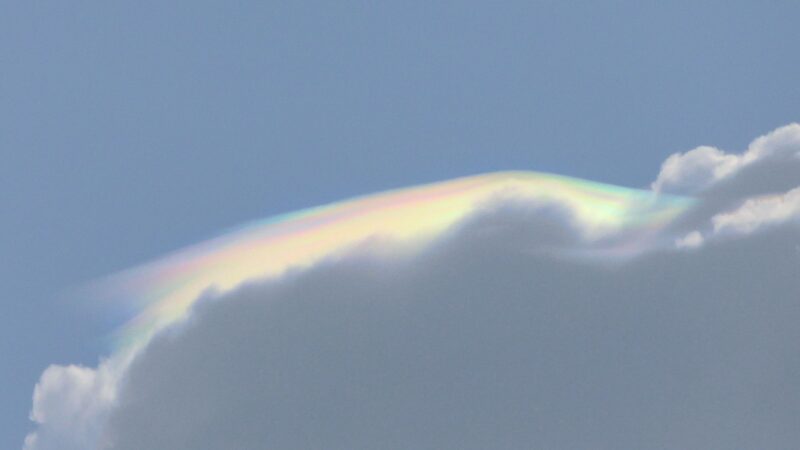
View at EarthSky Community Photos. | Helio C. Vital in Saquarem, Rio de Janeiro, Brazil, captured this unusually thick pileus cloud on February 13, 2024. Helio wrote: “The pileus cloud formed as air quickly rose inside a cumulus cloud and condensed at its top, yielding a smooth umbrella shape. It lasted for some 5 minutes and then suddenly collapsed, swallowed by the mother cloud.” Thank you, Helio!View at EarthSky Community Photos. | Peter Lowenstein in Mutare, Zimbabwe, captured this iridescent pileus cloud on January 8, 2020. Peter wrote: “Uprising moisture condensed on top of some cumulus clouds to form tiny ice crystals, which refracted sunlight to produce characteristic shining pileus caps. These only persisted for a few minutes, with early ones remaining colorless and later ones developing rainbow colors as the sun descended in the sky.” Thank you, Peter!
Bottom line: A pileus cloud looks like a curved, white cap on the top of a towering cumulus cloud. Pileus clouds are a sign that bad weather is on the way.
View at EarthSky Community Photos. | Amrinderjit Singh in Vaatalya, Himachal Pradesh, India, captured this pileus cloud on April 18, 2026. A pileus cloud is a curved cap on top of a towering cumulus cloud. Amrinderjit wrote: “Pileus clouds are formed by strong updrafts (small-scale currents of rising air) within the cloud at lower altitudes. They are short-lived clouds and indicate severe weather ahead.” Thank you, Amrinderjit!
A pileus cloud is a sign of bad weather
Have you ever seen a bubbling, towering cloud wearing a curved white cap on its head? These cap clouds – or pileus clouds – are a sign of bad weather. They form above vigorously growing cumulus or cumulonimbus clouds. If you see one, be prepared for storms.
Cumulus clouds are serene, fluffy clouds. When most people are asked to draw a cloud, a cumulus cloud is the kind they will sketch. Cumulus clouds can start as fair-weather clouds, but if conditions are right they can become cumulonimbus clouds, or thunderheads. In a moist, unstable atmosphere, updrafts can cause cumulus clouds to grow, blossoming into the giant cauliflower shapes of cumulonimbus. Their bases grow dark as they grow thicker, because sunlight cannot penetrate them.
As these towering clouds push higher and higher into the atmosphere, they can bump into a stable layer of humid air. As the cloud continues to billow upward, it lifts that humid air above its dew point. The dew point is the temperature the air must cool to in order to become saturated with water vapor. At this point, the air cannot hold more moisture, so it condenses into clouds, resulting in the curved cloud cap on top of the thunderhead.
If you see one, snap a pic, because they won’t last long! The rising air continues its upward motion, mixing the air and merging the cap with the growing cloud.
More pics of pileus clouds
View at EarthSky Community Photos. | Helio C. Vital in Saquarem, Rio de Janeiro, Brazil, captured this unusually thick pileus cloud on February 13, 2024. Helio wrote: “The pileus cloud formed as air quickly rose inside a cumulus cloud and condensed at its top, yielding a smooth umbrella shape. It lasted for some 5 minutes and then suddenly collapsed, swallowed by the mother cloud.” Thank you, Helio!View at EarthSky Community Photos. | Peter Lowenstein in Mutare, Zimbabwe, captured this iridescent pileus cloud on January 8, 2020. Peter wrote: “Uprising moisture condensed on top of some cumulus clouds to form tiny ice crystals, which refracted sunlight to produce characteristic shining pileus caps. These only persisted for a few minutes, with early ones remaining colorless and later ones developing rainbow colors as the sun descended in the sky.” Thank you, Peter!
Bottom line: A pileus cloud looks like a curved, white cap on the top of a towering cumulus cloud. Pileus clouds are a sign that bad weather is on the way.
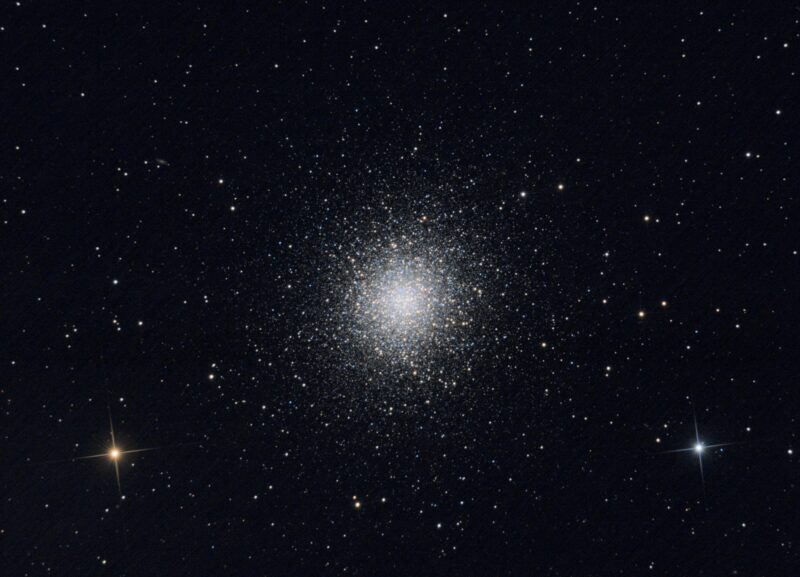
View at EarthSky Community Photos. | Gwen Forrester in DeKalb County, Tennessee, captured this telescopic view of Messier 13 (M13), the Great Hercules Cluster, on May 23, 2025. Thank you, Gwen!
The Great Cluster in the constellation Hercules – also known as Messier 13, or M13 – is the finest globular cluster in the northern half of the heavens. More specifically, you can find it in a star pattern called the Keystone, a lopsided square within the constellation Hercules. This constellation is located between the two brightest stars of northern spring and summer, Vega and Arcturus.
Under constant observation
From mid-northern latitudes, the M13 cluster is in the sky for at least part of the night all year round. As you read this, someone, somewhere, is observing M13. It’s rising a few hours after sunset in April. Then, it’s above the horizon all night long in May, June and July. In August, September and October, the Hercules Cluster is still very much a night owl, staying up till after midnight. Then, in November and December, you can see it in your western evening sky and in your eastern morning sky. It is in the morning sky from January through April.
Moreover, when you gaze at M13 or other globular star clusters, you are looking at stars that are some 12 to 13 billion years old. That’s almost as old as the universe.
M13 is easy to find
The constellation Hercules is where you’ll find M13. Hercules is between summertime’s two brightest stars, Vega in Lyra the Harp and Arcturus in Boötes the Herdsman.
About 1/3 of the way from Vega to Arcturus, locate the four modestly bright stars forming the squarish Keystone of Hercules. On the Arcturus side of the Keystone, M13 lies between the stars Eta Herculis and Zeta Herculis.
A typical binocular field is about 5 to 7 degrees in diameter, and the Hercules cluster is found about 2.5 degrees south of Eta Herculis.
The Hercules cluster’s position is Right Ascension: 16h 41.7m; Declination: 36 degrees 28′ north.
The bright star Vega in the constellation Lyra the Harp and the orange star Arcturus in the constellation Boötes the Herdsman are located on either side of the constellation Hercules. Then look for the squarish pattern within Hercules. This pattern is called the Keystone. M13 is located along one of the borders of the Keystone.
What to expect from M13
On a dark, clear night, the unaided eye barely perceives the Hercules cluster as a faint and fuzzy point of light. Indeed, this fuzzy “star” is much easier to make out in binoculars. The cluster shines at magnitude 5.8 and is about 20 arcminutes in size, about 2/3 the diameter of the full moon.
The best way to see M13 – or any globular cluster – is through telescopes with large apertures (light-gathering capability). Smaller telescopes will show this globular cluster, but they will not resolve the cluster into individual stars. However, if you don’t have a telescope, or are unfamiliar with how to use one, try attending a public star party. That way you can view M13 through an assortment of telescopes.
Sky chart of the constellation Hercules, showing the whereabouts of Messier 13, the Hercules cluster. Image via IAU/ Sky and Telescope/ Wikimedia Commons (CC BY 3.0).
What’s that propeller doing in this cluster?
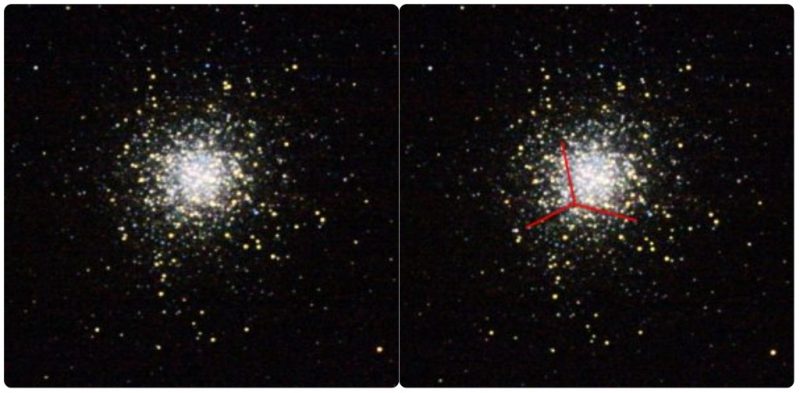
Now that we have M13 in our telescope, let’s look for an oddity unique to this globular cluster. Look for what appears to be three dark lanes that form the shape of an airplane propeller. Bindon Blood Stoney, assistant to the Earl of Rosse in the 1850s, was the first to notice this odd feature. It is a pattern caused by the lack of stars along this particular line of sight.
M13 and the propeller. Here, north is up, east is to the left. Image via Phil Harrington, from his book: Cosmic Challenge. Used with permission.
Walter Scott Houston, who wrote a monthly column called “Deep-Sky Wonders” for Sky and Telescope magazine, mentioned M13’s propeller in 1953. From time to time he would mention it again; still, none of his readers reported ever seeing it. Finally, in 1980, American amateur astronomer John Bortle wrote that he saw it, and it is located on the southeast corner of the cluster. Aperture and magnification help in seeing it, because a large telescope and at least 200 magnification is necessary to bring it out from the background. Most photographs overexpose the area, and therefore the propeller disappears.
Counting stars
M13 is very far away, 25,000 light-years. This is several times farther away than the farthest stars you can see with the unaided eye. And the cluster is large, about 165 light-years across.
Overall, how many stars does M13 have? About 300,000, and perhaps as many as a half million. In fact, that is about 100 times more than the number of stars you can see with your eyes alone in our sky at night.
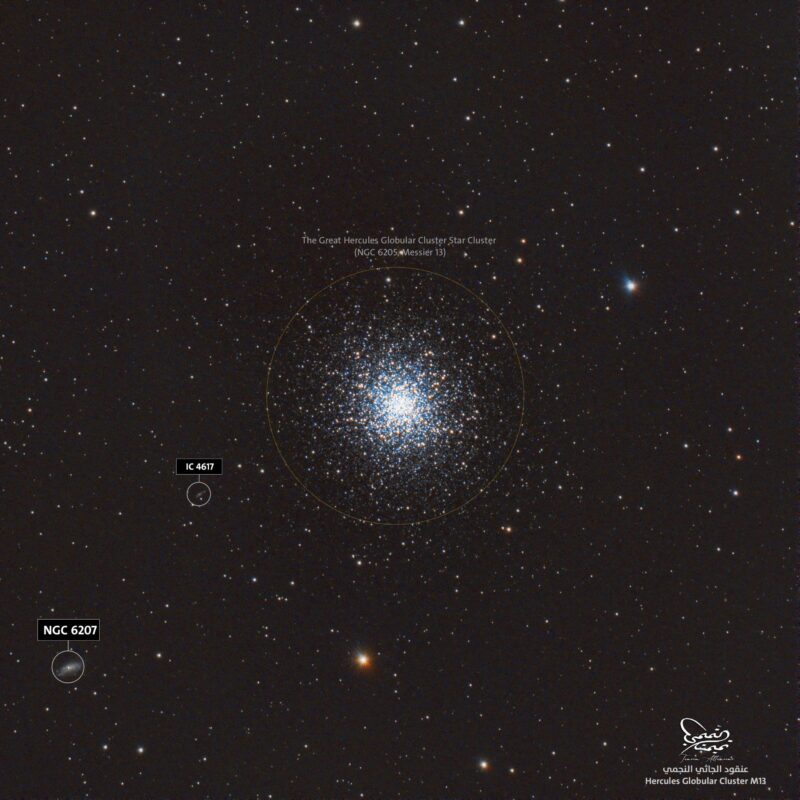
View at EarthSky Community Photos. | Tameem Altameemi in the United Arab Emirates shared this image on April 26, 2025, and wrote: “This image features the beautiful globular cluster Messier 13. In the same field of view, the spiral galaxy NGC 6207 and the faint active galaxy IC 4617 are visible.” Thank you, Tameem!
Talking to a globular cluster
On November 16, 1974, the Arecibo radio telescope in Puerto Rico sent a radio message to M13. This was the first message deliberately sent toward a target in outer space. Designed by a team led by Frank Drake, the message communicated information about our world. Read more about the message here. It will take 25,000 years for the message to reach the cluster. Correspondingly, any response will take another 25,000 years to reach us.
M13 is a globular star cluster, a huge globe-shaped stellar city teeming with hundreds of thousands of stars. Globular clusters orbit the Milky Way Galaxy outside the galactic disk at tens of thousands of light-years away. In contrast, the relatively nearby Pleiades and Hyades are open star clusters that reside within the galactic disk. In general, they usually harbor a few hundred to a thousand stars.
The discovery of M13
Englishman Edmond Halley discovered this cluster in 1714 “by help of the telescope.” He stated:
This is but a little patch, but it shows itself to the [unaided] eye when the sky is serene and the moon absent.
On June 1, 1764, the famous French comet hunter Charles Messier (1730-1817) listed this object as number 13 in his catalog of nebulous objects. He described it as:
… A nebula which I am sure contains no star. Round and brilliant, center brighter than the edges.
Messier’s telescope, however, was not powerful enough to show the individual stars.
In the centuries since then, M13 has become the most observed globular cluster in the Northern Hemisphere.
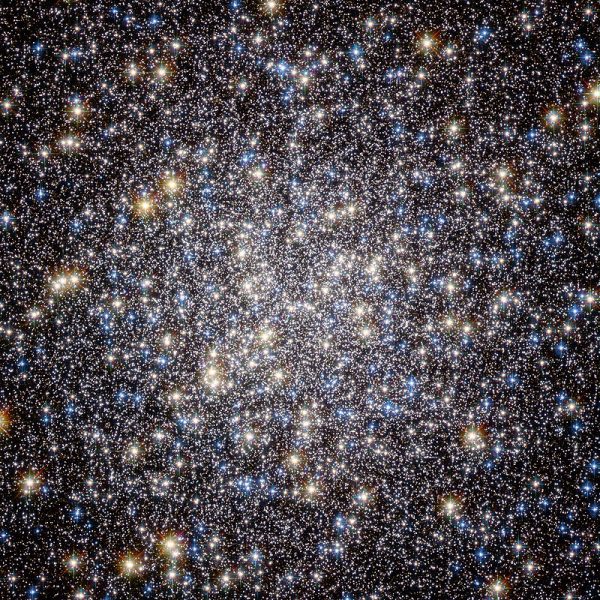
View larger. | The heart of M13, aka the Great Cluster in Hercules, a globular star cluster and one of our Milky Way Galaxy’s oldest inhabitants. Image via the Advanced Camera for Surveys on the Hubble Space Telescope.
Bottom line: Meet M13, the Great Cluster, in Hercules. Peering at this globular cluster is a wonderful way to start your spring or summer evening.
View at EarthSky Community Photos. | Gwen Forrester in DeKalb County, Tennessee, captured this telescopic view of Messier 13 (M13), the Great Hercules Cluster, on May 23, 2025. Thank you, Gwen!
The Great Cluster in the constellation Hercules – also known as Messier 13, or M13 – is the finest globular cluster in the northern half of the heavens. More specifically, you can find it in a star pattern called the Keystone, a lopsided square within the constellation Hercules. This constellation is located between the two brightest stars of northern spring and summer, Vega and Arcturus.
Under constant observation
From mid-northern latitudes, the M13 cluster is in the sky for at least part of the night all year round. As you read this, someone, somewhere, is observing M13. It’s rising a few hours after sunset in April. Then, it’s above the horizon all night long in May, June and July. In August, September and October, the Hercules Cluster is still very much a night owl, staying up till after midnight. Then, in November and December, you can see it in your western evening sky and in your eastern morning sky. It is in the morning sky from January through April.
Moreover, when you gaze at M13 or other globular star clusters, you are looking at stars that are some 12 to 13 billion years old. That’s almost as old as the universe.
M13 is easy to find
The constellation Hercules is where you’ll find M13. Hercules is between summertime’s two brightest stars, Vega in Lyra the Harp and Arcturus in Boötes the Herdsman.
About 1/3 of the way from Vega to Arcturus, locate the four modestly bright stars forming the squarish Keystone of Hercules. On the Arcturus side of the Keystone, M13 lies between the stars Eta Herculis and Zeta Herculis.
A typical binocular field is about 5 to 7 degrees in diameter, and the Hercules cluster is found about 2.5 degrees south of Eta Herculis.
The Hercules cluster’s position is Right Ascension: 16h 41.7m; Declination: 36 degrees 28′ north.
The bright star Vega in the constellation Lyra the Harp and the orange star Arcturus in the constellation Boötes the Herdsman are located on either side of the constellation Hercules. Then look for the squarish pattern within Hercules. This pattern is called the Keystone. M13 is located along one of the borders of the Keystone.
What to expect from M13
On a dark, clear night, the unaided eye barely perceives the Hercules cluster as a faint and fuzzy point of light. Indeed, this fuzzy “star” is much easier to make out in binoculars. The cluster shines at magnitude 5.8 and is about 20 arcminutes in size, about 2/3 the diameter of the full moon.
The best way to see M13 – or any globular cluster – is through telescopes with large apertures (light-gathering capability). Smaller telescopes will show this globular cluster, but they will not resolve the cluster into individual stars. However, if you don’t have a telescope, or are unfamiliar with how to use one, try attending a public star party. That way you can view M13 through an assortment of telescopes.
Sky chart of the constellation Hercules, showing the whereabouts of Messier 13, the Hercules cluster. Image via IAU/ Sky and Telescope/ Wikimedia Commons (CC BY 3.0).
What’s that propeller doing in this cluster?
Now that we have M13 in our telescope, let’s look for an oddity unique to this globular cluster. Look for what appears to be three dark lanes that form the shape of an airplane propeller. Bindon Blood Stoney, assistant to the Earl of Rosse in the 1850s, was the first to notice this odd feature. It is a pattern caused by the lack of stars along this particular line of sight.
M13 and the propeller. Here, north is up, east is to the left. Image via Phil Harrington, from his book: Cosmic Challenge. Used with permission.
Walter Scott Houston, who wrote a monthly column called “Deep-Sky Wonders” for Sky and Telescope magazine, mentioned M13’s propeller in 1953. From time to time he would mention it again; still, none of his readers reported ever seeing it. Finally, in 1980, American amateur astronomer John Bortle wrote that he saw it, and it is located on the southeast corner of the cluster. Aperture and magnification help in seeing it, because a large telescope and at least 200 magnification is necessary to bring it out from the background. Most photographs overexpose the area, and therefore the propeller disappears.
Counting stars
M13 is very far away, 25,000 light-years. This is several times farther away than the farthest stars you can see with the unaided eye. And the cluster is large, about 165 light-years across.
Overall, how many stars does M13 have? About 300,000, and perhaps as many as a half million. In fact, that is about 100 times more than the number of stars you can see with your eyes alone in our sky at night.
View at EarthSky Community Photos. | Tameem Altameemi in the United Arab Emirates shared this image on April 26, 2025, and wrote: “This image features the beautiful globular cluster Messier 13. In the same field of view, the spiral galaxy NGC 6207 and the faint active galaxy IC 4617 are visible.” Thank you, Tameem!
Talking to a globular cluster
On November 16, 1974, the Arecibo radio telescope in Puerto Rico sent a radio message to M13. This was the first message deliberately sent toward a target in outer space. Designed by a team led by Frank Drake, the message communicated information about our world. Read more about the message here. It will take 25,000 years for the message to reach the cluster. Correspondingly, any response will take another 25,000 years to reach us.
M13 is a globular star cluster, a huge globe-shaped stellar city teeming with hundreds of thousands of stars. Globular clusters orbit the Milky Way Galaxy outside the galactic disk at tens of thousands of light-years away. In contrast, the relatively nearby Pleiades and Hyades are open star clusters that reside within the galactic disk. In general, they usually harbor a few hundred to a thousand stars.
The discovery of M13
Englishman Edmond Halley discovered this cluster in 1714 “by help of the telescope.” He stated:
This is but a little patch, but it shows itself to the [unaided] eye when the sky is serene and the moon absent.
On June 1, 1764, the famous French comet hunter Charles Messier (1730-1817) listed this object as number 13 in his catalog of nebulous objects. He described it as:
… A nebula which I am sure contains no star. Round and brilliant, center brighter than the edges.
Messier’s telescope, however, was not powerful enough to show the individual stars.
In the centuries since then, M13 has become the most observed globular cluster in the Northern Hemisphere.
View larger. | The heart of M13, aka the Great Cluster in Hercules, a globular star cluster and one of our Milky Way Galaxy’s oldest inhabitants. Image via the Advanced Camera for Surveys on the Hubble Space Telescope.
Bottom line: Meet M13, the Great Cluster, in Hercules. Peering at this globular cluster is a wonderful way to start your spring or summer evening.
Small cone ants clean a much larger harvester ant. Scientists said this behavior marks the first known case of interspecies ant grooming. Image via Mark Moffett/ Minden Pictures (used with permission).
Small ants clean larger ants
Scientists have discovered a unique interaction between two ant species: smaller ants cleaning much larger ones. It’s the first known case of this behavior in insects, said entomologist Mark Moffett of the Smithsonian National Museum of Natural History on April 13, 2026.
Moffett observed and documented this phenomenon while studying ant behavior in the Chiricahua Mountains of southeastern Arizona. During his research, he noticed that harvester ants actively seek out cone ants and allow them to groom their bodies.
Moffet published his discovery on April 12, 2026, in the peer-reviewed journal Ecology and Evolution.
1st known case of interspecies ant grooming
The behavior begins when a harvester ant leaves its nest and approaches a cone ant colony. Instead of showing aggression or defensive behavior, the large ant stops abruptly, often standing still with its mandibles open and its body held high.
Within seconds, cone ants emerge from the nest and climb onto the harvester ant’s body. They move quickly across its surface, using their mouthparts to lick and scrape tiny particles from its exoskeleton. The cleaning is deliberate and methodical, covering the head, legs and even sensitive areas near the mandibles.
These interactions vary widely in duration. Some last less than 15 seconds, while others continue for several minutes. In more intense encounters, multiple cone ants work simultaneously on a single harvester ant, creating a coordinated cleaning session. Remarkably, even when cone ants enter the open jaws of the larger ant, no aggression occurs. Moffett said:
The potentially dangerous harvester ants even permit the visitors to groom between their open jaws.
Once the interaction ends, the harvester ant suddenly jerks its body and dislodges the smaller ants with force before resuming its normal activities.
Here’s a harvester ant on a nest, waiting for cone ants to arrive. Image via Mark Moffett/ Minden Pictures (used with permission).
Why do small ants clean larger ants?
Scientists are still working to understand the evolutionary logic behind this unusual relationship. But early evidence suggests both species may gain specific benefits from the interaction.
Cone ants appear to consume microscopic particles found on the surface of harvester ants. These particles may include fragments of seed material or organic debris collected during foraging. Interestingly, cone ants only engage in this behavior with living harvester ants and completely ignore dead individuals placed near their nests. This suggests the interaction depends on chemical cues or movement from the host ant.
For harvester ants, the benefit may lie in improved hygiene. While they already perform mutual grooming within their own colonies, cone ants can access regions of the body that are difficult for nestmates to reach. This may help reduce parasites, fungal spores or bacterial buildup that could otherwise affect colony health. Moffett said:
Given the usual tendencies of ants, I first assumed that I was observing aggression. But the larger ants seemed to seek the attention of the smaller ants by first visiting their nests and then allowing the small ants to lick and nibble all over them.
Harvester ants collect seeds as part of their foraging routine, sometimes becoming hosts for smaller cone ants that feed on microscopic debris from their bodies. Image via Mark Moffett/ Minden Pictures/ Smithsonian.
A discovery that mirrors ocean life
This interaction strongly resembles cleaning systems found in marine environments, where small fish and shrimp remove parasites from much larger fish, including predators like sharks. Moffett commented:
This new ant species is the insect equivalent of cleaner fish in the ocean.
The similarity raises interesting questions about whether such cooperative behavior evolves independently in different environments. In both cases, a smaller species gains food while a larger species receives hygiene benefits.
Cone ant workers carefully clean harvester ants. Because they are smaller, they can reach places other nestmates can’t. Image via Mark Moffett/ Minden Pictures (used with permission).There’s nothing to fear, as both species get benefits. Here’s a cone ant exploring between the mandibles of a harvester ant worker. Image via Mark Moffett/ Minden Pictures (used with permission).
What this means for insect research
Moffett emphasizes that this discovery highlights how much remains unknown about insect behavior in natural environments. He argues that field observation continues to play a crucial role in uncovering complex ecological relationships that laboratory studies might miss. Moffett said:
All kinds of amazing discoveries are still there to be made outside of the lab. Finding new species and behaviors in nature often requires us to pay close attention to the small things — including the ants.
He also notes that the behavior was easy to overlook at first, as it occurs quickly and in a remote desert environment. However, repeated observations confirmed that it was not accidental but a consistent pattern.
The finding opens new research directions, including whether similar interspecies grooming systems exist elsewhere and how widespread this type of cooperation might be among insects.
Cone ants get food from microscopic debris on harvester ants, while harvester ants gain external cleaning that may reduce parasites and improve hygiene. Here’s a harvester worker that has thrown herself onto her back to remove the cone ants that were cleaning her after an extended period of time. Team work! Image via Mark Moffett/ Minden Pictures (used with permission).
Bottom line: Small ants clean larger ants in the first known case of interspecies grooming between ants. A researcher spotted this rare behavior in Arizona.
So, how can you optimize your chances of seeing a great meteor display? Follow the tips below.
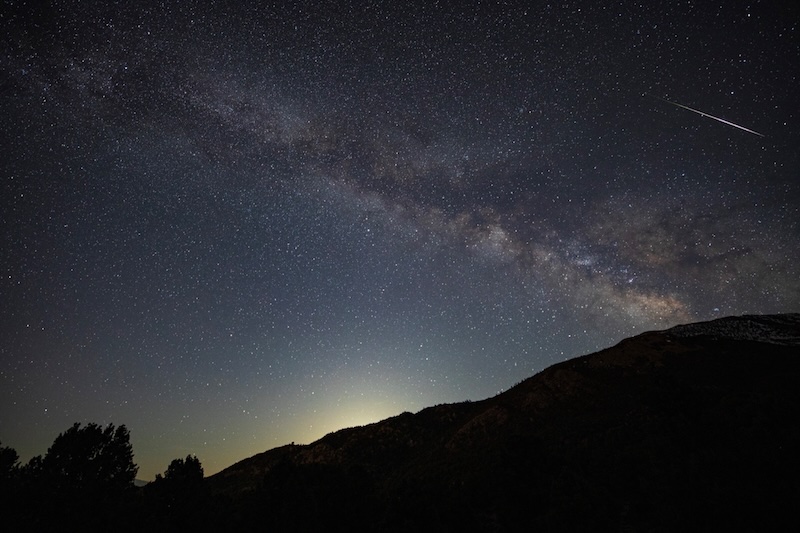
View at EarthSky Community Photos. | Jeremy Evans of California captured a Lyrid meteor zipping along the Milky Way on April 22, 2025. Jeremy wrote: “Lyrid meteor shower at peak activity. It was a quiet shower this year. I had my camera going all night and only caught one meteor. This single frame is from an all-night 1,200 frame time lapse on my front deck. I’m very fortunate to live under dark Bortle 2 skies. The glow on the horizon is from the last quarter moon just before rising. This meteor also left smoke trails.” Thank you, Jeremy.
1. Know the peak time
Generally, meteor showers happen over many days as Earth encounters a wide stream of icy particles in space. These particles are debris left behind by a comet. So the peak is a point in time when Earth is expected to encounter the greatest number of comet particles. To find the peak dates of meteor showers, check EarthSky’s meteor guide.
And here’s the catch … the peak of the shower comes at the same time for all of us on Earth. Meanwhile, our clocks are saying different times. You’ll often need to adjust from UTC to your local time.
However, the predictions are not always right on the money. And remember … it’s possible to see nice meteor displays in the hours – even days – before or after the predicted peak.
Also, keep in mind that meteor showers are part of nature. So naturally, they often defy prediction.
And … you need a wide-open view of the sky. A farmer’s field? Maybe a stretch of country road? Or a campsite with a clear view in one or more directions? That’s because an open sky will increase your chances of seeing some meteors.
3. Oh no! The moon is out
During a meteor shower, a bright moon is not your friend. In fact, nothing dampens the display of a meteor shower more effectively than a bright moon.
If the moon is out, look at areas of the sky away from the moon. Anything in the moon’s vicinity – including meteors – will likely be washed out by its bright light. And, another tip for watching in moonlight: place some object between yourself and the moon. Observing from the shadow of a barn, or vehicle, even a tree, can help you see more meteors. Basically, place yourself somewhere in the moon’s shadow.
4. Know the expected rate
Here, we touch on a topic that sometimes leads to some disappointment, especially among novice meteor-watchers: the rate.
Tables of meteor showers almost always list what is known as the zenithal hourly rate (ZHR) for each shower.
So the ZHR is the number of meteors you’ll see if you’re watching in a very dark sky, with the radiant overhead, when the shower is at its peak. In other words, the ZHR represents the number of meteors you might see per hour given the very best observing conditions during the shower’s maximum.
If the peak occurs when it’s still daylight at your location, if most of the meteors are predominantly faint, if a bright moon is out or if you’re located in a light-polluted area, the total number of meteors you see will be considerably reduced.
5. Don’t worry too much about radiant points
You don’t need to stare all night in a single direction – or even locate the radiant point – to have fun watching the shower. The meteors will appear all over the sky.
But … although you can see meteors shoot up from the horizon before a shower’s radiant rises, you’ll see more meteors after it rises. And you’ll see the most when the radiant is highest in the sky. So, find out the radiant point’s rising time. Then you can pinpoint the best time of night to watch the shower.
And … the radiant point is interesting. If you track meteors backward on the sky’s dome, you’ll find them streaming from their radiant point, a single point within a given constellation. Hence the meteor shower’s name.
6. Watch for an hour or more
Meteor showers will be better if you let your eyes adapt to the dark. That can take as long as 20 minutes. Plus, the meteors tend to come in spurts, followed by lulls. So, be patient! You’ll see some.
7. Notice the meteors’ speeds and colors
The Leonids are the swiftest meteors and the Taurids are the slowest meteors. The nice thing about a slow or medium speed meteor shower – such as the Lyrids – is if you see one and yell “meteor,” other people can catch it as well.
In fact, of the upcoming meteor showers … the Lyrids and the Delta Aquariids are medium speed showers. The Eta Aquariids and Perseids are swift meteors.
Plus, the April Lyrids, the December Geminids, and the August Perseids, can be colorful.
8. Watch for meteor trains
A meteor train is a persistent glow in the air left by some meteors after they have faded from view. Trains are from luminous ionized matter left in the wake of this incoming space debris. Some of the bright Lyrid meteors leave a persistent train. So you you might be lucky and see one.
9. Bring a blanket, a buddy, a hot drink and a lawn chair
A reclining lawn chair helps you lie back in comfort for an hour or more of meteor-watching.
If several of you are watching, take different parts of the sky. If you see one, shout “Meteor!” Dress warmly; the nights can be cool or cold, even during the summer months. You’ll probably appreciate that blanket and warm drink in the wee hours of the morning. Also, leave your laptops and tablets home; even using the nighttime dark mode will ruin your night vision. And this will be tough on some people: leave your cell phone in your pocket or the car. It can also ruin your night vision.
10. Enjoy nature
Relax and enjoy the night sky. Not every meteor shower is a winner. Sometimes, you may come away from a shower seeing only one meteor. But if that one meteor is bright, and takes a slow path across a starry night sky … it’ll be worth it.
To be successful at observing any meteor shower, you need to get into a kind of zen state, waiting and expecting the meteors to come to you, if you place yourself in a good position (country location, wide open sky) to see them.
Or forget the zen state, and let yourself be guided by this old meteor watcher’s motto:
You might see a lot or you might not see many, but if you stay in the house, you won’t see any.
Photos of meteors from EarthSky’s community
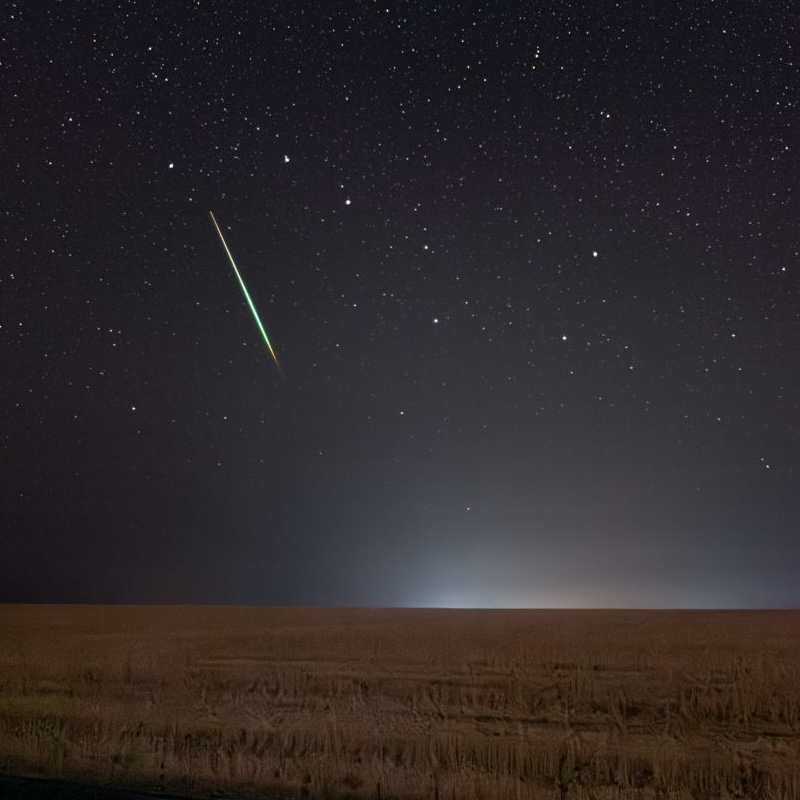
View at EarthSky Community Photos. | Tameem Altameemi of United Arab Emirates submitted this photo on December 14, 2024, and wrote: “My brother and I decided to go to an area away from light pollution between the mountains in UAE, and despite the moonlight that filled the place, we were able to see and photograph many meteors and fireballs. A special and completely clear night.” Thank you, Tameem!View at EarthSky Community Photos. | Jeff Berkes in Assateague Island National Seashore, Maryland, shared this stunning image of a Geminid meteor he captured on December 14, 2024. Jeff wrote: “The wind was really blowing off the ocean, kicking up some nice waves, which created some minor erosion along the shoreline. I never let the moon or the cold keep me in for the Geminids!” Well done, Jeff!View at EarthSky Community Photos. | Some of the stars of the Big Dipper are part of an open cluster called the Ursa Major Moving Group. On September 6, 2024, Susan Jensen captured this image and wrote: “Right place, right time! Standing on a gravel road in the middle of nowhere, looking across a stubble field. This slow-moving, vibrant meteor stopped me in my tracks! I was shooting the Big Dipper with the shutter locked to catch multiple frames for stacking when this monster did a slow flyby. How lucky that I was able to capture it!” Thank you, Susan!
Bottom line: Meteor showers are unpredictable but always a fun and relaxing time. Optimize your viewing with these tips.
So, how can you optimize your chances of seeing a great meteor display? Follow the tips below.
View at EarthSky Community Photos. | Jeremy Evans of California captured a Lyrid meteor zipping along the Milky Way on April 22, 2025. Jeremy wrote: “Lyrid meteor shower at peak activity. It was a quiet shower this year. I had my camera going all night and only caught one meteor. This single frame is from an all-night 1,200 frame time lapse on my front deck. I’m very fortunate to live under dark Bortle 2 skies. The glow on the horizon is from the last quarter moon just before rising. This meteor also left smoke trails.” Thank you, Jeremy.
1. Know the peak time
Generally, meteor showers happen over many days as Earth encounters a wide stream of icy particles in space. These particles are debris left behind by a comet. So the peak is a point in time when Earth is expected to encounter the greatest number of comet particles. To find the peak dates of meteor showers, check EarthSky’s meteor guide.
And here’s the catch … the peak of the shower comes at the same time for all of us on Earth. Meanwhile, our clocks are saying different times. You’ll often need to adjust from UTC to your local time.
However, the predictions are not always right on the money. And remember … it’s possible to see nice meteor displays in the hours – even days – before or after the predicted peak.
Also, keep in mind that meteor showers are part of nature. So naturally, they often defy prediction.
And … you need a wide-open view of the sky. A farmer’s field? Maybe a stretch of country road? Or a campsite with a clear view in one or more directions? That’s because an open sky will increase your chances of seeing some meteors.
3. Oh no! The moon is out
During a meteor shower, a bright moon is not your friend. In fact, nothing dampens the display of a meteor shower more effectively than a bright moon.
If the moon is out, look at areas of the sky away from the moon. Anything in the moon’s vicinity – including meteors – will likely be washed out by its bright light. And, another tip for watching in moonlight: place some object between yourself and the moon. Observing from the shadow of a barn, or vehicle, even a tree, can help you see more meteors. Basically, place yourself somewhere in the moon’s shadow.
4. Know the expected rate
Here, we touch on a topic that sometimes leads to some disappointment, especially among novice meteor-watchers: the rate.
Tables of meteor showers almost always list what is known as the zenithal hourly rate (ZHR) for each shower.
So the ZHR is the number of meteors you’ll see if you’re watching in a very dark sky, with the radiant overhead, when the shower is at its peak. In other words, the ZHR represents the number of meteors you might see per hour given the very best observing conditions during the shower’s maximum.
If the peak occurs when it’s still daylight at your location, if most of the meteors are predominantly faint, if a bright moon is out or if you’re located in a light-polluted area, the total number of meteors you see will be considerably reduced.
5. Don’t worry too much about radiant points
You don’t need to stare all night in a single direction – or even locate the radiant point – to have fun watching the shower. The meteors will appear all over the sky.
But … although you can see meteors shoot up from the horizon before a shower’s radiant rises, you’ll see more meteors after it rises. And you’ll see the most when the radiant is highest in the sky. So, find out the radiant point’s rising time. Then you can pinpoint the best time of night to watch the shower.
And … the radiant point is interesting. If you track meteors backward on the sky’s dome, you’ll find them streaming from their radiant point, a single point within a given constellation. Hence the meteor shower’s name.
6. Watch for an hour or more
Meteor showers will be better if you let your eyes adapt to the dark. That can take as long as 20 minutes. Plus, the meteors tend to come in spurts, followed by lulls. So, be patient! You’ll see some.
7. Notice the meteors’ speeds and colors
The Leonids are the swiftest meteors and the Taurids are the slowest meteors. The nice thing about a slow or medium speed meteor shower – such as the Lyrids – is if you see one and yell “meteor,” other people can catch it as well.
In fact, of the upcoming meteor showers … the Lyrids and the Delta Aquariids are medium speed showers. The Eta Aquariids and Perseids are swift meteors.
Plus, the April Lyrids, the December Geminids, and the August Perseids, can be colorful.
8. Watch for meteor trains
A meteor train is a persistent glow in the air left by some meteors after they have faded from view. Trains are from luminous ionized matter left in the wake of this incoming space debris. Some of the bright Lyrid meteors leave a persistent train. So you you might be lucky and see one.
9. Bring a blanket, a buddy, a hot drink and a lawn chair
A reclining lawn chair helps you lie back in comfort for an hour or more of meteor-watching.
If several of you are watching, take different parts of the sky. If you see one, shout “Meteor!” Dress warmly; the nights can be cool or cold, even during the summer months. You’ll probably appreciate that blanket and warm drink in the wee hours of the morning. Also, leave your laptops and tablets home; even using the nighttime dark mode will ruin your night vision. And this will be tough on some people: leave your cell phone in your pocket or the car. It can also ruin your night vision.
10. Enjoy nature
Relax and enjoy the night sky. Not every meteor shower is a winner. Sometimes, you may come away from a shower seeing only one meteor. But if that one meteor is bright, and takes a slow path across a starry night sky … it’ll be worth it.
To be successful at observing any meteor shower, you need to get into a kind of zen state, waiting and expecting the meteors to come to you, if you place yourself in a good position (country location, wide open sky) to see them.
Or forget the zen state, and let yourself be guided by this old meteor watcher’s motto:
You might see a lot or you might not see many, but if you stay in the house, you won’t see any.
Photos of meteors from EarthSky’s community
View at EarthSky Community Photos. | Tameem Altameemi of United Arab Emirates submitted this photo on December 14, 2024, and wrote: “My brother and I decided to go to an area away from light pollution between the mountains in UAE, and despite the moonlight that filled the place, we were able to see and photograph many meteors and fireballs. A special and completely clear night.” Thank you, Tameem!View at EarthSky Community Photos. | Jeff Berkes in Assateague Island National Seashore, Maryland, shared this stunning image of a Geminid meteor he captured on December 14, 2024. Jeff wrote: “The wind was really blowing off the ocean, kicking up some nice waves, which created some minor erosion along the shoreline. I never let the moon or the cold keep me in for the Geminids!” Well done, Jeff!View at EarthSky Community Photos. | Some of the stars of the Big Dipper are part of an open cluster called the Ursa Major Moving Group. On September 6, 2024, Susan Jensen captured this image and wrote: “Right place, right time! Standing on a gravel road in the middle of nowhere, looking across a stubble field. This slow-moving, vibrant meteor stopped me in my tracks! I was shooting the Big Dipper with the shutter locked to catch multiple frames for stacking when this monster did a slow flyby. How lucky that I was able to capture it!” Thank you, Susan!
Bottom line: Meteor showers are unpredictable but always a fun and relaxing time. Optimize your viewing with these tips.
A new study from researchers in Japan suggests that a better way to search for alien life might be to look for suspiciously similar planets that are close to each other. The idea is that if life has spread to neighboring planets, it would need to create a similar environment to its home planet in order to survive. Image via EarthSky with the help of AI.
Searching for evidence of life on planets around other stars is difficult. A single detection of a certain chemical in an atmosphere or an unusual radio wave could be ambiguous and hard to verify.
Scientists should look for patterns across groups of planets in a planetary system instead, researchers in Japan suggest.
Such patterns on multiple planets might suggest that life has spread to neighboring planets and made the conditions more amenable to them. So these patterns could be an indicator of alien life.
Suspiciously similar planets could be a sign of alien life
Currently, scientists searching for life beyond Earth focus a lot on looking at the light coming from a distant planet, which reveals the makeup of its atmosphere. Or they listen for non-natural radio signals coming from space. But on April 15, 2026, a new study from researchers in Japan said scientists should look for signs of life in groups of planets that are suspiciously similar. Detecting patterns across a group of planets might suggest that life has spread from its home planet to neighboring planets and transformed them to accommodate their needs.
The current methods of looking for life through biosignatures (chemical or physical signs of life) or technosignatures (signs of alien technology) can be ambiguous. So a signature found among a cluster of planets would be stronger evidence than a single detection on one planet alone. The new model suggests that if life can spread between planets and affect their observable properties, then detecting this could be a robust signature of life, with few false positives.
When astronomers talk about life spreading between worlds, they call it panspermia. And the concept of altering a planet to suit an alien lifeform is called terraforming. Microbes that traveled via panspermia to another planet could alter the planet’s atmosphere or surface naturally. And an advanced alien civilization could terraform nearby planets artificially. Even humans have contemplated how we could someday terraform Mars to make it more habitable and earthlike.
Harrison B. Smith at the Earth-Life Science Institute, Institute of Science Tokyo, and Lana Sinapayen at Sony Computer Science Laboratories and National Institute for Basic Biology in Japan are the authors of the new study. They published their peer-reviewed findings in The Astrophysical Journal on April 9, 2026.
Our paper on detecting terraformed planets is finally published: doi.org/10.3847/1538…Context: we wanted a method to detect life in the universe that does not depend on any particular chemistry or hyperspecific definitions of life1/n#Astrobiology #ALife
The researchers are taking what they call an agnostic approach. That’s what they consider one not bound to any particular hypotheses or beliefs about alien life. So this approach seeks to overcome the limitations of of possible detections on single planets. Simple biosignatures are susceptible to false positives. Technosignatures are less susceptible, but they make strong assumptions about what kind of life could produce them.
Instead, the new approach seeks to find possible life signatures across multiple planets at a time. The signature could affect the observable properties of the planets in a similar way. Notably, this would be a stronger potential signature than on one single planet alone.
Basically, the approach is based on the assumption that life could spread between planets naturally. This is panspermia, where microbes or other cells could escape one planet – such as through an asteroid impact – and spread to other nearby planets.
In either of those two scenarios, life could alter the characteristics of the planets in similar ways. The statistical correlations between planet locations and their observable traits would be detectable.
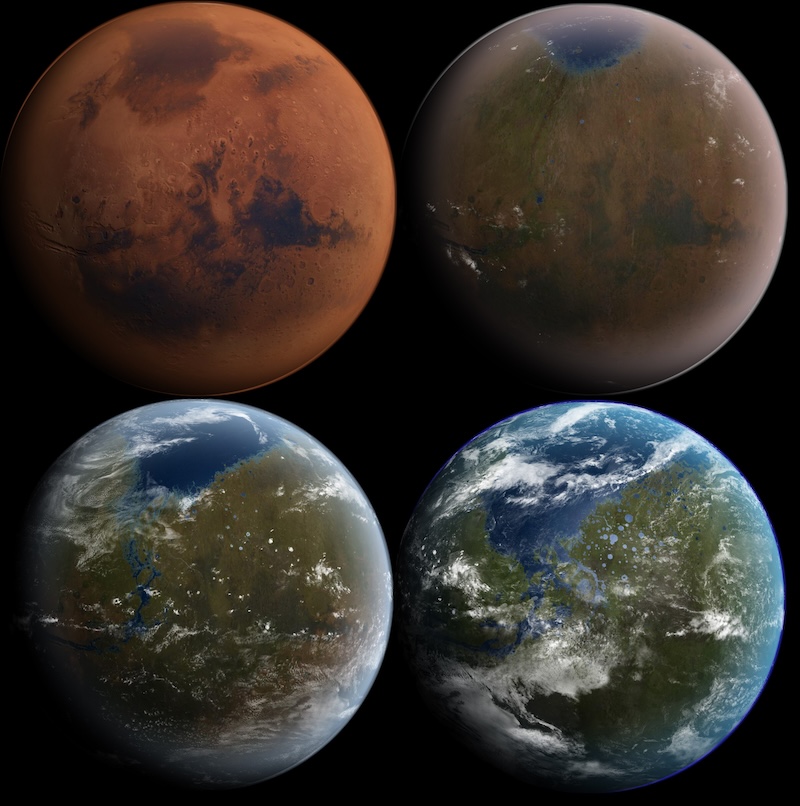
View larger. | Some scientists think we could gradually terraform Mars in the future. That would be an example of intelligent life (humans) changing a nearby planet to be more like its own world. But even microbes could naturally change a planet through panspermia. Image via Daein Ballard/ Wikimedia Commons (CC BY-SA 3.0).
A broad definition of life
Sinapayen described the process on Bluesky, saying:
We wanted a method to detect life in the universe that does not depend on any particular chemistry or hyperspecific definitions of life. So we started with the broadest definition we could think of: Life self-replicates and mutates.
If a form of life landed upon a new planet and survived, it would change the environment on that planet in a way that makes it closer to the origin planet; think of trees producing oxygen, for example. That would be true whether the lifeform is a bacteria, a whole ecosystem, or characters from Andy Weir’s books.
Our question: Without knowing whether any single planet has life on it, could you at least detect that some planets seem suspiciously related? The answer (through simulations): under some conditions, you can make that detection with high certainty and no false positives. You can say ‘there is an X percent chance terraformation is happening’ and point to the planets that are driving that percentage up.
If life can travel to other planets and terraform them, those patterns will emerge between the locations of planets and their observable characteristics (for example, atmospheric composition). On the left, planets show no correlation between their locations and their characteristics. However, if life capable of panspermia and terraforming arises, then correlations emerge (right). In the model, life chooses its destination by looking for the planet with the most similar composition within some maximum distance. Image via Harrison B. Smith/ Earth-Life Science Institute (CC BY 4.0).
‘Something must be happening’
Sinapayen continued:
The best part is that it’s not just ‘oh, these planets look similar, something must be happening.’ Our method specifically picks out planets that seem to have an ‘ancestor to descendant’ relationship through ‘self replication with mutation.’ Because when life replicates with mutation in physical space, on average the parents and children will be closer both in space and in characteristics than the parents and the grandchildren, for example. So you’re looking for a correlation of location and characteristics, not just characteristics.
Harrison B. Smith at the Earth-Life Science Institute in Japan is a co-author of the new study about panspermia, terraforming and alien life. Image via Earth-Life Science Institute.Lana Sinapayen at Sony Computer Science Laboratories and National Institute for Basic Biology in Japan is a co-author of the new study about panspermia, terraforming and alien life. Image via Google Scholar.
Planets most likely to host life
The researchers also developed a new method to determine which planets might be the most likely to be habitable or host life. They did so by clustering planets based on their observable characteristics and spatial relationships. This provided clues as to which groups of planets had a high probability of being influenced by life. Smith said:
By focusing on how life spreads and interacts with environments, we can search for it without needing a perfect definition or a single definitive signal.
Sinapayen added:
Even if life elsewhere is fundamentally different from life on Earth, its large-scale effects, such as spreading and modifying planets, may still leave detectable traces. That’s what makes this approach compelling.
Bottom line: A new study from Japan suggests we could search for a sign of alien life by looking for a group of planets that are suspiciously similar. Alien life that spreads to neighboring planets would likely transform each new planet to be like their home planet.
A new study from researchers in Japan suggests that a better way to search for alien life might be to look for suspiciously similar planets that are close to each other. The idea is that if life has spread to neighboring planets, it would need to create a similar environment to its home planet in order to survive. Image via EarthSky with the help of AI.
Searching for evidence of life on planets around other stars is difficult. A single detection of a certain chemical in an atmosphere or an unusual radio wave could be ambiguous and hard to verify.
Scientists should look for patterns across groups of planets in a planetary system instead, researchers in Japan suggest.
Such patterns on multiple planets might suggest that life has spread to neighboring planets and made the conditions more amenable to them. So these patterns could be an indicator of alien life.
Suspiciously similar planets could be a sign of alien life
Currently, scientists searching for life beyond Earth focus a lot on looking at the light coming from a distant planet, which reveals the makeup of its atmosphere. Or they listen for non-natural radio signals coming from space. But on April 15, 2026, a new study from researchers in Japan said scientists should look for signs of life in groups of planets that are suspiciously similar. Detecting patterns across a group of planets might suggest that life has spread from its home planet to neighboring planets and transformed them to accommodate their needs.
The current methods of looking for life through biosignatures (chemical or physical signs of life) or technosignatures (signs of alien technology) can be ambiguous. So a signature found among a cluster of planets would be stronger evidence than a single detection on one planet alone. The new model suggests that if life can spread between planets and affect their observable properties, then detecting this could be a robust signature of life, with few false positives.
When astronomers talk about life spreading between worlds, they call it panspermia. And the concept of altering a planet to suit an alien lifeform is called terraforming. Microbes that traveled via panspermia to another planet could alter the planet’s atmosphere or surface naturally. And an advanced alien civilization could terraform nearby planets artificially. Even humans have contemplated how we could someday terraform Mars to make it more habitable and earthlike.
Harrison B. Smith at the Earth-Life Science Institute, Institute of Science Tokyo, and Lana Sinapayen at Sony Computer Science Laboratories and National Institute for Basic Biology in Japan are the authors of the new study. They published their peer-reviewed findings in The Astrophysical Journal on April 9, 2026.
Our paper on detecting terraformed planets is finally published: doi.org/10.3847/1538…Context: we wanted a method to detect life in the universe that does not depend on any particular chemistry or hyperspecific definitions of life1/n#Astrobiology #ALife
The researchers are taking what they call an agnostic approach. That’s what they consider one not bound to any particular hypotheses or beliefs about alien life. So this approach seeks to overcome the limitations of of possible detections on single planets. Simple biosignatures are susceptible to false positives. Technosignatures are less susceptible, but they make strong assumptions about what kind of life could produce them.
Instead, the new approach seeks to find possible life signatures across multiple planets at a time. The signature could affect the observable properties of the planets in a similar way. Notably, this would be a stronger potential signature than on one single planet alone.
Basically, the approach is based on the assumption that life could spread between planets naturally. This is panspermia, where microbes or other cells could escape one planet – such as through an asteroid impact – and spread to other nearby planets.
In either of those two scenarios, life could alter the characteristics of the planets in similar ways. The statistical correlations between planet locations and their observable traits would be detectable.
View larger. | Some scientists think we could gradually terraform Mars in the future. That would be an example of intelligent life (humans) changing a nearby planet to be more like its own world. But even microbes could naturally change a planet through panspermia. Image via Daein Ballard/ Wikimedia Commons (CC BY-SA 3.0).
A broad definition of life
Sinapayen described the process on Bluesky, saying:
We wanted a method to detect life in the universe that does not depend on any particular chemistry or hyperspecific definitions of life. So we started with the broadest definition we could think of: Life self-replicates and mutates.
If a form of life landed upon a new planet and survived, it would change the environment on that planet in a way that makes it closer to the origin planet; think of trees producing oxygen, for example. That would be true whether the lifeform is a bacteria, a whole ecosystem, or characters from Andy Weir’s books.
Our question: Without knowing whether any single planet has life on it, could you at least detect that some planets seem suspiciously related? The answer (through simulations): under some conditions, you can make that detection with high certainty and no false positives. You can say ‘there is an X percent chance terraformation is happening’ and point to the planets that are driving that percentage up.
If life can travel to other planets and terraform them, those patterns will emerge between the locations of planets and their observable characteristics (for example, atmospheric composition). On the left, planets show no correlation between their locations and their characteristics. However, if life capable of panspermia and terraforming arises, then correlations emerge (right). In the model, life chooses its destination by looking for the planet with the most similar composition within some maximum distance. Image via Harrison B. Smith/ Earth-Life Science Institute (CC BY 4.0).
‘Something must be happening’
Sinapayen continued:
The best part is that it’s not just ‘oh, these planets look similar, something must be happening.’ Our method specifically picks out planets that seem to have an ‘ancestor to descendant’ relationship through ‘self replication with mutation.’ Because when life replicates with mutation in physical space, on average the parents and children will be closer both in space and in characteristics than the parents and the grandchildren, for example. So you’re looking for a correlation of location and characteristics, not just characteristics.
Harrison B. Smith at the Earth-Life Science Institute in Japan is a co-author of the new study about panspermia, terraforming and alien life. Image via Earth-Life Science Institute.Lana Sinapayen at Sony Computer Science Laboratories and National Institute for Basic Biology in Japan is a co-author of the new study about panspermia, terraforming and alien life. Image via Google Scholar.
Planets most likely to host life
The researchers also developed a new method to determine which planets might be the most likely to be habitable or host life. They did so by clustering planets based on their observable characteristics and spatial relationships. This provided clues as to which groups of planets had a high probability of being influenced by life. Smith said:
By focusing on how life spreads and interacts with environments, we can search for it without needing a perfect definition or a single definitive signal.
Sinapayen added:
Even if life elsewhere is fundamentally different from life on Earth, its large-scale effects, such as spreading and modifying planets, may still leave detectable traces. That’s what makes this approach compelling.
Bottom line: A new study from Japan suggests we could search for a sign of alien life by looking for a group of planets that are suspiciously similar. Alien life that spreads to neighboring planets would likely transform each new planet to be like their home planet.
Artist’s depiction of a supermassive black hole tearing apart a star. Roughly half of the stellar debris gets flung back into space while the remainder forms a glowing accretion disk around the black hole. Researchers at Syracuse University have created new high-resolution simulations to show how black holes create streams of stellar debris. Image via DESY/ Science Communication Lab/ Syracuse University.
When a star strays too close to a supermassive black hole, it gets torn apart. The debris accumulates to produce a brilliant flare called a tidal disruption event, or TDE.
New high-resolution simulations confirm the stellar debris forms a narrow stream that encircles the black hole and collides with itself. Earlier models couldn’t capture this detail.
Black hole spin may deflect the debris stream off course, offering a potential reason why no two TDEs look alike.
Supermassive black holes are among the most enigmatic objects in the universe. They typically weigh millions or even billions of times the mass of the sun. And they sit at the centers of most large galaxies. For example, at the heart of the Milky Way lies Sagittarius A*, our galaxy’s supermassive black hole. It has the mass of about 4 million suns. But these black holes do not emit light, so astronomers can only detect them indirectly through their effects on nearby stars and gas.
The Astrophysical Journal Letterspublished a new study on March 9, 2026. In it, co-author Eric Coughlin, assistant professor of physics in Syracuse University’s College of Arts and Sciences, and colleagues clarify what happens when a star wanders too close to one of these black holes and is torn apart.
When black holes capture stars
A star ingested by a supermassive black hole does not simply vanish in a single gulp. Instead, the black hole’s gravity tears the star into a long, thin debris stream. Over time, the debris stream wraps around the black hole. This is an effect that ultimately arises from Einstein’s General Theory of Relativity. Gravity according to Newton does not produce this effect.
When parts of that circling stream crash into one another, they release a burst of energy and subsequently accrete, or slowly spiral into, the black hole. Both of these effects – the initial collision and the subsequent accretion – produce so much radiation that they briefly outshine the entire galaxy in which they occur.
Astronomers refer to these events as tidal disruption events, or TDEs. TDEs offer one of the few ways to study supermassive black holes like Sagittarius A* in other galaxies. Coughlin said:
We can study tidal disruption events to learn more about black holes hidden from view.
For years, TDEs have fascinated researchers because each of these massive flares is like a fingerprint. By measuring how a flare rises, peaks and fades, scientists can infer properties of the black hole that produced it. These properties include its mass and perhaps its spin. But the details of how these flares form have remained difficult to pin down, in part because the process is hard to simulate accurately.
Seeing the debris clearly
That is where new high-resolution simulations are changing the picture. Recent work by a team led by Lucio Mayer at the University of Zurich uses a methodology known as smoothed particle hydrodynamics. This methodology decomposes a star into particles that interact with one another hydrodynamically. These are the same fundamental equations that govern the flow of water through a pipe.
Their study employed tens of billions of particles to model the disrupted star’s gas in unprecedented detail. The result is a superior view of what happens after a star gets ripped apart. Rather than dispersing chaotically, the debris forms a narrow, coherent stream that follows a predictable path around the black hole before crashing into itself.
Their finding supports a long-standing theoretical prediction. Earlier simulations often mischaracterized the stream’s structure because they lacked the resolution to capture such fine detail. This lead to a “spraying” of the stellar debris and unexpectedly high levels of fluid-dynamical dissipation. With far more particles and through the exploitation of graphics processing units on powerful supercomputers, the shape of the debris becomes much easier to see.
But the new models also reveal something else.
A 3D rendering of modeled debris particles. It highlights the self-intersection of the debris stream flow after a black hole rips apart a star. Image via Jean Favre, CSCS/ Lucio Mayer and Noah Kubli, University of Zurich/ Syracuse University.
The spin factor
Three properties of a supermassive black hole and the stellar orbit can influence the outcome of a given TDE: the black hole’s mass, how fast it spins, and the orientation of that spin relative to the orbital plane of the incoming debris. Together, they may determine when the flare begins, how bright it becomes and how long it lasts.
If the black hole is rotating, it induces additional variation in the spacetime around it compared to a non-spinning black hole. And that produces an effect known as nodal precession. This effect may shift the debris stream out of its original plane. So the stream may miss itself after one orbit, then miss again before finally colliding. In some cases, the flare may be delayed by several loops around the black hole.
No two are alike
That complication may help explain one of the enduring puzzles of TDE research. No two events look exactly alike. Some rise quickly and fade fast. Others unfold more slowly. Some are brighter, some dimmer. Some behave in ways that are still hard to classify. While differences in the mass of the black hole could account for some of these differences, these new simulations suggest that black hole spin may be one of the key reasons for that diversity.
TDEs turn invisible objects into readable signals. A star gets shredded, debris collides, light emerges and a previously hidden black hole is revealed. With better simulations and more powerful telescopes, astronomers are learning how to read those signals more clearly than ever before.
Bottom line: When black holes tear apart stars, the wreckage heats up, creating brilliant flares. And now new simulations are showing these flares with more detail than ever before.
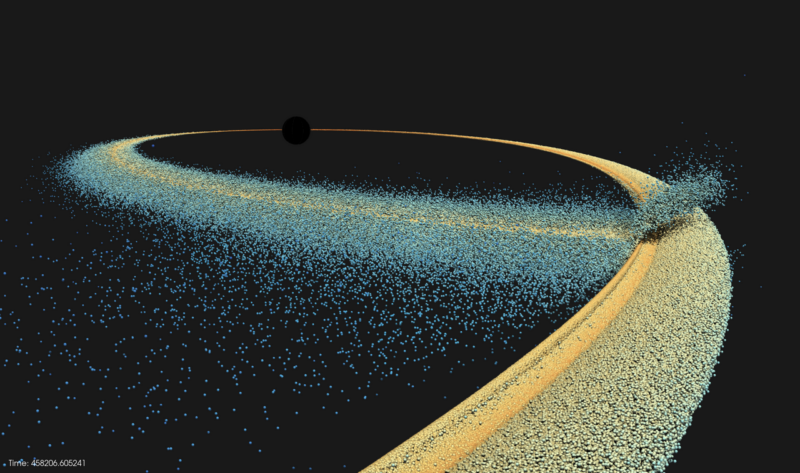
This visualization shows how DESI’s 3D map of the universe accumulated over 5 years. It begins with DESI’s tiles on the night sky, each observing around 5,000 galaxies. As we move out to see the observations in 3D, we see how DESI maps the cosmic web of filaments and voids. Earth is at the center of the wedges, and every dot represents a galaxy. Image via DESI Collaboration and DESI Member Institutions/ DOE/ KPNO/ NOIRLab/ NSF/ AURA/ R. Proctor.
The Dark Energy Spectroscopic Instrument has created one of the most extensive surveys of the cosmos ever conducted. The five-year survey is now complete.
DESI has mapped more than 47 million galaxies and quasars. This is the largest high-resolution 3D map of our universe to date.
DESI will continue observations into 2028 and further expand the map. The observations will help astronomers understand how dark energy works in the universe.
On Tuesday night, April 14, 2026, the 5,000 fiber-optic eyes of the Dark Energy Spectroscopic Instrument (DESI) swiveled onto a patch of sky near the Little Dipper. Roughly every 20 minutes, it locked onto distant pinpricks of light, gathering photons that had traveled toward Earth for billions of years. When the sun rose, the instrument had completed a major milestone. It had successfully surveyed all areas in a planned 3D map of the universe.
The five-year survey, finished ahead of schedule and with vastly more data than expected, has produced the largest high-resolution 3D map of the universe ever made. Researchers use that map to explore dark energy, the fundamental ingredient that makes up about 70% of our universe and is driving its accelerating expansion.
View larger. | This is a small portion of DESI’s 5-year map. You can see the large-scale structure of the universe, created by gravity. Each dot represents a galaxy. The denser areas indicate regions where galaxies and galaxy clusters have clumped together to form the strands of the cosmic web. You can also see large voids between the filaments. Image via DESI Collaboration and DESI Member Institutions/ DOE/ KPNO/ NOIRLab/ NSF/ AURA/ R. Proctor. Image processing: M. Zamani (NSF NOIRLab).
The mission of DESI
DESI’s quest to understand dark energy is a global endeavor. The international experiment brings together the expertise of more than 900 researchers (including 300 Ph.D. students) from over 70 institutions. The U.S. Department of Energy’s Lawrence Berkeley National Laboratory (Berkeley Lab) manages this project. And the instrument was constructed and is operated with funding from the DOE Office of Science. DESI is mounted on the U.S. National Science Foundation Nicholas U. Mayall 4-meter Telescope at NSF Kitt Peak National Observatory (KPNO) in Arizona, a program of NSF NOIRLab.
By comparing how galaxies clustered in the past with their distribution today, researchers can trace dark energy’s influence over 11 billion years of cosmic history. Surprising results using DESI’s first three years of data hinted that dark energy, once thought to be a cosmological constant, might be evolving over time.
With the full set of five years of data, researchers will have significantly more information to test whether that hint disappears or grows. If confirmed, it would mark a major shift in how we think about our universe and its potential fate, which hinges on the balance between matter and dark energy.
A successful universe-mapping project
Stephanie Juneau, associate astronomer and NSF NOIRLab representative for DESI, said:
It’s impossible to capture everything that went into making DESI such a successful experiment. From instrument builders and software engineers to technicians, observatory staff, and scientists – including many early-career researchers – it truly took a village. Ultimately, we are doing this for all humanity, to better understand our universe and its eventual fate. After finding hints that dark energy might deviate from a constant, potentially altering that fate, this moment feels like sitting on the edge of my seat as we analyze the new map to see whether those hints will be confirmed. I’m also very intrigued by the many other discoveries that await in this new dataset.
Kathy Turner, Program Manager for the Cosmic Frontier in the Office of High Energy Physics at the Department of Energy, said:
The Dark Energy Spectroscopic Instrument has truly exceeded all expectations, delivering an unprecedented 3D map of the universe that will revolutionize our understanding of dark energy. From its inception, we envisioned a project that would push the boundaries of cosmology, and to see it come to such a spectacularly successful completion for its initial survey, ahead of schedule and with such rich data, is incredibly rewarding. The dedication and ingenuity of the entire DESI collaboration have made this world-leading science a reality, and I am immensely proud of the groundbreaking results we are already seeing and the discoveries yet to come as we continue to explore the mysteries of our cosmos.
What’s next for DESI?
DESI has now measured cosmological data for six times as many galaxies and quasars as all previous measurements combined. The collaboration will immediately begin processing the completed dataset, with the first dark energy results from the full five-year survey expected in 2027. In the meantime, DESI collaborators continue to analyze the survey’s first three years of data, refining dark energy measurements and producing additional results on the structure and evolution of the universe, with several papers planned later this year.
Michael Levi, DESI director and a scientist at Berkeley Lab, said:
We’re going to celebrate completion of the original survey and then get started on the work of churning through the data, because we’re all curious about what new surprises are waiting for us.
The plan was to capture light from 34 million galaxies and quasars (extremely distant yet bright objects with black holes at their cores) over the five-year sky survey. DESI instead observed more than 47 million galaxies and quasars, as well as 20 million stars.
Expanding the 3D map of the universe
DESI will continue observations through 2028 and grow its map by about 20%, from 14,000 square degrees to 17,000 square degrees. (For comparison, the moon covers approximately 0.2 square degrees, and the full sky has over 41,000 square degrees). The extended map will cover parts of the sky that are more challenging to observe. These are areas that are closer to the plane of the Milky Way, where bright nearby stars can make it harder to see more distant objects. It also includes areas farther to the south, where the telescope must account for peering through more of Earth’s atmosphere.
The experiment will also revisit the existing area of the map to collect data from a new set of galaxies: more distant, fainter luminous red galaxies. These will provide an even denser, more detailed map of the regions DESI has already covered, giving researchers a clearer picture of the universe’s history.
Researchers will also study nearby dwarf galaxies and stellar streams, bands of stars torn from smaller galaxies by the Milky Way’s gravity. The hope is to better understand dark matter, the invisible form of matter that accounts for most of the mass in the universe but has never been directly detected.
Bottom line: Astronomers have completed the largest, most detailed 3D map of the universe ever made. It charts tens of millions of galaxies and quasars to help reveal how dark energy shapes the cosmos.