The passion flower is our flamboyant lifeform of the week

The passion flower is a dream plant. First, it grows quickly, avoiding the wait, so you can see its beautiful flowers as soon as possible. Second, the flowers give off a delicious aroma. Therefore, this flower is used both for decoration and in perfumes. Finally, some types of this plant produce an edible fruit, which can be enjoyed fresh, used in a dish or drunk as juice.

What is the passion flower?

The passion flower is a vigorous climbing plant. It grows fast and produces spectacular and abundant flowers. Notice how many flower buds appear on the sprouts. That means it is a floriferous climbing plant, producing a large number of flowers.

Furthermore, next to the flower buds, tendrils appear. Tendrils are modified leaves the plant uses to attach to objects within reach. They have a spiral shape so they can grow and twine around things without any additional help. The tendrils are thin and elongated. Meanwhile, the stem is rigid and woody.

These plants are evergreen. But in colder climates they can die back when it freezes and then grow from the ground in the spring. These perennials generally thrive in what gardeners call zones 6 to 10.

Passion flowers can reach 30 feet (9 m) in height, as long as they find a support to climb and anchor themselves to with their tendrils. They can live up to 10 years.

Passion flower: Flower with 10 white petals and very many radial white and purple filaments with stamens and pistils in center.
The passion flower is a climbing plant that produces many colorful flowers. This plant can climb thanks to spiral tendrils that twine around things. Image via Shu/ Unsplash.

The flower is a gift for the senses

The main characteristic of this climbing plant is its flowers, which can reach 2 inches (12 cm) in diameter. The base of the flower is made up of 10 protective petals. These can vary in color or be all the same color.

You can also see a crown of filaments. Depending on the species, the color varies, as well as the texture, as they can be smooth or wavy. The most famous is the one with three colors. From inside to outside, it’s dark purple, white and blue. Other types have two colors, or only one color, such as all purple or all white.

These flowers also have five stamens and three pistils. Stamens are male floral organs. These organs contain pollen sacs, where pollen originates. The pistils are the female organs of the flower and are made up of the ovary, style and stigma.

Side view of many-petaled white flower with halo of purple filaments and prominent vertical structures in the middle.
The main characteristic of this climbing plant is its flowers. The base of the flower is made up of 10 petals. You can also see a crown of filaments and the 5 stamens and 3 pistils. Image via Attila Lisinszky/ Unsplash.

A delicious fruit

The passion flower produces a fruit called passion fruit. It is an oval or rounded fruit, between 1.5 and 4 inches (4 and 10 cm) in diameter, depending on the species. The outer part is covered by a thick and inedible shell. When ripe, the outside has a yellow, orange or purple color. The pulp, which is fibrous and juicy, is yellowish and contains numerous small, black seeds.

This fruit can be eaten fresh, with a spoon. However, with so many seeds, this is not an ideal way to eat it. For this reason, cooks have expanded their recipe books over time. Today, the passion fruit is mostly used to produce juice. Passion fruit is a common ingredient in desserts, and even in the preparation of teas, salads and vinaigrettes.

Cut-open round fruits with a purple rind and yellowish flesh with many tiny black seeds.
The passion flower produces a fruit called passion fruit. It looks oval or round. The outer part is covered by a thick and inedible shell. The pulp, which is fibrous and juicy, is yellowish and contains numerous small, black seeds. Image via Any Lane/ Pexels.

Origin of the plant

The genus Passiflora includes around 550 accepted species, although there are only about 50 varieties with edible fruits.

Most species are native to South America, although there are a few native to southern Asia, Australia and Oceania.

Plus, there are hybrids created naturally and those created by geneticists, which provide new shapes in their stems, leaves and in the color and size of their flowers and fruits. People are also seeking to improve the edible species, so the fruits have more weight, color, aroma and flavor. Thus, in total, there are about more than 1,000 described species.

Flower with 10 pink outer petals, some with a green border. Very many purple filaments and green structures in the center.
The genus Passiflora contains around 550 accepted species, but only about 50 varieties have an edible fruit. Image via Andrew Pons/ Unsplash.
Purple flower with wavy filaments and 10 petals. White structures in center, and twisty green tendrils in the background.
Most species of passion flower are native to South America. Image via Chaotic Toejam/ Unsplash.

Some types of passion flower

Below is Passiflora caerulea. It grows wild in several countries, such as Argentina, Bolivia, Brazil, Chile, Colombia, Ecuador, Paraguay, Peru, Uruguay and Venezuela in South America, Spain in Europe and the Dominican Republic in the Caribbean.

White flower with 10 petals and purple-white-blue striped filaments. Green leaves and buds in background.
Passiflora caerulea. Image via Franz van Duns/ Wikipedia (CC BY-SA 4.0).

Next is Passiflora edulis. It is a typical species of South America and Central America; specifically, it is considered native to Brazil.

Flower with white petals and long, wavy purple and white filaments and green central structures.
Passiflora edulis. Image via Wikipedia (public domain).

Here is Passiflora caerulea Constance Elliot. It is native to Mexico and the Caribbean. This plant can become invasive in some areas, but it is also food for the larvae of the Acraea andromacha butterfly.

10-petaled all-white flower with very many filaments and purple pistils and green stamens in the center.
Passiflora caerulea “Constance Elliot.” Image via Kelly Cookson/ Wikipedia (CC BY-SA 2.0).

The last species below is Passiflora vitifolia. It’s native to tropical areas such as Costa Rica, Nicaragua, Panama, Venezuela, Colombia, Ecuador, Peru and Bolivia. This plant serves as food for the larvae of the Heliconius cydno and Heliconius hecale butterflies.

All red flower. The crown of filaments is shorter and vertical. Big green leaves around the flower.
Passiflora vitifolia. Image via Density/ Wikipedia (CC BY-SA 2.5).

Bottom line: The passion flower plant is a gift for the senses. Its flowers are aromatic, abundant and colorful. And some types have an edible fruit. Plus, the structure of the flower is spectacular and unique.

Read more: Water lilies, beautiful and colorful: Lifeform of the week

Read more: Carnivorous plants are our lifeform of the week

The post The passion flower is our flamboyant lifeform of the week first appeared on EarthSky.


from EarthSky https://ift.tt/TCBU9Hm

The passion flower is a dream plant. First, it grows quickly, avoiding the wait, so you can see its beautiful flowers as soon as possible. Second, the flowers give off a delicious aroma. Therefore, this flower is used both for decoration and in perfumes. Finally, some types of this plant produce an edible fruit, which can be enjoyed fresh, used in a dish or drunk as juice.

What is the passion flower?

The passion flower is a vigorous climbing plant. It grows fast and produces spectacular and abundant flowers. Notice how many flower buds appear on the sprouts. That means it is a floriferous climbing plant, producing a large number of flowers.

Furthermore, next to the flower buds, tendrils appear. Tendrils are modified leaves the plant uses to attach to objects within reach. They have a spiral shape so they can grow and twine around things without any additional help. The tendrils are thin and elongated. Meanwhile, the stem is rigid and woody.

These plants are evergreen. But in colder climates they can die back when it freezes and then grow from the ground in the spring. These perennials generally thrive in what gardeners call zones 6 to 10.

Passion flowers can reach 30 feet (9 m) in height, as long as they find a support to climb and anchor themselves to with their tendrils. They can live up to 10 years.

Passion flower: Flower with 10 white petals and very many radial white and purple filaments with stamens and pistils in center.
The passion flower is a climbing plant that produces many colorful flowers. This plant can climb thanks to spiral tendrils that twine around things. Image via Shu/ Unsplash.

The flower is a gift for the senses

The main characteristic of this climbing plant is its flowers, which can reach 2 inches (12 cm) in diameter. The base of the flower is made up of 10 protective petals. These can vary in color or be all the same color.

You can also see a crown of filaments. Depending on the species, the color varies, as well as the texture, as they can be smooth or wavy. The most famous is the one with three colors. From inside to outside, it’s dark purple, white and blue. Other types have two colors, or only one color, such as all purple or all white.

These flowers also have five stamens and three pistils. Stamens are male floral organs. These organs contain pollen sacs, where pollen originates. The pistils are the female organs of the flower and are made up of the ovary, style and stigma.

Side view of many-petaled white flower with halo of purple filaments and prominent vertical structures in the middle.
The main characteristic of this climbing plant is its flowers. The base of the flower is made up of 10 petals. You can also see a crown of filaments and the 5 stamens and 3 pistils. Image via Attila Lisinszky/ Unsplash.

A delicious fruit

The passion flower produces a fruit called passion fruit. It is an oval or rounded fruit, between 1.5 and 4 inches (4 and 10 cm) in diameter, depending on the species. The outer part is covered by a thick and inedible shell. When ripe, the outside has a yellow, orange or purple color. The pulp, which is fibrous and juicy, is yellowish and contains numerous small, black seeds.

This fruit can be eaten fresh, with a spoon. However, with so many seeds, this is not an ideal way to eat it. For this reason, cooks have expanded their recipe books over time. Today, the passion fruit is mostly used to produce juice. Passion fruit is a common ingredient in desserts, and even in the preparation of teas, salads and vinaigrettes.

Cut-open round fruits with a purple rind and yellowish flesh with many tiny black seeds.
The passion flower produces a fruit called passion fruit. It looks oval or round. The outer part is covered by a thick and inedible shell. The pulp, which is fibrous and juicy, is yellowish and contains numerous small, black seeds. Image via Any Lane/ Pexels.

Origin of the plant

The genus Passiflora includes around 550 accepted species, although there are only about 50 varieties with edible fruits.

Most species are native to South America, although there are a few native to southern Asia, Australia and Oceania.

Plus, there are hybrids created naturally and those created by geneticists, which provide new shapes in their stems, leaves and in the color and size of their flowers and fruits. People are also seeking to improve the edible species, so the fruits have more weight, color, aroma and flavor. Thus, in total, there are about more than 1,000 described species.

Flower with 10 pink outer petals, some with a green border. Very many purple filaments and green structures in the center.
The genus Passiflora contains around 550 accepted species, but only about 50 varieties have an edible fruit. Image via Andrew Pons/ Unsplash.
Purple flower with wavy filaments and 10 petals. White structures in center, and twisty green tendrils in the background.
Most species of passion flower are native to South America. Image via Chaotic Toejam/ Unsplash.

Some types of passion flower

Below is Passiflora caerulea. It grows wild in several countries, such as Argentina, Bolivia, Brazil, Chile, Colombia, Ecuador, Paraguay, Peru, Uruguay and Venezuela in South America, Spain in Europe and the Dominican Republic in the Caribbean.

White flower with 10 petals and purple-white-blue striped filaments. Green leaves and buds in background.
Passiflora caerulea. Image via Franz van Duns/ Wikipedia (CC BY-SA 4.0).

Next is Passiflora edulis. It is a typical species of South America and Central America; specifically, it is considered native to Brazil.

Flower with white petals and long, wavy purple and white filaments and green central structures.
Passiflora edulis. Image via Wikipedia (public domain).

Here is Passiflora caerulea Constance Elliot. It is native to Mexico and the Caribbean. This plant can become invasive in some areas, but it is also food for the larvae of the Acraea andromacha butterfly.

10-petaled all-white flower with very many filaments and purple pistils and green stamens in the center.
Passiflora caerulea “Constance Elliot.” Image via Kelly Cookson/ Wikipedia (CC BY-SA 2.0).

The last species below is Passiflora vitifolia. It’s native to tropical areas such as Costa Rica, Nicaragua, Panama, Venezuela, Colombia, Ecuador, Peru and Bolivia. This plant serves as food for the larvae of the Heliconius cydno and Heliconius hecale butterflies.

All red flower. The crown of filaments is shorter and vertical. Big green leaves around the flower.
Passiflora vitifolia. Image via Density/ Wikipedia (CC BY-SA 2.5).

Bottom line: The passion flower plant is a gift for the senses. Its flowers are aromatic, abundant and colorful. And some types have an edible fruit. Plus, the structure of the flower is spectacular and unique.

Read more: Water lilies, beautiful and colorful: Lifeform of the week

Read more: Carnivorous plants are our lifeform of the week

The post The passion flower is our flamboyant lifeform of the week first appeared on EarthSky.


from EarthSky https://ift.tt/TCBU9Hm

Voyager 2: Our 1st and last visit to Neptune

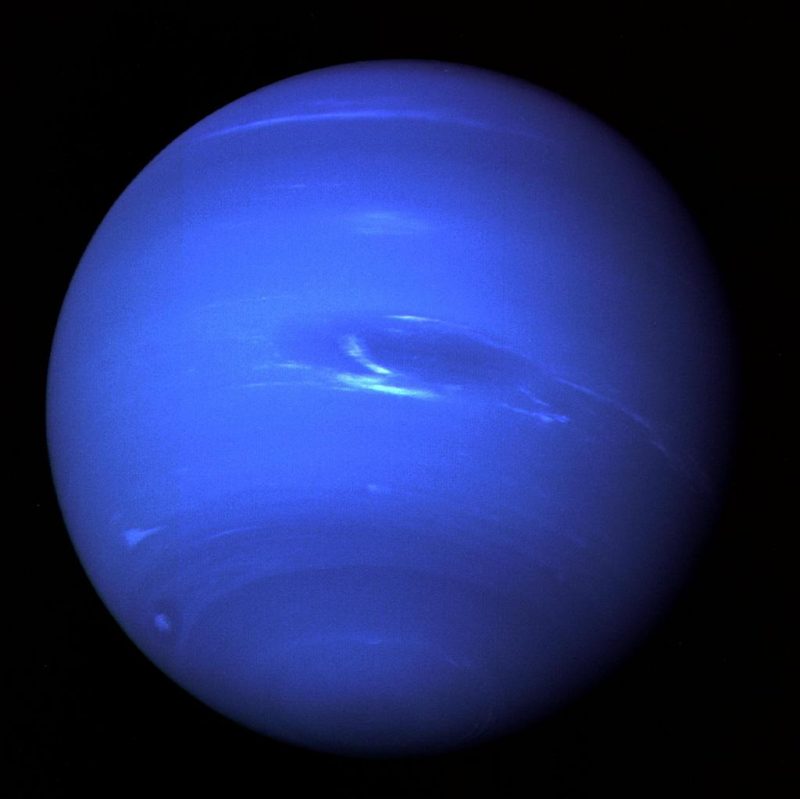
Voyager 2: Bright blue planet with oblong darker blue spot partly edged with light blue.
Voyager 2 acquired this image fewer than 5 days before its closest approach to Neptune on August 25, 1989. You can see Neptune’s Great Dark Spot – a storm in its atmosphere – and the bright, light-blue smudge of clouds that accompanies the storm. Image via NASA/ JPL-Caltech.

Reprinted from NASA.

Voyager 2 passes by Neptune, 35 years ago

Thirty-five years ago, on August 25, 1989, NASA’s Voyager 2 spacecraft made a close flyby of Neptune. It gave humanity its 1st close-up of our solar system’s 8th planet. It also marked the end of the Voyager mission’s Grand Tour of the solar system’s 4 giant planets, Jupiter, Saturn, Uranus and Neptune. No other spacecraft has visited Neptune since.

Ed Stone, a professor of physics at Caltech and Voyager’s project scientist since 1975, said:

The Voyager planetary program really was an opportunity to show the public what science is all about. Every day we learned something new.

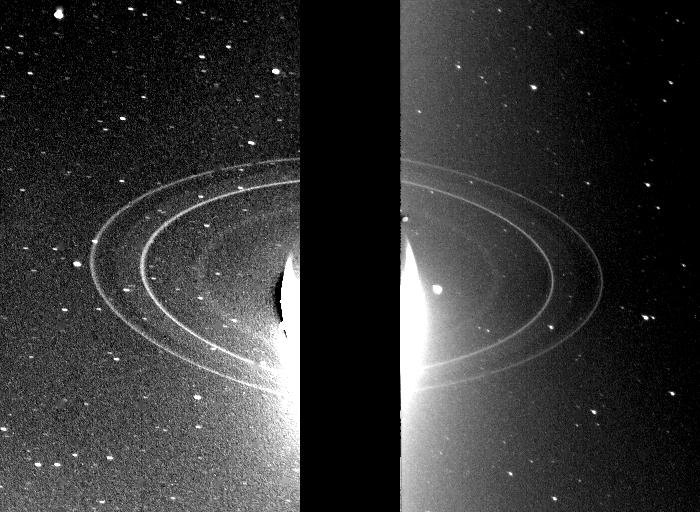
Wrapped in teal and cobalt-colored bands of clouds, the planet that Voyager 2 revealed looked like a blue-hued sibling to Jupiter and Saturn. The blue on Neptune indicates the presence of methane. A massive, slate-colored storm was dubbed the Great Dark Spot, similar to Jupiter’s Great Red Spot. Plus, Voyager 2 discovered six new moons and four rings.

A split image with the bright planet itself hidden by an obscuring bar, and the rings visible.
Voyager 2 took these 2 images of the rings of Neptune on August 26, 1989, just after closest approach. Neptune’s 2 main rings are clearly visible. And 2 fainter rings are visible with the help of long exposure times and backlighting from the sun. Image via NASA PhotoJournal.

Voyager 2 also visited Triton

During the encounter, the engineering team carefully changed the probe’s direction and speed so that it could do a close flyby of the planet’s largest moon, Triton. The flyby showed evidence of geologically young surfaces and active geysers spewing material skyward. This indicated that Triton was not simply a solid ball of ice even though it had the lowest surface temperature of any natural body observed by Voyager: -391 degrees Fahrenheit (-235 degrees Celsius).

Voyager 2 onward to interstellar space

The conclusion of the Neptune flyby marked the beginning of the Voyager Interstellar Mission. Forty-seven years after launch, Voyager 2 and its twin, Voyager 1 (which had also flown by Jupiter and Saturn), continue to send back dispatches from the outer reaches of our solar system. At the time of the Neptune encounter, Voyager 2 was about 2.9 billion miles (4.7 billion km) from Earth. Today it is 12.7 billion miles (20 billion km) from us. The faster-moving Voyager 1 is 15.2 billion miles (24 billion km) from Earth.

Getting there

By the time Voyager 2 reached Neptune, the Voyager mission team had completed five planetary encounters. But the big blue planet still posed unique challenges.

Neptune is about 30 times farther from the sun than Earth. So, the icy giant receives only about 0.001 times the amount of sunlight that Earth does. In such low light, Voyager 2’s camera required longer exposures to get quality images. But the spacecraft would reach a maximum speed of about 60,000 mph (90,000 kph) relative to Earth. So, a long exposure time would make the image blurry. (Imagine trying to take a picture of a roadside sign from the window of a speeding car.)

So the team programmed Voyager 2’s thrusters to fire gently during the close approach, thus rotating the spacecraft to keep the camera focused on its target without interrupting the spacecraft’s overall speed and direction.

Receiving the radio signals from Neptune

The probe’s distance meant by the time radio signals from Voyager 2 reached Earth, they were weaker than other flybys. But the spacecraft had the advantage of time. The Voyagers communicate with Earth via the Deep Space Network, or DSN, which utilizes several radio antennas. They are in Madrid, Spain; Canberra, Australia; and Goldstone, California. During Voyager 2’s Uranus encounter in 1986, the three largest DSN antennas were 64 meters (210 feet) wide. To assist with the Neptune encounter, the DSN expanded the dishes to 70 meters (230 feet). They also included nearby non-DSN antennas to collect data, including another 64-meter (210 feet) dish in Parkes, Australia. And multiple 25-meter (82 feet) antennas at the Very Large Array in New Mexico.

The effort ensured that engineers could hear Voyager loud and clear. It also increased how much data could reach Earth in a given period, thus enabling the spacecraft to send back more pictures from the flyby.

Being there

In the week leading up to that August 1989 close encounter, the atmosphere was electric at NASA’s Jet Propulsion Laboratory in Pasadena, California, which manages the Voyager mission. As images taken by Voyager 2 during its Neptune approach made the four-hour journey to Earth, Voyager team members would crowd around computer monitors around the Lab to see. Stone said:

One of the things that made the Voyager planetary encounters different from missions today is that there was no internet that would have allowed the whole team and the whole world to see the pictures at the same time. The images were available in real time at a limited number of locations.

But the team was committed to giving the public updates as quickly as possible. So from August 21 to August 29, they would share their discoveries with the world during daily press conferences. On August 24, a program called Voyager All Night broadcast regular updates from the probe’s closest encounter with the planet, which took place at 4 a.m. GMT (9 p.m. in California on August 24).

The next morning, Vice President Dan Quayle visited the lab to commend the Voyager team. That night, Chuck Berry, whose song Johnny B. Goode was included on the Golden Record that flew with both Voyagers, played at JPL’s celebration of the feat.

White-suited man with guitar next to gesturing man in tan suit, microphone in front of the pair.
Chuck Berry (l) and Carl Sagan (r) at a Voyager 2 Neptune flyby celebration in August 1989. Berry’s song Johnny B. Goode is the only rock ‘n’ roll song on the Golden Records currently traveling into interstellar space aboard Voyagers 1 and 2. Image via NASA.

Voyagers were successful and continue today

Of course, the Voyagers’ achievements extend far beyond that historic week over three decades ago. Both probes have now entered interstellar space after exiting the heliosphere, the protective bubble around the planets created by a high-speed flow of particles and magnetic fields spewed outward by our sun.

They are reporting back to Earth on the “weather” and conditions from this region filled with the debris from stars that exploded elsewhere in our galaxy. They have taken humanity’s first tenuous step into the cosmic ocean where no other operating probes have flown.

Voyager data also complement other missions, including NASA’s Interstellar Boundary Explorer (IBEX), which is remotely sensing that boundary where particles from our sun collide with material from the rest of the galaxy. And NASA is preparing the Interstellar Mapping and Acceleration Probe (IMAP), due to launch in 2025, to capitalize on Voyager observations.

The Voyagers send their findings back to DSN antennas with 13-watt transmitters, about enough power to run a refrigerator light bulb. Stone said:

Every day they travel somewhere that human probes have never been before. Years after launch, and they’re still exploring.

More information about the Voyager mission

More images of Neptune taken by Voyager 2

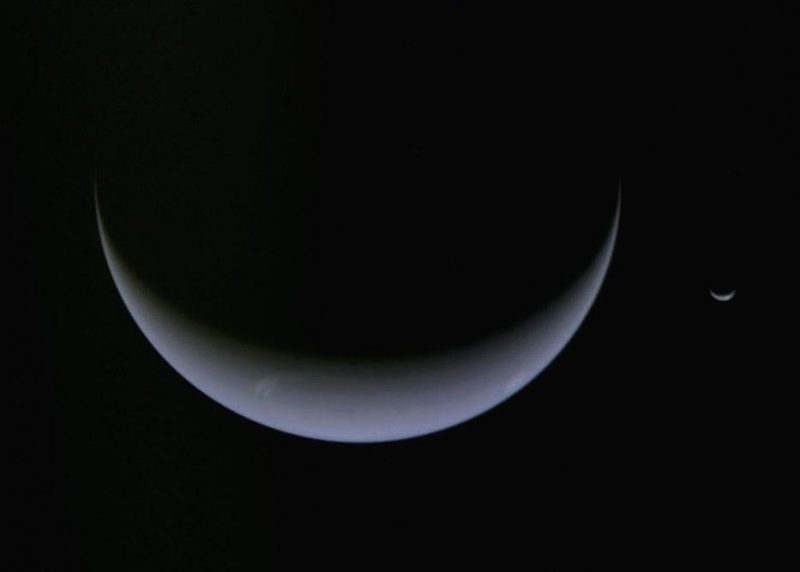
A large blue crescent Neptune, next to a tiny blue crescent Triton.
Neptune and its large moon Triton, via Voyager 2.

Bottom line: It has been 35 years since Voyager 2 visited Neptune as part of the Voyagers’ Grand Tour of our solar system’s four giant planets. As of today, no other earthly spacecraft has returned to Neptune.

Via NASA

Where is Voyager 2 going? And when will it get there?

Read more: Why are the Voyager spacecraft getting closer to Earth?

The post Voyager 2: Our 1st and last visit to Neptune first appeared on EarthSky.


from EarthSky https://ift.tt/JqUbKRZ

Polaris, the North Star, has spots on its surface

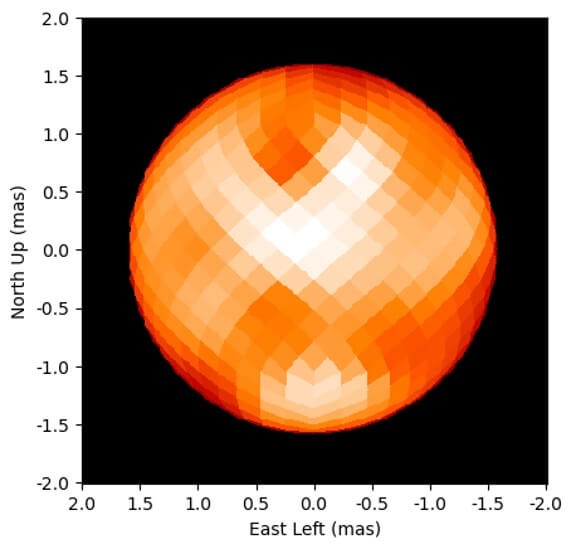
Pixelized orange sphere of the star Polaris show some light and dark areas.
Here’s a false color image from CHARA Array of Polaris – the North Star – from April 2021. It reveals large bright and dark spots on its surface. Polaris appears about 600,000 times smaller than the full moon in the sky. Image via CHARA/ Georgia State University/ National Science Foundation.
  • Polaris, the North Star, was the subject of observations by the CHARA Array in California.
  • Polaris is a variable star, and these observations were the first glimpse of what a Cepheid variable star’s surface looks like.
  • The most surprising finding was that Polaris has large bright and dark spots on its surface.

Georgia State University published this original story on August 20, 2024. Edits by EarthSky.

Polaris, the North Star, has spots on its surface

Researchers using Georgia State University’s Center for High Angular Resolution Astronomy (CHARA) Array have identified new details about the size and appearance of the North Star, also known as Polaris. The most remarkable finding was the large bright and dark spots on the star’s surface. The Astrophysical Journal published the new peer-reviewed research on August 20, 2024.

The North Star is a variable star

Earth’s North Pole points to a direction in space marked by the North Star. Polaris is both a navigation aid and a remarkable star in its own right. It is the brightest member of a triple-star system and is a pulsating variable star. Polaris gets brighter and fainter periodically as the star’s diameter grows and shrinks over a four-day cycle.

Polaris is a kind of star known as a Cepheid variable. Astronomers use these stars as “standard candles,” because their true brightness depends on their period of pulsation. Brighter stars pulsate slower than fainter stars. How bright a star appears in the sky depends on the star’s true brightness and the distance to the star. Because we know the true brightness of a Cepheid based on its pulsational period, astronomers can use them to measure the distances to their host galaxies and to infer the expansion rate of the universe.

Studying Polaris

A team of astronomers led by Nancy Evans at the Center for Astrophysics | Harvard & Smithsonian observed Polaris using the CHARA optical interferometric array of six telescopes at Mount Wilson, California. The goal of the investigation was to map the orbit of the close, faint companion that orbits Polaris every 30 years. Evans said:

The small separation and large contrast in brightness between the two stars makes it extremely challenging to resolve the binary system during their closest approach.

The CHARA Array combines the light of six telescopes that are spread across the mountaintop at the historic Mount Wilson Observatory. By combining the light, the CHARA Array acted like a 330-meter telescope to detect the faint companion as it passed close to Polaris. The observations of Polaris were recorded using the MIRC-X camera, which was built by astronomers at the University of Michigan and Exeter University in the U.K. The MIRC-X camera has the remarkable ability to capture details of stellar surfaces.

The team successfully tracked the orbit of the close companion and measured changes in the size of the Cepheid as it pulsated. The orbital motion showed that Polaris has a mass five times larger than that of the sun. The images of Polaris showed that it has a diameter 46 times the size of the sun.

Surprising view of its surface

The biggest surprise was the appearance of Polaris in closeup images. The CHARA observations provided the first glimpse of what the surface of a Cepheid variable looks like.

Gail Schaefer, director of the CHARA Array, said:

The CHARA images revealed large bright and dark spots on the surface of Polaris that changed over time.

The presence of spots and the rotation of the star might be linked to a 120-day variation in measured velocity. John Monnier, an astronomy professor at the University of Michigan, said:

We plan to continue imaging Polaris in the future. We hope to better understand the mechanism that generates the spots on the surface of Polaris.

The CHARA Array

The new observations of Polaris were made and recorded as part of the open access program at the CHARA Array, where astronomers from around the world can apply for time through the National Optical-Infrared Astronomy Research Laboratory (NOIRLab).

Generated aerial view of the CHARA Array showing telescopes and buildings.
The CHARA Array is located at the Mount Wilson Observatory in the San Gabriel Mountains of southern California. The 6 telescopes of the CHARA Array are arranged along 3 arms. The light from each telescope is transported through vacuum pipes to the central beam-combining lab. All the beams converge on the MIRC-X camera in the lab. Image via Georgia State University.

The CHARA Array open access program is funded by the National Science Foundation (grant AST-2034336). Institutional support for the CHARA Array is provided by Georgia State’s College of Arts & Sciences and the Office of the Vice President for Research and Economic Development.

Bottom line: Observations of Polaris, the North Star, show it has large bright and dark spots on its surface. It’s the first glimpse of what the surface of a Cepheid variable looks like.

Source: The Orbit and Dynamical Mass of Polaris: Observations with the CHARA Array

Via Georgia State University

The post Polaris, the North Star, has spots on its surface first appeared on EarthSky.


from EarthSky https://ift.tt/mluLYQ9

Understanding extreme weather with Davide Faranda


Join us LIVE at 12:15 p.m. CDT (17:15 UTC) Monday, August 26, 2024, for a YouTube chat on extreme weather events with climatologist Davide Faranda!

Extreme weather LIVE chat with Davide Faranda

Join us at 12:15 p.m. central (17:15 UTC) on Monday as we talk about dangerous and sometimes deadly weather extremes with climatologist Davide Faranda. He is research director in climate physics in the Laboratoire de Science du Climat et de l’Environnement in France. He’s an expert on cold spells, heatwaves, cyclones and severe thunderstorms.

Faranda’s expertise focuses on how extreme weather events may be linked to overall warming on Earth. He wants to understand how much greenhouse gasses influence the occurrence of these extremes. And he demonstrates event-by-event findings at the website ClimaMeter.org.

Extreme weather: Man in office posing for camera. Laptop computer on desk.
Dr. Davide Faranda is the research director in climate physics in the Laboratoire de Science du Climat et de l’Environnement (LSCE) of the Institut Pierre-Simon Laplace at the French National Center for Scientific Research (CNRS). At LSCE, Davide coordinates the group ESTIMR, which works at understanding climate extremes from a statistical and dynamical point of view. He is also an external fellow of the London Mathematical Laboratory, and of the Laboratoire de Météorologie Dynamique de l’École Normale Supérieure in Paris. Image via Davide Faranda.

Bottom line: Join us at 12:15 p.m. central (17:15 UTC) on Monday, August 26, for a LIVE YouTube chat with climatologist Davide Faranda.

The post Understanding extreme weather with Davide Faranda first appeared on EarthSky.


from EarthSky https://ift.tt/z3EutvU

Air pollution increases thunderstorm danger

Lightning streaks from the sky to the ground, where there are many high buildings. The buildings are both illuminated by their yellow windows and the lighning strikes, also reflected in the water.
View at EarthSky Community Photos. | Alexander Krivenyshev from Manhattan, New York, caught a thunderstorm on June 26, 2024. He wrote: “Multiple lightning strikes were seen shooting across the Manhattan skyline during severe thunderstorm on June 26 (single photo).” Thank you, Alexander. Research now suggests that air pollution can help create stronger thunderstorms.
  • Air pollution is making thunderstorms more lightning-prone, according to researchers at James Madison University.
  • Tiny particles of pollution act as cloud nuclei. That’s part of the process by which, ultimately, more pollution particles increase the number of lightning strikes.
  • Scientists studied 500,000 thunderstorms in the U.S. over three years to be able to drawn these conclusions. Now they are studying storms over Bangkok and getting similar results, suggesting this is a global phenomenon.

James Madison University originally posted this story on August 19, 2024. Edits by EarthSky.

Researchers at James Madison University in Harrisonburg, Virginia, reported on August 19, 2024, that air pollution is increasing the severity of summertime thunderstorms. That’s according to their new study, which examined a correlation between air pollution and thunderstorms in two large U.S. cities. The study is published in the peer-reviewed journal Atmospheric Research.

JMU geography professor Mace Bentley is lead author of the study. He explained:

Pollution acts as cloud nuclei. It’s brought into the cloud through the updraft. The updraft and downdraft then separate the pollution particles, which divides the electrical charges in the cloud and leads to more lightning production.

The three-year study, funded by the National Science Foundation, examined nearly 200,000 thunderstorms in the Washington, D.C., area and more than 300,000 in the Kansas City area.

Air pollution data from 2 cities

The scientists used 12 years of lightning data from the National Lightning Detection Network, combined with data from hundreds of air pollution stations in the two cities. They were able to determine that – in environments with high instability – adding more pollution increases cloud-to-ground lightning strikes, Bentley said.

Bentley is now doing similar research on Bangkok, the capital of Thailand. It’s a megacity with more pollution than Washington, D.C. or Kansas City. Bangkok is also located in a hot, tropical climate. His results so far are similar, albeit with lightning rates even higher in those storms than in the two U.S. cities studied. Bentley commented:

It looks like no matter where you go in the world, urban pollution is capable of enhancing thunderstorms and lightning.

Kindly-looking middle aged man, who studies air pollution, sitting behind desk.
Mace Bentley is a geographer who has teaching and research interests in weather-societal interactions. He holds a doctorate in geography from the University of Georgia and was a forecast meteorologist at The Weather Channel in Atlanta. Image via James Madison University.

Bottom line: Researchers studying thunderstorms in urban areas found that air pollution leads to more cloud-to-ground lightning strikes.

Source: Toward untangling thunderstorm-aerosol relationships: An observational study of regions centered on Washington, DC and Kansas City, MO

Via JMU

The post Air pollution increases thunderstorm danger first appeared on EarthSky.


from EarthSky https://ift.tt/UJ9cSAk

Mars mission sending inexpensive satellites to red planet

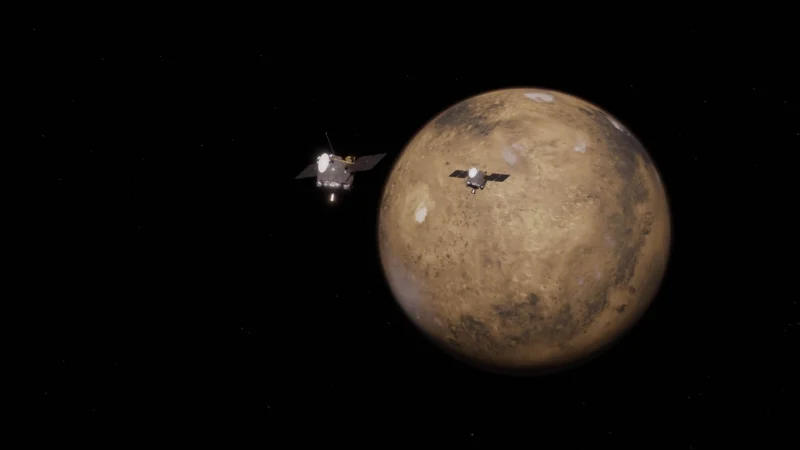
Mars mission: Two metallic cubes with solar panel "wings" fly in front of the sphere of Mars on a black background.
An artist’s concept shows Blue and Gold, the twin satellites launching as soon as October 2024 for their Mars mission. They built the probes on a shoestring budget to see if it could be done, and they will study Mars hybrid magnetosphere. The satellites will take 11 months to reach the red planet. Image via NASA.

Mars mission will study hybrid magnetosphere on the cheap

A new, cost-effective Mars mission will soon be its way to the red planet. A pair of small satellites will fly into Earth orbit no earlier than October 2024. The twin satellites, called Blue and Gold, were built to study the workings of Mars’ unique hybrid magnetosphere. They’ll be going on an 11-month journey to Mars.

The 5-month mission at the red planet – the Escape and Plasma Acceleration and Dynamics Explorers (ESCAPADE) – represents a proof-of-concept. NASA and its partners want to find out if they can study the solar system without breaking the bank. ESCAPADE relies on new spaceflight technology to keep costs down, mission leader Robert Lillis previously said in a talk with UC Berkeley News:

ESCAPADE and two other NASA missions recently approved are experiments to see whether advances in the space industry over the last five to 10 years can translate to a much better bang for the buck in terms of science per dollar. Sending two spacecraft to Mars for the total cost of under $80 million is just unheard of, but current NASA leadership is taking the risk.

The risk is a mission failure. But at 10% the cost, NASA figures it can afford to roll the dice. Lillis put it this way:

Instead of spending $800 million for a 95% chance of success, can we spend $80 million for an 80% chance? This is what NASA is trying to find out with these missions, and we are lucky to be one of the guinea pigs.

Going for the Gold and Blue on Mars

Lillis is also the University of California, Berkeley Space Sciences Laboratory (SSL) associate director for planetary science and astrobiology. The SSL – working in conjunction with the NASA’s Goddard Space Flight Center – engineered the twin probes. In managing the mission, the SSL will run the onboard instruments and process the data. It’s also flying the craft.

And so that’s why the satellites are named Gold and Blue. They’re the official Berkeley colors. Sending two satellites to scan the same terrain will give ESCAPADE’s data an added dimension, Lillis said:

With simultaneous two-point observations of the solar wind and Mars’ ionosphere and magnetosphere, ESCAPADE will bring us the first stereo picture of this highly dynamic plasma environment.

Figuring out how Mars gets electrically charged

The Mars mission aims to track the internal workings of the planet’s magnetosphere. They want to know how energy and matter from the solar wind makes its way in and out of Mars’ planetwide magnetic field. The field is unlike those on other planets. It is a hybrid of a solar-induced magnetosphere like that on Venus, with contributions from magnetic fields on its surface. Plus there’s larger-scale global influences.

NASA described the mission goals for probes:

ESCAPADE will analyze how Mars’ magnetic field guides particle flows around the planet, how energy and momentum are transported from the solar wind through the magnetosphere and what processes control the flow of energy and matter into and out of the Martian atmosphere.

ESCAPADE is part of the NASA Small Innovative Missions for Planetary Exploration (SIMPLEx) program. The spacecraft is relatively small, with a mass under 200 pounds (90 kg). Onboard are a magnetometer, an electrostatic analyzer to measure superthermal ions and electrons and a plasma density probe.

The end of the mission is planned for March 2027.

Bottom line: The Mars mission ESCAPADE will study the red planet’s magnetosphere using a pair of small satellites. ESCAPADE will launch no earlier than October 2024.

Read more: Mars in 2024: Find it in the morning sky

The post Mars mission sending inexpensive satellites to red planet first appeared on EarthSky.


from EarthSky https://ift.tt/i41SGI6

Super-marine heatwaves describe record high sea temps

Super-Marine Heatwave: Bands of clear sky and clouds at sunset over rippling water in wide panorama.
2023 saw record surface sea temperatures. A new study provides insight on the phenomenon, which scientists are now calling super-marine heatwaves. Image of the Celebes Sea south of the Philippine Island via NOAA Okeanos Explorer Program, INDEX-SATAL 2010.
  • Earth’s sea surface reached record high temperatures in 2023, making it the hottest year yet recorded for oceans.
  • Scientists noticed exceptionally strong ocean heatwaves that year. They’ve now coined a new term for them: “super-marine heatwaves.”
  • These super-marine heatwaves may harm ocean life and make hurricanes stronger.

The NOAA National Center for Environmental Information originally published this story on August 13, 2024. Edits by EarthSky.

2023’s record sea surface temps

2023 was a record-breaking year for heat.

According to the Annual 2023 Global Climate Report, 2023 was the warmest year since global atmospheric temperature record-keeping began in 1850. Overall, the year was 1.18 degrees Celsius (2.12 Fahrenheit) above the 20th-century average of 13.9 C (57.0 F). Now, a new analysis led by scientists at the National Centers for Environmental Information (NCEI) shows that global mean sea surface temperatures also set a record high in 2023. The study further indicates that these record-breaking temperatures were associated with extremely strong marine heatwaves.

These heatwaves were so noticeable and so different that the authors gave them the name super-marine heatwaves.

Scientists published the new study in Geophysical Research Letters.

Decades of data tell the tale of warming seas

Sea surface temperature is the temperature of the uppermost layer of seawater, typically the top few meters. Sea surface temperature data are collected via satellite observations or via in situ observations from ships, drifting buoys, moored buoys, and more recently, surface autonomous vehicles such as saildrones.

NCEI’s Daily Optimum Interpolation Sea Surface Temperature (DOISST) is a global record, tabulated daily, and including data from September 1981 onwards. It blends satellite data on sea surface temperatures with in situ data from ships, buoys, and Argo floats.

The analysis of this record shows that – globally, from latitude 90°S to 90°N – averaged daily sea surface temperatures started breaking historical seasonal record highs in March 2023. Records continued to break until early summer 2024. An all-time record high was set on April 4, 2023 (18.83 C). This record was continually broken from July 16 until August 21, 2023 (19.00 C).

Overall, the analysis showed that the sea surface temperatures in 2023 reached record highs over much of the global oceans.

The new study shows that the 2023 record-high sea surface anomaly is attributed to a long-term warming trend associated with increasing greenhouse gases, a shift to the warm phase of a multidecadal Pacific-Atlantic-Arctic mode, and a warming associated with the transition from 2020–2023 La Niña events to the 2023–2024 El Niño event.

Super-Marine Heatwave: Three side-by-side images of whirling clouds colored to indicate wind speed.
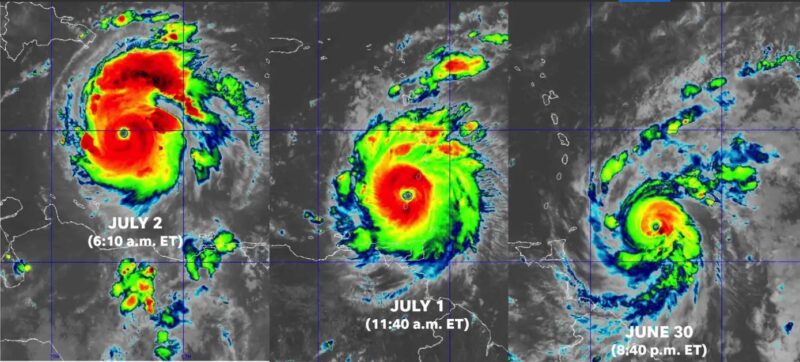
Hurricane Beryl (June 28–July 11, 2024) was the earliest-forming Category 5 hurricane on record. Beryl’s development was fueled by record-breaking ocean surface temperatures. Image via NOAA NESDIS.

Super-marine heatwaves: So noticeable it earned a name

Boyin Huang, NCEI Oceanographer and lead author of the paper, described why the long-term warming and the natural change in the PAA is of concern:

The impact of the first two factors suggests high sea surface temperatures into the future, particularly in the Northern Hemisphere summer.

The paper also indicates that these record-breaking sea surface temperatures were extremely strong marine heatwaves. The marine heatwaves were so powerful that the authors came up with a new term for them: super-marine heatwaves.

Marine heatwaves usually describe any time when the ocean temperature is above the 90th percentile for five or more days in a row, with gaps of less than three days. This means that the temperatures are warmer than 90% of the previous observations for a given time of year.

In 2023, Marine heatwaves were so extreme that the paper’s authors coined the term “super-MHW” to describe when the daily SST in 2023 exceeded the corresponding maximum daily sea surface temperature from the period of 1982–2022. These super-marine heatwaves occurred across the globe, including in the Arctic region.

Super-marine heatwaves and record high temps

Marine heatwaves can have significant impacts on ocean life including fisheries collapse and coral deaths. They can occur all over the world, including in the Arctic zone. The authors of the paper documented super-marine heatwaves occurring in the central tropical Pacific near the dateline (0.1 C – 0.2 C), the eastern tropical Pacific east of 120°W (0.1 C – 0.5 C), the North Pacific north of 30°N (0.2 C – 1.0 C), the northern tropical Atlantic between the equator and 30°N (0.2 C – 0.5 C), the northwestern North Atlantic south of Greenland (0.5 C), the Arctic coastal zone (0.5 C – 2.0 C), the western Indian Ocean west of 90°E (0.2 C – 1.0 C), and the Southern Ocean (0.2 C – 1.0 C). MHWs affect the biology and chemistry of an ecosystem.

There are many impacts to the Earth’s climate systems associated with the record-breaking ocean surface temperature, one of them being the increased strength and rapid intensification of hurricanes, as warm waters provide fuel to the storms.

Corresponding with the record-breaking ocean surface temperature in 2024 was the earliest Category 5 hurricane on record, Hurricane Beryl. It intensified in a very short time from a tropical storm to a Category 5 hurricane.

Bottom line: Super-marine heatwaves – extremely strong periods of hot weather at sea – played a role in 2023’s record high sea surface temperatures according to NOAA research published in July 2024.

Read more: Heatwaves: How animals adapt to cope with them

Source: Record High Sea Surface Temperatures in 2023

Via National Centers for Environmental Information

The post Super-marine heatwaves describe record high sea temps first appeared on EarthSky.


from EarthSky https://ift.tt/MbKdGCT