Gaia spots over 350 asteroids with possible moons

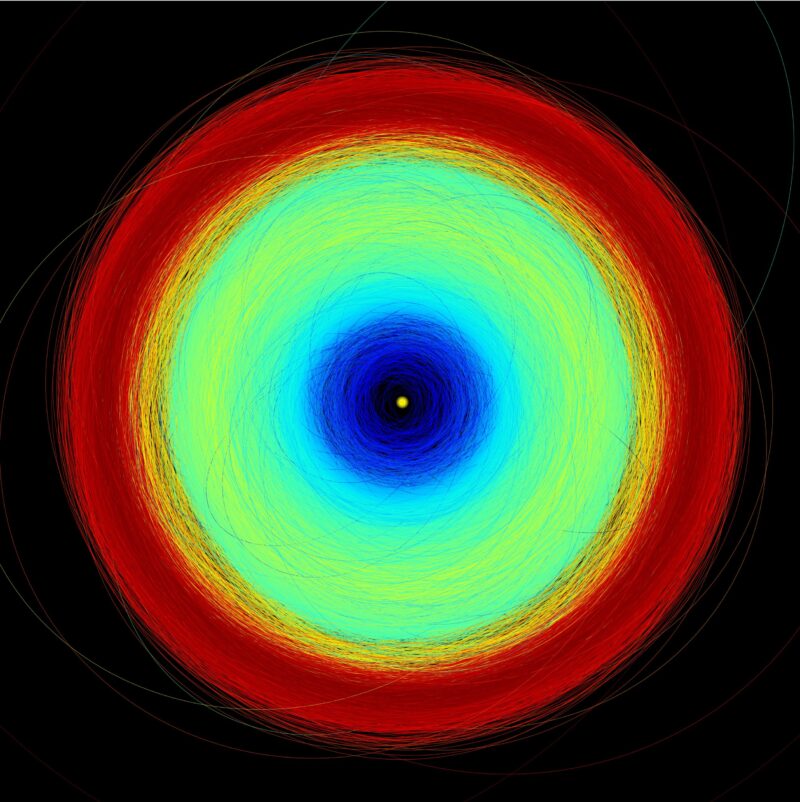
Asteroids with possible moons: Decreasing circles with red outside changing to dark blue inside and a dot in the middle.
Here are the orbits of the more than 150,000 asteroids. Among these, Gaia data identified hundreds of asteroids with possible moons in its 3rd data release. The yellow circle is the sun. Blue is the inner solar system, where the near-Earth asteroids, Mars crossers, and terrestrial planets are. The main belt – between Mars and Jupter – is green. Jupiter trojans are red. Image via ESA/ Gaia/ DPAC/ CC BY-SA 3.0 IGO. Acknowledgements: P. Tanga (Observatoire de la Côte d’Azur).
  • The Gaia mission’s 3rd data release has revealed the precise orbits of more than 150,000 asteroids.
  • Among these, hundreds of asteroids showed a wobble in their orbit that could indicate a possible moon.
  • If the moons are confirmed, it would nearly double the number of known binary asteroids.

ESA published this original article on August 8, 2024. Edits by EarthSky.

Gaia spots hundreds of asteroids with possible moons

ESA’s star-surveying Gaia mission has again proven to be a formidable asteroid explorer. It has spotted potential moons around more than 350 asteroids not known to have a companion. Previously, Gaia had explored asteroids known to have moons – so-called binary asteroids – and confirmed that the telltale signs of these tiny moons show up in the telescope’s ultra-accurate astrometric data. But this new finding proves that Gaia can conduct “blind” searches to discover completely new candidates, too.

Luana Liberato of Observatoire de la Côte d’Azur, France, is the lead author of the new study. Liberato said:

Binary asteroids are difficult to find as they are mostly so small and far away from us. Despite us expecting just under 1/6 of asteroids to have a companion, so far we have only found 500 of the millions of known asteroids to be in binary systems. But this discovery shows that there are many asteroid moons out there just waiting to be found.

If confirmed, this new finding adds 352 more binary candidates to the tally, nearly doubling the known number of asteroids with moons.
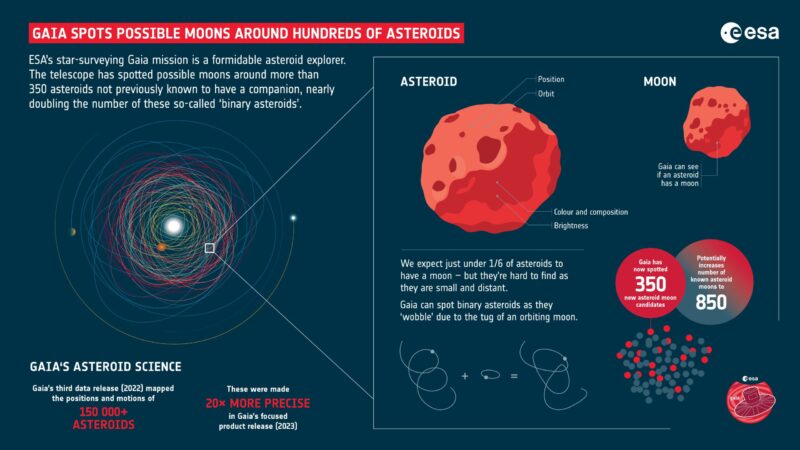
Art graphic with circles around the sun at left and close up on some asteroids on right with text.
View larger. | Gaia has spotted potential moons around more than 350 asteroids not known to have a companion. This new finding proves the mission can conduct “blind” searches to discover completely new candidates. If confirmed, this new finding adds 352 more binary candidates to the tally, nearly doubling the known number of asteroids with moons. Image via ESA/ CC BY-SA 3.0 IGO.

Asteroid discoveries

Asteroids are fascinating objects. And they hold unique insights into the formation and evolution of the solar system. Binaries are even more exciting, enabling us to study how different bodies form, collide and interact in space.

Thanks to its unique all-sky scanning capabilities, Gaia has made a number of important asteroid discoveries since its launch in 2013.

In its data release 3, Gaia precisely pinpointed the positions and motions of 150,000-plus asteroids. In fact, its observations are so precise that scientists could dig deeper and hunt for asteroids displaying the characteristic “wobble” caused by the tug of an orbiting companion. (It’s the same mechanism as displayed here for a binary star.) Gaia also gathered data on asteroid chemistry, compiling the largest ever collection of asteroid reflectance spectra (light curves that reveal an object’s color and composition).

The 150,000-plus orbits determined in Gaia’s data release 3 were refined and made 20 times more precise. This advancement was part of the mission’s Focused Product Release last year. Astronomers anticipate even more asteroid orbits as part of Gaia’s forthcoming data release 4 (expected not before mid-2026).

Timo Prusti, Project Scientist for Gaia at ESA, said:

Gaia has proven to be an outstanding asteroid explorer and is hard at work revealing the secrets of the cosmos both within and beyond the solar system. This finding highlights how each Gaia data release is a major step up in data quality and demonstrates the amazing new science made possible by the mission.
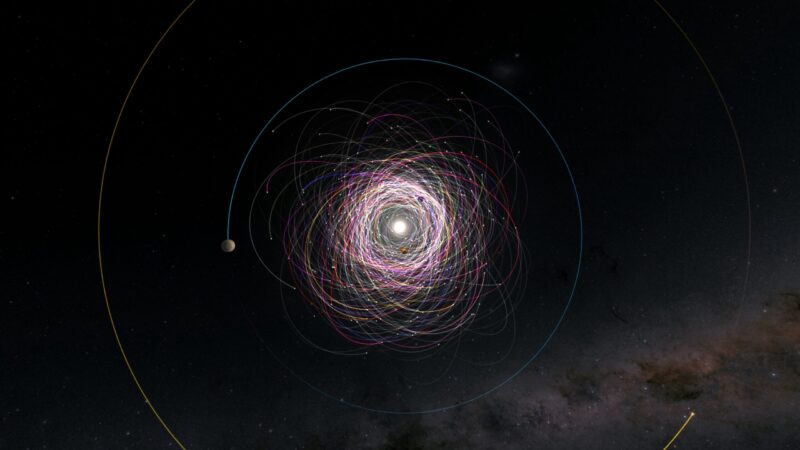
A bunch of elliptical paths around a central white object and small dots on paths.
Using Gaia observations, scientists have pinpointed the positions of 156,823 asteroid orbits, making them 20 times more precise. The wider blue and yellow circles in the frame show planetary orbits, while the myriad colorful inner swirls are asteroids. The central region all lies within the orbit of Jupiter (blue circle). Image via ESA/ Gaia/ DPAC/ CC BY-SA 3.0 IGO.

Hera mission to asteroids

ESA will further explore binary asteroids via the forthcoming Hera mission. Hera is due to launch later this year. Hera will follow up on NASA’s DART mission to produce a post-impact survey of Dimorphos. DART collided with Dimorphos, a moonlet orbiting the asteroid Didymos, in 2022 as an asteroid deflection test. Hera will be the first probe to rendezvous with a binary asteroid system.

Gaia helped astronomers view the shadow cast by Didymos as it passed in front of more distant stars in 2022. This is an observing technique known as stellar occultation.
Gaia’s asteroid orbits and ultra-precise star maps have drastically increased the feasibility of this technique in recent years. And that proves the mission’s immense value for solar system exploration.

Bottom line: The Gaia mission’s 3rd release of data has revealed precise orbits of more than 150,000 asteroids. This has allowed astronomers to look for small wobbles in the asteroids’ orbits, indicating the possible presence of moons.

Via ESA

The post Gaia spots over 350 asteroids with possible moons first appeared on EarthSky.


from EarthSky https://ift.tt/DY9VTS8
Asteroids with possible moons: Decreasing circles with red outside changing to dark blue inside and a dot in the middle.
Here are the orbits of the more than 150,000 asteroids. Among these, Gaia data identified hundreds of asteroids with possible moons in its 3rd data release. The yellow circle is the sun. Blue is the inner solar system, where the near-Earth asteroids, Mars crossers, and terrestrial planets are. The main belt – between Mars and Jupter – is green. Jupiter trojans are red. Image via ESA/ Gaia/ DPAC/ CC BY-SA 3.0 IGO. Acknowledgements: P. Tanga (Observatoire de la Côte d’Azur).
  • The Gaia mission’s 3rd data release has revealed the precise orbits of more than 150,000 asteroids.
  • Among these, hundreds of asteroids showed a wobble in their orbit that could indicate a possible moon.
  • If the moons are confirmed, it would nearly double the number of known binary asteroids.

ESA published this original article on August 8, 2024. Edits by EarthSky.

Gaia spots hundreds of asteroids with possible moons

ESA’s star-surveying Gaia mission has again proven to be a formidable asteroid explorer. It has spotted potential moons around more than 350 asteroids not known to have a companion. Previously, Gaia had explored asteroids known to have moons – so-called binary asteroids – and confirmed that the telltale signs of these tiny moons show up in the telescope’s ultra-accurate astrometric data. But this new finding proves that Gaia can conduct “blind” searches to discover completely new candidates, too.

Luana Liberato of Observatoire de la Côte d’Azur, France, is the lead author of the new study. Liberato said:

Binary asteroids are difficult to find as they are mostly so small and far away from us. Despite us expecting just under 1/6 of asteroids to have a companion, so far we have only found 500 of the millions of known asteroids to be in binary systems. But this discovery shows that there are many asteroid moons out there just waiting to be found.

If confirmed, this new finding adds 352 more binary candidates to the tally, nearly doubling the known number of asteroids with moons.

Art graphic with circles around the sun at left and close up on some asteroids on right with text.
View larger. | Gaia has spotted potential moons around more than 350 asteroids not known to have a companion. This new finding proves the mission can conduct “blind” searches to discover completely new candidates. If confirmed, this new finding adds 352 more binary candidates to the tally, nearly doubling the known number of asteroids with moons. Image via ESA/ CC BY-SA 3.0 IGO.

Asteroid discoveries

Asteroids are fascinating objects. And they hold unique insights into the formation and evolution of the solar system. Binaries are even more exciting, enabling us to study how different bodies form, collide and interact in space.

Thanks to its unique all-sky scanning capabilities, Gaia has made a number of important asteroid discoveries since its launch in 2013.

In its data release 3, Gaia precisely pinpointed the positions and motions of 150,000-plus asteroids. In fact, its observations are so precise that scientists could dig deeper and hunt for asteroids displaying the characteristic “wobble” caused by the tug of an orbiting companion. (It’s the same mechanism as displayed here for a binary star.) Gaia also gathered data on asteroid chemistry, compiling the largest ever collection of asteroid reflectance spectra (light curves that reveal an object’s color and composition).

The 150,000-plus orbits determined in Gaia’s data release 3 were refined and made 20 times more precise. This advancement was part of the mission’s Focused Product Release last year. Astronomers anticipate even more asteroid orbits as part of Gaia’s forthcoming data release 4 (expected not before mid-2026).

Timo Prusti, Project Scientist for Gaia at ESA, said:

Gaia has proven to be an outstanding asteroid explorer and is hard at work revealing the secrets of the cosmos both within and beyond the solar system. This finding highlights how each Gaia data release is a major step up in data quality and demonstrates the amazing new science made possible by the mission.

A bunch of elliptical paths around a central white object and small dots on paths.
Using Gaia observations, scientists have pinpointed the positions of 156,823 asteroid orbits, making them 20 times more precise. The wider blue and yellow circles in the frame show planetary orbits, while the myriad colorful inner swirls are asteroids. The central region all lies within the orbit of Jupiter (blue circle). Image via ESA/ Gaia/ DPAC/ CC BY-SA 3.0 IGO.

Hera mission to asteroids

ESA will further explore binary asteroids via the forthcoming Hera mission. Hera is due to launch later this year. Hera will follow up on NASA’s DART mission to produce a post-impact survey of Dimorphos. DART collided with Dimorphos, a moonlet orbiting the asteroid Didymos, in 2022 as an asteroid deflection test. Hera will be the first probe to rendezvous with a binary asteroid system.

Gaia helped astronomers view the shadow cast by Didymos as it passed in front of more distant stars in 2022. This is an observing technique known as stellar occultation.
Gaia’s asteroid orbits and ultra-precise star maps have drastically increased the feasibility of this technique in recent years. And that proves the mission’s immense value for solar system exploration.

Bottom line: The Gaia mission’s 3rd release of data has revealed precise orbits of more than 150,000 asteroids. This has allowed astronomers to look for small wobbles in the asteroids’ orbits, indicating the possible presence of moons.

Via ESA

The post Gaia spots over 350 asteroids with possible moons first appeared on EarthSky.


from EarthSky https://ift.tt/DY9VTS8

Was the moon’s thin atmosphere created by meteorites?

Moon's thin atmosphere: Gray-brown rocky sphere with dark smooth areas and many craters, on black background.
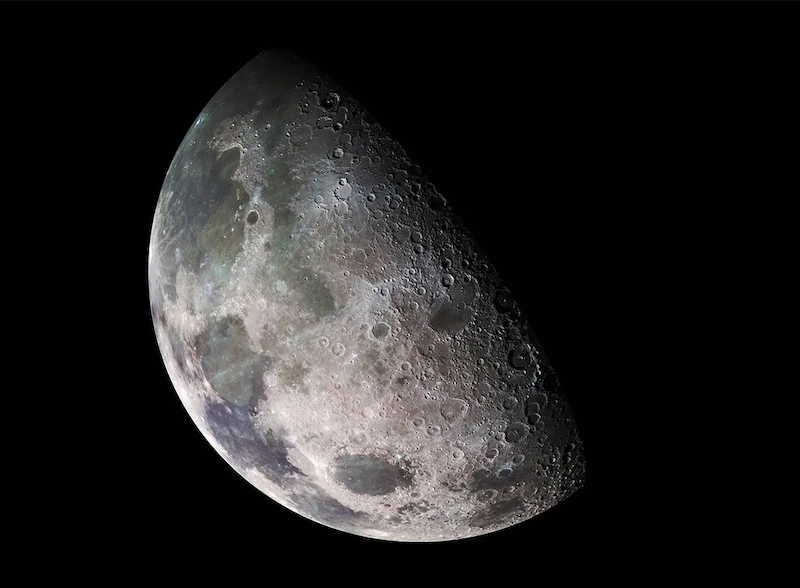
View larger. | NASA’s Galileo spacecraft captured this detailed view of the moon on December 7, 1992, while on its way to Jupiter. A new study shows meteorite impacts are primarily responsible for the moon’s thin atmosphere. Image via NASA/ JPL/ USGS/ NASA Photojournal.
  • The moon has a thin atmosphere. It is so tenuous it is measured in individual atoms rather than as “air” like on Earth.
  • Meteorite impacts create most of the moon’s atmosphere, a new study of soil samples brought back by the Apollo missions says.
  • Meteorites hit the surface and kick up dust in a process called impact vaporization, creating the majority of the atmosphere.

Was the moon’s thin atmosphere created by meteorites?

It may not seem like it, but the moon does have an atmosphere, albeit an extremely thin one. Scientists have been trying to figure out how it got there for several decades. Now, a new study from researchers at the University of Chicago and Massachusetts Institute of Technology (MIT) may have finally solved the mystery. The researchers said on August 2, 2024, the moon’s tenuous atmosphere is primarily the result of impacts from small meteorites.

The research team published their peer-reviewed findings in Science Advances on August 2, 2024.

Puzzle of the moon’s thin atmosphere

The atmosphere on the moon is extremely tenuous. In fact, it is so thin that it is measured in terms of individual atoms, rather than as “air” like on Earth. It’s surprising those atoms even hang around as much as they do. They tend to either fall back to the surface or escape into space. So the fact that they’re consistently present means they’re being replenished somehow. That’s been the mystery up until now.

Scientists have had two main hypotheses that both involve lunar dust. In the first one, meteorites hit the surface and kick up dust. This is called impact vaporization. The second hypothesis is similar, but involves the solar wind – the flow of charged particles from the sun – instead of meteorites. The atoms that form the sort-of atmosphere are in the dust. Both processes are a form of space weathering. So which is correct? The answer is both. However, most of the atmosphere, by far, is created by meteorite impacts.

Atmospheric reconnaissance with LADEE

NASA’s LADEE (Lunar Atmosphere and Dust Environment Explorer) orbiter studied the moon’s thin atmosphere in 2013. Those results suggested both meteorites and the solar wind might be responsible. But there was still some confusion. Nicole Nie, formerly at the University of Chicago and now an assistant professor at MIT, led the research team. Nie said:

Based on LADEE’s data, it seemed both processes are playing a role. For instance, it showed that during meteorite showers, you see more atoms in the atmosphere, meaning impacts have an effect. But it also showed that when the moon is shielded from the sun, such as during an eclipse, there are also changes in the atmosphere’s atoms, meaning the sun also has an impact. So, the results were not clear or quantitative.

Apollo soil samples provide an answer

The solution came from a new study of 10 soil samples brought back to Earth by the Apollo missions. Co-author and professor Nicolas Dauphas at the University of Chicago said:

It turns out the answer to this longstanding question was right in front of us, preserved in lunar soil brought back to Earth by the Apollo missions.

The researchers studied two elements in particular: potassium and rubidium. They examined the isotopes – the natural mass variance – of the elements. Both meteorite impacts and the solar wind can affect those variations. But they do so slightly differently. Meteorite impacts will disrupt atoms more that have heavier isotopes. But the solar wind will more greatly affect atoms with lighter isotopes. It can kick those atoms away from the moon and out into space. By comparing the abundances of heavier and lighter isotopes, scientists can determine whether meteorite impacts or the solar wind has a greater effect on the moon overall, and supplied more atoms to the atmosphere.

Nie explained:

It’s actually quite a clear difference, once you are able to count them. Lunar soils show distinct isotope patterns compared to other lunar rocks, due to meteorite impacts and solar wind bombardment, allowing us to determine which process supplied more atoms into the atmosphere.

Astronaut in bulky white spacesuit with large backpack holding a metallic instrument. He is standing in gray desolate terrain with hill behind him and black sky.
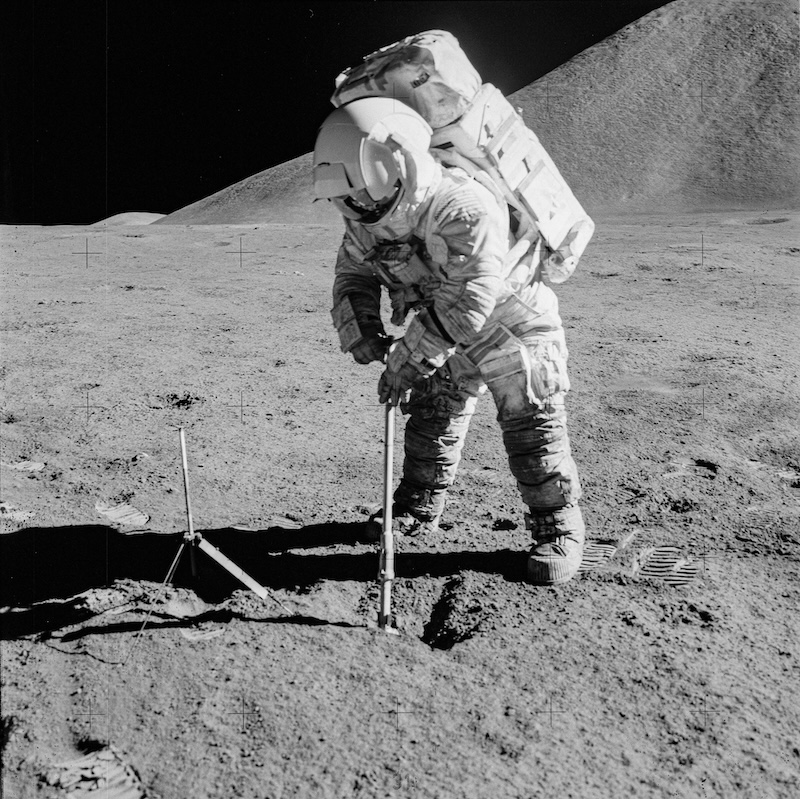
View larger. | Apollo 15 astronaut James Irwin digs a trench on the moon in 1971. The soil samples from the Apollo missions brought back to Earth provided the clues as to how the moon’s atmosphere formed and is maintained. Image via NASA.

Meteorites vs. solar wind

The study determined that meteorites play a much greater role in maintaining the moon’s thin atmosphere. The ratio, in fact, was 70% meteorites compared to only 30% solar wind. Nie said:

According to our analysis, at least 70% of the lunar atmosphere is created by these meteorite impacts. A much smaller percentage is created by the solar wind abrasion of the surface.

Nie added:

We give a definitive answer that meteorite impact vaporization is the dominant process that creates the lunar atmosphere. The moon is close to 4.5 billion years old, and through that time the surface has been continuously bombarded by meteorites. We show that eventually, a thin atmosphere reaches a steady state because it’s being continuously replenished by small impacts all over the moon.

Human habitation and the solar system

The results also have implications for eventual human habitation on the moon or even elsewhere in the solar system. Nie said:

If humans want to move to different planetary bodies someday, we will have to understand what’s going on at the surface to be able to prepare. Each planetary body is different, and the more we understand about these processes, the more complete picture we’ll have.

The Apollo soil samples were essential to figuring out the mystery of the moon’s atmosphere, as Nie also noted:

Without these Apollo samples, we would not be able to get precise data and measure quantitatively to understand things in more detail. It’s important for us to bring samples back from the moon and other planetary bodies, so we can draw clearer pictures of the solar system’s formation and evolution.

Bottom line: How did the moon’s thin atmosphere form? In a new study of Apollo soil samples, researchers say by far most of it – about 70% – comes from meteorite impacts.

Source: Lunar soil record of atmosphere loss over eons

Via University of Chicago

Via MIT

Read more: 1st lunar lava tube discovered by NASA moon orbiter

Read more: Odd swirls on the moon may be from subsurface magma

The post Was the moon’s thin atmosphere created by meteorites? first appeared on EarthSky.


from EarthSky https://ift.tt/MRQ6gEy

A conjunction happens when 2 worlds meet on the sky dome

Conjunction: Star chart showing a red dot for Mars very close to a larger white dot for Jupiter and the V-shape of the head of Taurus the Bull nearby.
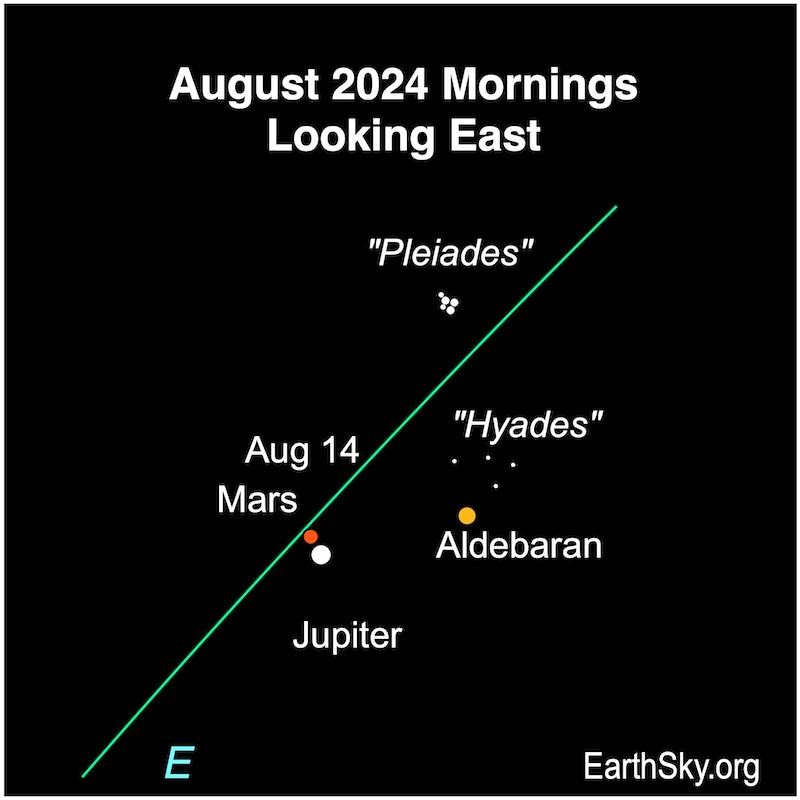
Red Mars appears to narrowly miss bright Jupiter in the early morning hours of August 14. Look in the east for this planetary conjunction. Chart by EarthSky.

On Wednesday, August 14, 2024, you can see a lovely conjunction in the morning sky. The bright planet Jupiter and the red planet Mars will meet on the sky’s dome. They are closest at 17 UTC on August 14. That’s 12 p.m. CDT.

What’s a conjunction?

Technically speaking, objects are said to be in conjunction when they have the same right ascension – sort of like celestial longitude – on our sky’s dome. Practically speaking, objects in conjunction will likely be visible near each other for some days.

Occasionally, two or more objects meet up with each other in our sky. Astronomers use the word conjunction to describe these meetings. The word conjunction comes from Latin, meaning to join together. Maybe you remember the old Conjunction Junction cartoons from the 1970s. In language, conjunctions relate to clauses brought together with words like and. In astronomy, conjunctions relate to two or more objects brought together in the sky.

Sometimes one of these objects is the sun, so the conjunction cannot be seen. But other conjunctions – between stars, our moon, and the planets – can be truly spectacular.

Ten vertical panels showing the daily positions of Venus and Jupiter closer and closer each day.
View at EarthSky Community Photos. | Soumyadeep Mukherjee of Dhanbad, India, captured these photos of Venus and Jupiter heading toward conjunction on March 1-2, 2023, and wrote: “… Venus and Jupiter have stolen the attention of astrophotographers! They were inching close to one another, slowly but surely. I was lucky enough to capture their relative movement for the last 10 days.” Thank you, Soumyadeep.

You can’t see an inferior conjunction

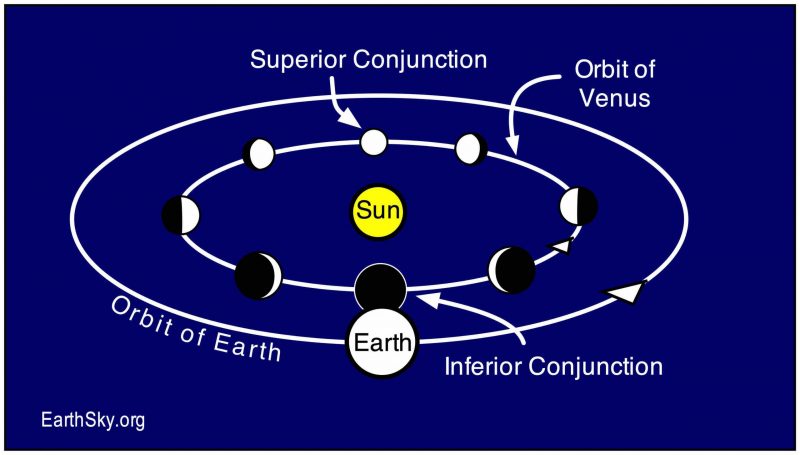
An inferior conjunction is when an object passes between us and the sun. Any object that orbits the sun closer than Earth does might pass through inferior conjunction from time to time. That is, it can, assuming its orbit lies more or less close to the ecliptic.

Usually, though, when astronomers speak of an inferior conjunction, they’re talking about Venus or Mercury, which orbit between Earth and the sun. Astronomers sometimes refer to Venus and Mercury as inferior planets. When they’re at or near inferior conjunction, we generally can’t see them. They’re hidden in the sun’s glare. Occasionally, though, Venus or Mercury at inferior conjunction can be seen to transit across the sun’s disk.

We shouldn’t forget the moon here. It passes between Earth and the sun at new moon once each month. Therefore it would be correct, if a little unusual, to say that the moon is at inferior conjunction when it’s at its new phase.

Diagram with sun, Earth, and 8 positions of Venus around its orbit showing conjunction locations.
This chart uses the orbit of Venus to show the the points of inferior and superior conjunction. Venus was last at inferior conjunction on August 13, 2023, and will be in that position again on March 22, 2025. It was last at superior conjunction on June 4, 2024. Illustration by John Jardine Goss/ EarthSky.

You can’t see a superior conjunction either

A superior conjunction is when an object passes behind the sun from our point of view. Look at Venus’ orbit in the diagram above. Half of its conjunctions with the sun – when they come together on our sky’s dome – are inferior conjunctions, and half are superior conjunctions. It’s fun to imagine the inferior planets on an endless cycle of passing in front of the sun, as seen from Earth, then behind it, and back again, like squirrels running around a tree.

Meanwhile, the superior planets – or planets farther from the sun than Earth – can never be at inferior conjunction. Mars, Jupiter, Saturn, Uranus and Neptune can never pass between us and the sun. So the superior planets only have superior conjunctions.

But other conjunctions can look beautiful

The most common – and most exciting – type of conjunction doesn’t involve the sun. Any time two objects pass each other on the sky’s dome, they’re said to be at conjunction. These sorts of conjunctions – maybe between two planets, or a planet and a star, or a star and the moon – happen multiple times every month. They are beautiful. The view can stop you in your tracks.

For example, if you were fortunate enough to have looked at the moon on July 21, 1969, as Neil Armstrong and Buzz Aldrin headed home from the Sea of Tranquillity, you’d have seen the moon in conjunction with Spica, the brightest star in the constellation Virgo. They were only about two degrees apart that night. That’s a bit more than the width of your index finger held out at arm’s length.

There are always a few particularly good conjunctions every year. On March 1-2, 2023, we were treated to a spectacular conjunction between bright planets Venus and Jupiter, as you can see below. Click here to see a full gallery of Venus-Jupiter conjunction photos captured by members of the EarthSky community.

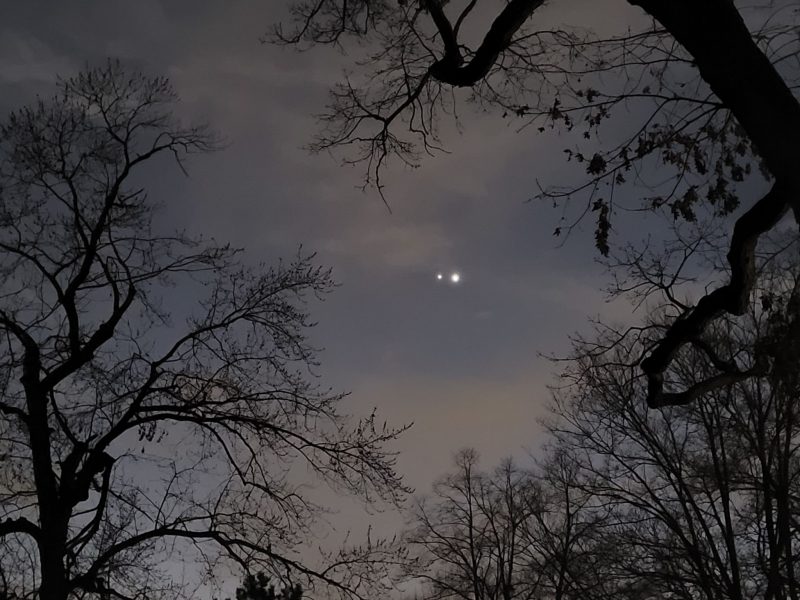
Looking up at dark sky framed by bare tree branches, one bright and one dimmer dot side by side.
View at EarthSky Community Photos. | Irina Hynes in Riverside, Illinois, captured this image of the Jupiter and Venus conjunction on March 1, 2023. Thank you, Irina!

Watch for and enjoy conjunctions

People often think about the night sky as being permanent and unchanging, at least on a human scale. If you watch the skies often, though, you’ve surely noticed that’s not true. The stars don’t move relative to each other, but they do move across the sky over the course of a single night, as Earth spins under the sky. And, from one night to the next, each star rises and sets four minutes earlier each day, as Earth moves around the sun.

Once you’ve found the ecliptic, you can see where the real action is. Because they are relatively close to us, the planets and moon do move relative to each other and the stars, and quickly, from our point of view. They change their positions, appear to move closer together and farther apart, and sometimes pass by each other in the sky coming to conjunction. Of all of the pleasures of stargazing, seeing this movement of our nearest neighbors is one of the greatest.

Stay up to date with upcoming conjunctions via EarthSky’s night sky guide.

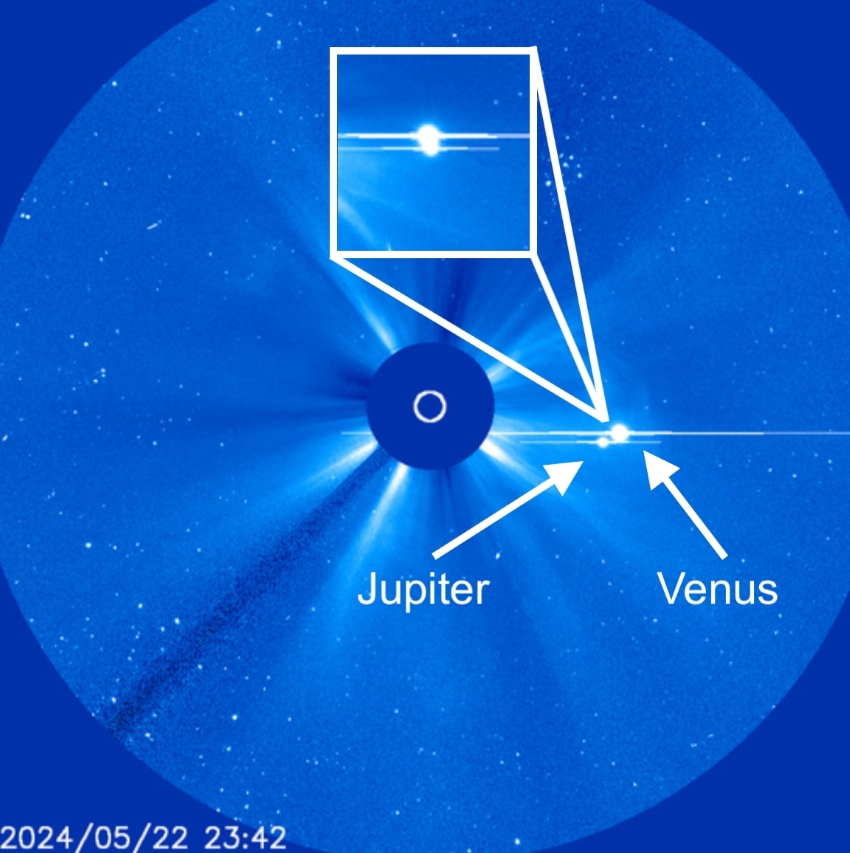
Two bright dots of Jupiter and Venus to the right of a plain blue disk blocking the sun. In the blue background, bright plumes from the sun emerge from behind the plain disk.
Planetary conjunction of Venus and Jupiter on May 22, 2024, as seen by SOHO’s LASCO C3 imagery equipment aboard the spacecraft. Image via NOAA.

Bottom line: Technically speaking, a conjunction is when two objects share the same right ascension. Then those two objects are close together on our sky’s dome. Some conjunctions can’t be seen, but others look spectacular. Don’t miss the conjunction between Jupiter and Mars around August 14, 2024.

The post A conjunction happens when 2 worlds meet on the sky dome first appeared on EarthSky.


from EarthSky https://ift.tt/9LX7AGc

Why technosignatures from solar panels might be unlikely

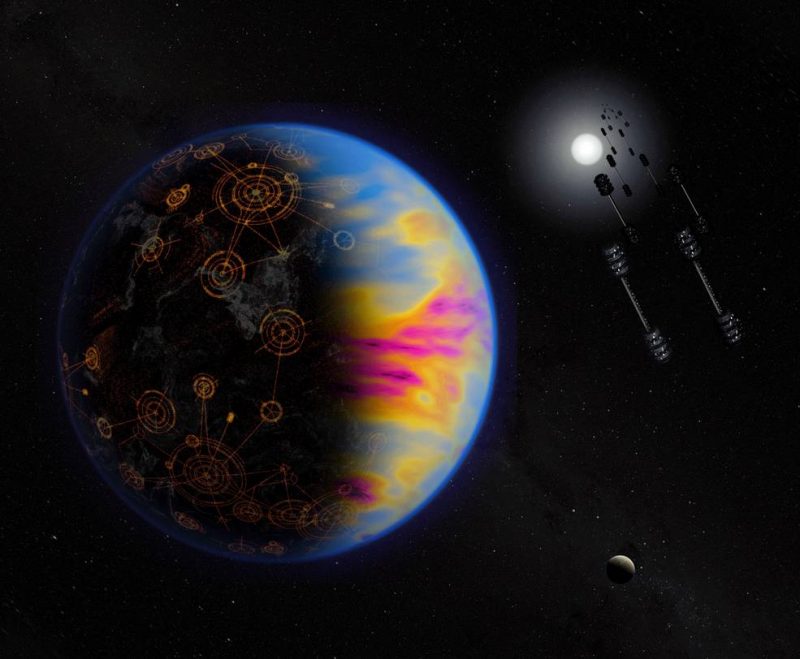
Technosignatures: Colorful planet with circular grids of light on nightside. Huge dumbbell-shaped objects in orbit.
View larger. | Artist’s concept of an exoplanet home to an alien civilization. Structures on the right are orbiting solar panel arrays that harvest light from the parent star and convert it into electricity. That energy is then beamed to the surface via microwaves. Scientists said technosignatures – signs from an advanced alien civilization – from solar panels may be tough to spot. Image via NASA/ Jay Freidlander.
  • Technosignatures are signs of alien technology. Astronomers have spoken of trying to detect large-scale solar panel arrays on an alien planet’s surface, or star-energy-gathering megastructures in space (Dyson spheres).
  • But a new study suggests it’s unlikely we’ll find technosignatures from solar panels or megastructures built by an advanced alien civilizations.
  • That’s partly due to modest energy needs of even a large civilization. For example, the study calculated that a population of 30 billion at a high-living standard would need only about 8.9% coverage of their planet with solar panels. And such relatively small solar panel coverage would be difficult to detect, even across just a few tens of light-years of space.

NASA published this original article by William Steigerwald on August 2, 2024. Edits by EarthSky.

Technosignatures from solar panels on other worlds

One of NASA’s key priorities is understanding the potential for life elsewhere in the universe. So far, NASA has not found any credible evidence of extraterrestrial life. But NASA is exploring the solar system and beyond to help us answer fundamental questions, including whether we are alone in the universe.

Astronomers have long been trying to determine the likelihood of microbial life versus complex life versus a civilization so advanced that we can spot signs of it from here at home. Signs from an advanced civilization are called technosignatures. These studies can help guide suggestions on new telescopes or missions to emphasize the most likely places and ways to look for life.

A smaller technosignature due to modest needs

Now a recent paper published May 24, 2024, in the Astrophysical Journal says if advanced extraterrestrial civilizations exist, one reason they might be hard to detect is because their energy requirements may be relatively modest. If their culture, technology and population size do not need vast amounts of power, they would not be required to build enormous stellar-energy harvesting structures that could be detected by current or proposed telescopes.

Enormous stellar-energy harvesting structures, based on our own earthly experience, might be solar panel arrays that cover a significant portion of their planet’s surface. Or they could be orbiting megastructures to harness most of their parent star’s energy. Both of which we might be able to spot from our own solar system.

Lead author Ravi Kopparapu of NASA’s Goddard Space Flight Center in Greenbelt, Maryland, said:

We found that even if our current population of about 8 billion stabilizes at 30 billion with a high standard of living, and we only use solar energy for power, we still use way less energy than that provided by all the sunlight illuminating our planet.

Fermi paradox or ‘Where is everybody?’

The study has implications for the Fermi paradox. Physicist Enrico Fermi proposed this paradox, which asks the question: Where is everybody? In other words, because our galaxy is ancient and vast, and interstellar travel is difficult but possible, why haven’t alien civilizations spread across the galaxy by now? Kopparapu said:

The implication is that civilizations may not feel compelled to expand all over the galaxy because they may achieve sustainable population and energy-usage levels even if they choose a very high standard of living. They may expand within their own stellar system, or even within nearby star systems, but galaxy-spanning civilizations may not exist.

Additionally, our own technological expertise may not yet be able to predict what more advanced civilizations could do. Co-author Vincent Kofman of NASA Goddard and American University, Washington, D.C., added:

Large-scale stellar-energy harvesting structures may especially be obsolete when considering technological advances. Surely a society that can place enormous structures in space would be able to access nuclear fusion or other space-efficient methods of generating power.

Modeling technosignatures from aliens

The researchers used computer models and NASA satellite data to simulate an Earth-like planet with varying levels of silicon solar panel coverage. The team then modeled an advanced telescope like the proposed NASA Habitable Worlds Observatory. They wanted to see if it could detect solar panels on a planet about 30 light-years away. That’s relatively nearby in a galaxy that spans over 100,000 light-years. They found that type of telescope would require several hundreds of hours of observing time to detect signatures from solar panels covering about 23% of the land area on an Earth-like exoplanet. However, the requirement for 30 billion humans at a high-living standard was only about 8.9% solar-panel coverage.

Looking for extraterrestrial civilizations with advanced technology using technosignatures – observational manifestations of ET technology – is not new. For decades, scientists have been using radio telescopes to look for potential extraterrestrial radio transmissions. More recently, astronomers have proposed using a telescope like the Habitable Worlds Observatory to look for other kinds of technosignatures. They propose looking for chemical fingerprints in exoplanet atmospheres. They also suggest looking for specific characteristics in the light reflected by an exoplanet. Those characteristics might announce the presence of vast silicon solar arrays.

Making assumptions

The new study assumes aliens would build solar panels out of silicon. That’s because it’s relatively abundant compared to other elements used in solar power, such as germanium, gallium or arsenic. Also, silicon is good at converting the light emitted by sun-like stars into electricity. And it’s cost-effective to mine and manufacture into solar cells.

The researchers also assume that a hypothetical extraterrestrial civilization would rely exclusively on solar energy. However, if they used other sources of energy, such as nuclear fusion, it would reduce the silicon technosignature. Therefore it would make the civilization even harder to detect. The study further assumes that the civilization’s population stabilizes at some point. If this doesn’t happen for whatever reason, perhaps they will be driven to expand ever-father into deep space. Finally, it’s impossible to know if an advanced civilization may be using something we haven’t imagined yet that requires immense amounts of power.

Bottom line: Technosignatures – signs of an advanced alien civilization – in the form of solar panels may be difficult to detect, a new study says.

Source: Detectability of Solar Panels as a Technosignature

Via NASA

The post Why technosignatures from solar panels might be unlikely first appeared on EarthSky.


from EarthSky https://ift.tt/alhegPO

Aquila the Eagle soars along the Milky Way

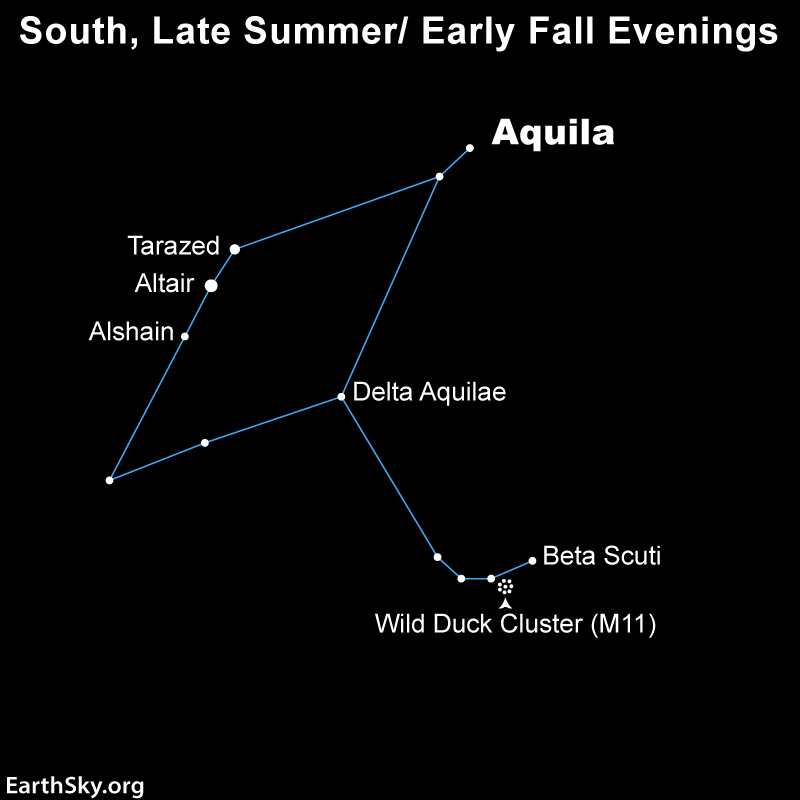
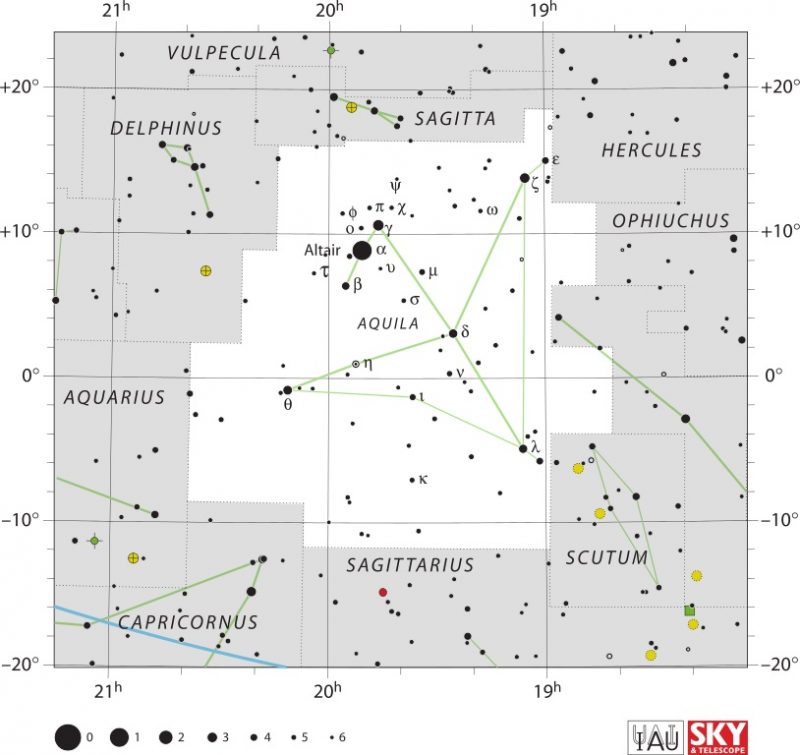
Aquila the Eagle: Star chart of a stretched diamond shape with a tail from the wide edge, with labels.
Aquila the Eagle is home to the star Altair, which is one of the corners of the Summer Triangle. In addition, you can also use Aquila to starhop your way to the Wild Duck Cluster in Scutum the Shield. Image via EarthSky.

The best time to see the constellation of Aquila the Eagle in the evening sky is from July to November as it soars along the Milky Way. And, because our galaxy provides a starry backdrop, many clusters and nebulae lie within its borders. Aquila’s brightest star, Altair, is the southernmost corner star in the Summer Triangle. In mythology, Aquila carried Zeus’ thunderbolts for him.

The stars of Aquila the Eagle

The brightest star in Aquila is Alpha Aquilae, or Altair. At magnitude 0.76, it is one of the three bright stars that mark the corners of the Summer Triangle. Deneb and Vega are the other two and they lie higher in the sky, closer to the zenith on summer evenings. Altair lies just 17 light-years away from Earth.

Additionally, two moderately bright stars lie on either side of Altair. To the southeast is Beta Aquilae, or Alshain. This magnitude 3.71 star lies 45 light-years away. To the other side of Altair is Gamma Aquilae, or Tarazed. At magnitude 2.72, it’s brighter than Alshain but lies much farther away at 461 light-years. This trio of stars is found near the head of Aquila the Eagle.

Then, the star marking Aquila’s back is Delta Aquilae, at magnitude 3.36 and 50 light-years away. Likewise, Theta Aquilae marks the left wing. It shines at magnitude 3.26 from across 286 light-years. The right wing, that points to Vega, holds Zeta Aquilae at magnitude 2.99 and 83 light-years distant. Lastly, the star at the end of the tail of the Eagle is Lambda Aquilae at magnitude 3.43, lying 125 light-years away.

White chart with black dots for stars and constellation Aquila highlighted.
The stars of Aquila the Eagle. And, the larger the dot, the brighter the star. Image via IAU/ Sky and Telescope/ Wikimedia Commons (CC BY 3.0).

Globular clusters

While there are no Messier objects in Aquila, there is still a lot to see, especially if you have a big enough telescope. For example, two globular clusters lie in Aquila: NGC 6749 and NGC 6760.

The two globular clusters are in the vicinity of Delta Aquilae. NGC 6760, which shines at magnitude 9.1. Then, about 2 degrees farther away is NGC 6749 at magnitude 12.

In addition, several open clusters lie in Aquila, but most of them are faint. With this in mind, the best one to observe is NGC 6755, a 7.5-magnitude grouping found near the star marking the back of the Eagle. Another good open cluster to try for is NGC 6709, which, at magnitude 6.7, appears in binoculars. NGC 6709 is about near Zeta Aquilae, the upper wing of the Eagle. In between these two clusters is yet another cluster, NGC 6738. This sparse cluster is 8th magnitude.

Also, a lot of observers who come to Aquila use it to starhop to a cluster just over the border of the constellation Scutum the Shield. The Wild Duck Cluster, M11, shines at magnitude 6.3, making it brighter than any clusters in Aquila. Here’s how to find it.

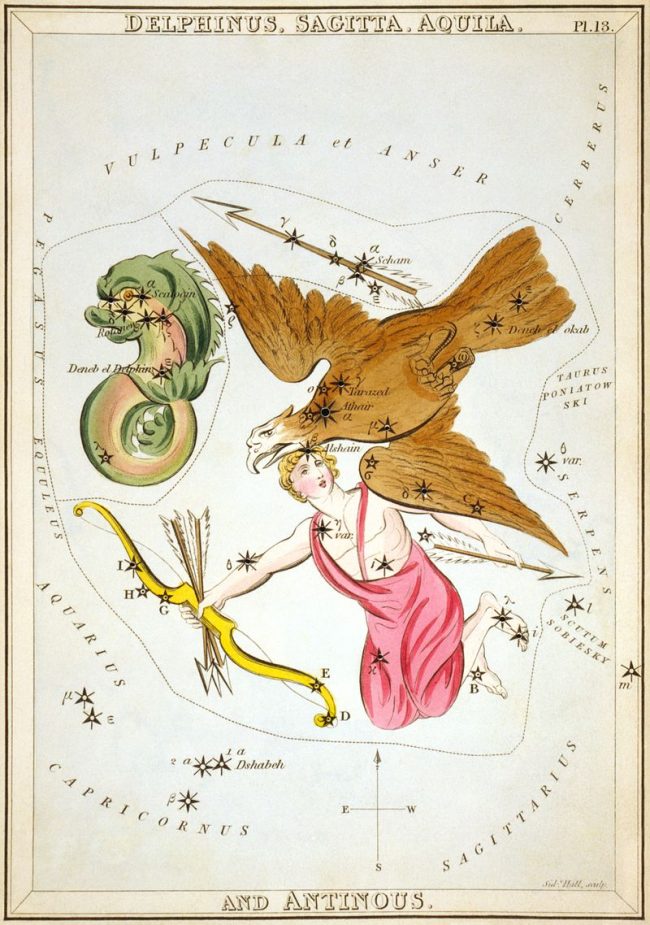
Antique colored etching of flying eagle and other figures including an ugly fish, all scattered with stars.
Altair of Aquila the Eagle, with 2 smaller constellations nearby. Image via Wikipedia. Used with permission.

Nebulae of Aquila

A number of nebulae lie along the line that marks the body of the Eagle, but only one is bright enough to reach even 10th magnitude. NGC 6790 lies a little less than two degrees from the star that marks the back of the Eagle in the direction of its tail.

Good luck tracking down these tough-to-spot, faint objects in Aquila the Eagle. Or, you can always just scan the area in binoculars and see what materializes.

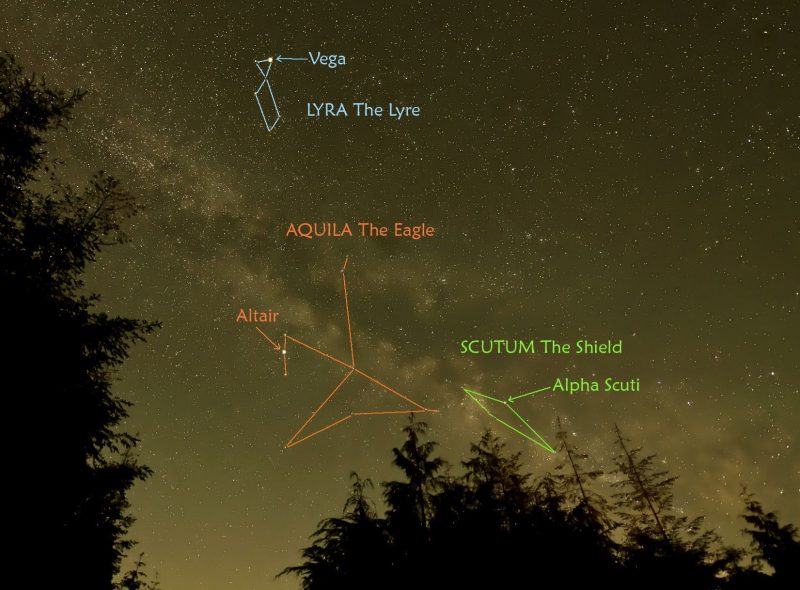
Photo of the starlit band of the Milky Way, with outlines for Scutum, Aquila the Eagle and Lyra.
View at EarthSky Community Photos. | Cecille Kennedy caught this image from the central Oregon coast. Notice how Aquila the Eagle soars along the Milky Way. Thank you, Cecille!

Bottom line: Aquila the Eagle is home to the bright star Altair, which forms one corner in the Summer Triangle. And you can see this constellation at its best on northern late summer or early fall evenings.

The post Aquila the Eagle soars along the Milky Way first appeared on EarthSky.


from EarthSky https://ift.tt/xVctrmT

Evolution of penguins’ wings revealed in new fossils

A gray and white bird standing upright, a penguin, on a beach with other penguins in the distance.
Artist’s concept of what the ancient penguin species, Pakudyptes hakataramea, may have looked like. The fossil wing of this specimen has shed new light on the evolution of modern penguins’ wings. Image via Tatsuya Shinmura/ Ashoro Museum of Paleontology/ University of Otago.

Penguins with their flipper-like wings may look comical as they waddle on land. But in the water, those wings and torpedo-shaped bodies make these seabirds expert, graceful divers. Scientists said on August 1, 2024, that fossilized penguin bones from New Zealand, dated to 24 million years ago, are now revealing new details on the evolution of penguins’ wings.

These findings were published in the peer-reviewed Journal of the Royal Society of New Zealand on August 1, 2024.

Penguins are well-adapted for ocean life

There are 18 species of penguins alive today. These flightless birds live mostly along Southern Hemisphere coastlines and oceans. One exception is a species found north of the equator at the Galápagos Islands. The largest penguin species, the emperor penguin that lives in Antarctica, is over 4 feet (1.2 meters) tall. At the other extreme is the diminutive little blue penguin, of Australia and New Zealand, that measures just a foot (30 cm) in length.

Penguins are expert ocean swimmers that feed on fish, krill and squid. They have streamlined bodies optimized for moving through water. And they use their finlike wings to propel forward, as if flying underwater. The gentoo penguin is the fastest diver. It can reach speeds of up to 22 miles per hour (35 kph) and can dive as deep as 660 feet (200 m). An emperor penguin can dive as much as 1,800 feet (548 m) deep. Smaller penguins, like the little blue penguin, however, tend to forage closer to the water surface.

A missing link in penguin evolution

Modern-day penguins began their evolutionary journey about 34 million years ago, during the Oligocene. Pakudyptes hakataramea, the new penguin species reported by the researchers, lived 24 million years ago in New Zealand. It was identified from fossilized wing bones found in the Hakataramea Valley, South Canterbury, New Zealand, in 1987.

Pakudyptes was a small penguin, about the size of the little blue penguin, the smallest penguin species alive today.

Tatsuro Ando of the Ashoro Museum of Paleontology in Japan is the paper’s lead author. He said in a statement that Pakudyptes’s wing bones filled a gap in the bone forms seen in fossils and currently living (or extant) penguins. He commented:

In particular, the shape of the wing bones [between fossil and extant penguins] differed greatly, and the process by which penguin wings came to have their present form and function remained unclear.

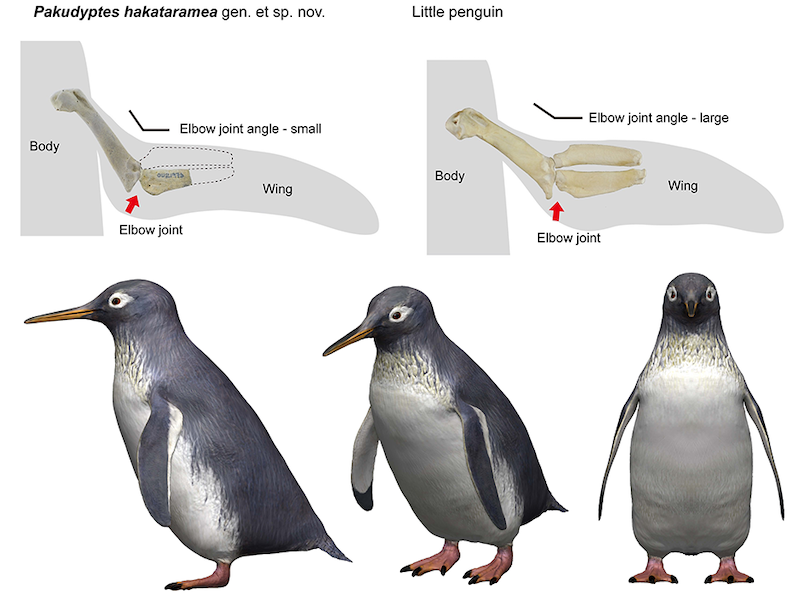
The humerus and ulna highlight how penguins’ wings have evolved.

Surprisingly, while the shoulder joints of the wing of Pakudyptes were very close to the condition of the present-day penguin, the elbow joints were very similar to those of older types of fossil penguins.

Pakudyptes is the first fossil penguin ever found with this combination, and it is the “key” fossil to unlocking the evolution of penguin wings.

Top: 2 wing outlines, each containing 3 short bones. Bottom: three penguins seen at different angles.
The top figure compares the wing structure elbow joints of Pakudyptes and the little blue penguin. The bottom section is an artist’s concept of Pakudyptes. Image via Tatsuya Shinmura/ Ashoro Museum of Paleontology/ University of Otago.

Pakudyptes bone structure indicates it was also a diver

Modern penguins have dense thick bones that help them maintain buoyancy while diving. According to Carolina Loch at the University of Otago, Pakudyptes’s internal bone structure revealed it only dove to shallow depths. The outer bone layer – the bone cortex – was thick while the internal cavity that would have contained bone marrow was open. This bone structure was similar to that of the little blue penguin.

The fossilized humerus and ulna also showed areas where muscles and ligaments once attached to it. That helped reveal how Pakudyptes used its wings to swim underwater.

Loch remarked:

Penguins evolved rapidly from the Late Oligocene to Early Miocene, and Pakudyptes is an important fossil from this period. Its small size and unique combination of bones may have contributed to the ecological diversity of modern penguins.

Bottom line: A penguin fossil from 24 million years ago in New Zealand has shed new light on the evolution of penguins’ wings.

Source: A new tiny fossil penguin from the Late Oligocene of New Zealand and the morphofunctional transition of the penguin wing

Via University of Otago

Read more: New emperor penguin colonies discovered by satellite

The post Evolution of penguins’ wings revealed in new fossils first appeared on EarthSky.


from EarthSky https://ift.tt/Xz2Ct6I

Extreme weather: We haven’t seen the worst yet

Vast lowering gray clouds over the distant skyline of New York City.
View at EarthSky Community Photos. | Alexander Krivenyshev captured mammatus clouds during a storm over New York on August 4, 2024. Mammatus clouds form when there’s hail, heavy rain and lightning in the vicinity. Thank you, Alexander.
  • Climate change is outpacing our understanding of extreme weather, making it harder to predict future conditions accurately.
  • Climate statistics are outdated as global temperatures rise, leading to unpredicted severe weather events.
  • Accuracy of models used to anticipate weather extremes is uncertain in today’s rapidly shifting climate.

By Simon H. Lee, University of St Andrews; Hayley J. Fowler, Newcastle University, and Paul Davies, Newcastle University

We haven’t seen how bad extreme weather could get

Extreme weather is, by definition, rare on planet Earth. Ferocious storms, searing heatwaves and biting cold snaps illustrate what the climate can do, at its worst. But in the 21st century, as Earth’s climate rapidly warms, the range of possible weather conditions, including extremes, is changing.

Scientists define “climate” as the distribution of possible weather events observed over a length of time, such as the range of temperatures, rainfall totals or hours of sunshine. From this they construct statistical measures, such as the average (or normal) temperature. Weather varies on several timescales – from seconds to decades – so the longer the period over which the climate is analyzed, the more accurately these analyses capture the infinite range of possible configurations of the atmosphere.

Typically, meteorologists and climate scientists use a 30-year period to represent the climate, which is updated every ten years. The most recent climate period is 1991-2020. The difference between each successive 30-year climate period serves as a very literal record of climate change.

This way of thinking about the climate falls short when the climate itself is rapidly changing. Global average temperatures have increased at around 0.2°C (0.36°F) per decade over the past 30 years, meaning that the global climate of 1991 was around 0.6°C (1.08 F) cooler than that in 2020 (when accounting for other year-to-year fluctuations), and even more so than the present day.


Check out this conversation on climate chaos with meteorologist and climatologist Daniel Swain. It was one of EarthSky’s most-viewed livestreams yet … now available as a replay.

A moving target for climate modelers

If the climate is a range of possible weather events, then this rapid change has two implications. First, it means that part of the distribution of weather events comprising a 30-year climate period occurred in a very different background global climate: for example, northerly winds in the 1990s were much colder than those in the 2020s in north-west Europe, thanks to the Arctic warming nearly four times faster than the global average. Statistics from three decades ago no longer represent what is possible in the present day.

Second, the rapidly changing climate means we have not necessarily experienced the extremes that modern-day atmospheric and oceanic warmth can produce. In a stable climate, scientists would have multiple decades for the atmosphere to get into its various configurations and drive extreme events, such as heatwaves, floods or droughts. We could then use these observations to build up an understanding of what the climate is capable of. But in our rapidly changing climate, we effectively have only a few years, not enough to experience everything the climate has to offer.

A perfect storm

Extreme weather events require what meteorologists might call a “perfect storm.” For example, extreme heat in the U.K. typically requires the northward movement of an air mass from Africa combined with clear skies, dry soils and a stable atmosphere to prevent thunderstorms forming which tend to dissipate heat.

Such “perfect” conditions are intrinsically unlikely, and many years can pass without them occurring, all while the climate continues to change in the background. Based on an understanding of observations alone, this can leave us woefully underprepared for what the climate can now do, should the right weather conditions all come together at once.

Startling recent examples include the extreme heatwave in the Pacific Northwest est of North America in 2021, in which temperatures exceeded the previous Canadian record maximum by 4.6°C (8.28 F). Another is the occurrence of 40°C (104 F) in the U.K. in summer 2022, which exceeded the previous U.K. record maximum set only three years earlier by 1.6°C (2.88 F). This is part of the reason why the true impact of a fixed amount of global warming is only evident after several decades, but of course – since the climate is changing rapidly – we cannot use this method anymore.

Playing with fire

To better understand these extremes, scientists can use ensembles: many runs of the same weather or climate model that each slightly differ to show a range of plausible outcomes. Ensembles are routinely used in weather prediction, but can also be used to assess extreme events which could happen even if they do not actually happen at the time.

When 40°C (104 F) first appeared in ensemble forecasts for the U.K. before the July 2022 heatwave, it revealed the kind of extreme weather that is possible in the current climate. Even if it had not come to fruition, its mere appearance in the models showed that the previously unthinkable was now possible. In the event, several naturally occurring atmospheric factors combined with background climate warming to generate the record-shattering heat on July 19 that year.

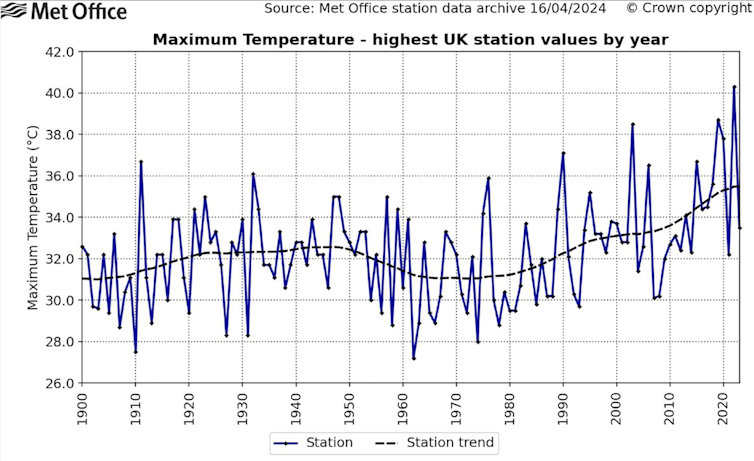
The highest observed temperature each year in the UK, from 1900 to 2023

A violently zigzag graph tending upward from left to right.
The hottest days are getting hotter in the UK.
Met Office/Kendon et al. 2024

Later in summer 2022, after the first occurrence of 40°C (104 F), some ensemble weather forecasts for the UK showed a situation in which 40°C (104 F) could be reached on multiple consecutive days. This would have posed an unprecedented threat to public health and infrastructure in the U.K. Unlike the previous month, this event did not come to pass, and was quickly forgotten, but it shouldn’t have been.

It is not certain whether these model simulations correctly represent the processes involved in producing extreme heat. Even so, we must heed the warning signs.

This year in the UK

Despite a record-warm planet, summer 2024 in the U.K. has been relatively cool so far. The past two years have seen global temperatures far above anything previously observed, and so potential extremes have probably shifted even further from what we have so far experienced.

Just as was the case in August 2022, we’ve got away with it for now, but we might not be so lucky next time.

Simon H. Lee, Lecturer in Atmospheric Science, University of St Andrews; Hayley J. Fowler, Professor of Climate Change Impacts, Newcastle University, and Paul Davies, Chief Meteorologist, Met Office and Visiting Professor, Newcastle University

This article is republished from The Conversation under a Creative Commons license. Read the original article.

Bottom line: Earth’s climate is now changing so rapidly that traditional meteorological forecasting models are failing to predict extreme weather.

Read more: Q&A: What is the sun’s role in climate change?

The post Extreme weather: We haven’t seen the worst yet first appeared on EarthSky.


from EarthSky https://ift.tt/x2bm6QG