Scorching storms on brown dwarfs revealed by Webb

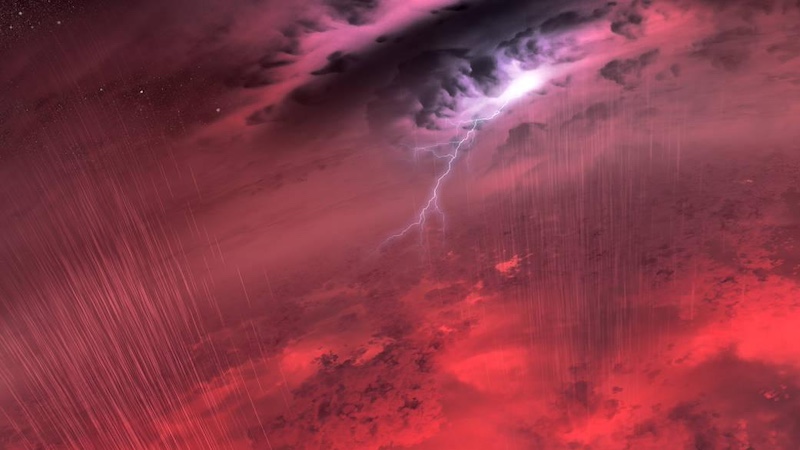
Brown dwarfs: Dark stormy clouds with bright bolt of lightning.
Artist’s concept of stormy weather on a brown dwarf, such as those in the WISE 1049AB binary pair. NASA’s Webb space telescope has taken a detailed look at scorching storms on the 2 brown dwarfs. Image via NASA/ JPL-Caltech/ University of Western Ontario/ Stony Brook University/ Tim Pyle/ University of Edinburgh.
  • NASA’s Webb space telescope has observed scorching hot storms on the binary pair of brown dwarfs called WISE 1049AB. They are the closest and brightest known brown dwarfs, only 6 light-years from Earth.
  • Webb analyzed the light waves coming from WISE 1049AB, detecting hot swirling sand in the atmospheres amid temperatures of 1,740 degrees Fahrenheit (950 C).
  • The results shed new light not only on how brown dwarfs form but also gas giant exoplanets.

Meet WISE 1049AB, a pair of hot, stormy brown dwarfs

Brown dwarfs are extreme worlds, falling somewhere between planets and stars. NASA’s James Webb Space Telescope (JWST) has revealed intense, scorching storms on a binary pair of brown dwarfs. The brown dwarfs are known collectively as WISE 1049AB. An international team of researchers said on July 15, 2024, Webb detected swirling clouds of hot sand on the two brown dwarfs. The new weather report by Webb is the most detailed to date for any bodies outside our solar system, revealing temperatures of about 1,740 degrees Fahrenheit (950 C).

The two brown dwarfs are the closest and brightest known to Earth at only 6 light-years away. This makes them well-suited for study by telescopes such as Webb.

The researchers published their peer-reviewed findings in the Monthly Notices of the Royal Astronomical Society on July 15, 2024.

A 3-D visualization of wild weather

So how did the researchers create the new weather report for WISE 1049AB? Webb measured the light waves coming from the surfaces of the two brown dwarfs. Just like with Earth, those light waves change as the part of each brown dwarf facing Earth becomes more and less cloudy.

Webb observed these weather changes over the course of one day for the brown dwarfs, about five to seven hours.

Analysis of the varying wavelengths of light showed the atmospheres of the brown dwarfs contain water, methane and carbon monoxide.

Webb is able to observe wavelengths of light that are normally blocked by Earth’s atmosphere. This makes it ideal to study objects such as brown dwarfs. As the paper stated:

WISE 1049AB is the pivotal first system to test the unique capabilities of JWST to probe the atmospheres of similar objects, as the wide-wavelength coverage of JWST opens wavelengths inaccessible from the ground or with any other telescope and enables tests of specific variability mechanisms.

The Webb observations are also unique because they captured the brown dwarfs as they rotated. Previous observations were mostly limited to taking “snapshots” of one side of a brown dwarf as it faced toward Earth. That is not as ideal, since brown dwarfs rotate relatively rapidly.
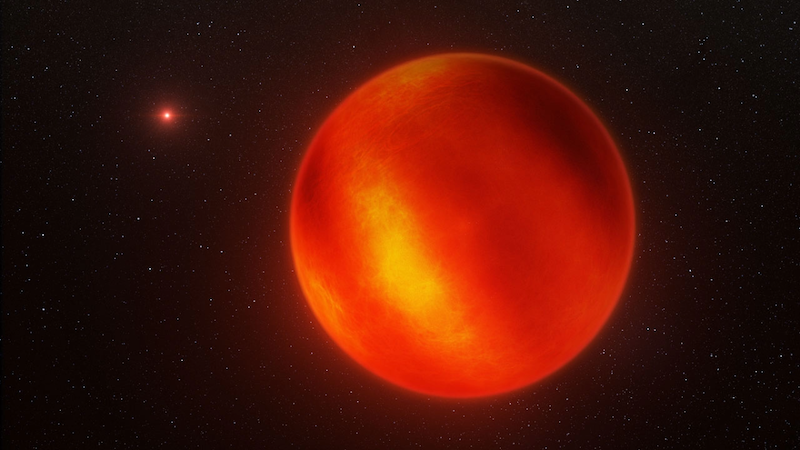
Brown dwarfs: Reddish sphere in space with bright and dark patches. Another similar sphere is in the distance.
Artist’s concept of the brown dwarf binary pair WISE 1049AB. Image via ESO/ Crossfield N. Risinger/ University of Edinburgh.

Brown dwarfs as a missing link

Since brown dwarfs are typically between planets and stars in terms of size and mass, scientists think they could be considered a missing link of sorts. Knowing more about how they form and evolve will help scientists better understand the evolution of both planets and stars as well.

There are still a lot of questions about brown dwarfs. Why are they different from both planets and stars? Why do some orbit stars, like planets, while others are solitary? And why do some orbit each other, as binary pairs?

Further studies

The new Webb observations provide valuable insight into not only WISE 1049AB, but other brown dwarfs as well, and even exoplanets. The paper said:

These observations demonstrate the transformational power of JWST to reveal the complex vertical structure of brown dwarf atmospheres. While WISE 1049AB are the two brightest brown dwarfs known, dozens of others are amenable to similar studies with JWST. JWST also enables similar studies of young, giant exoplanets, the lower surface gravity, and lower mass cousins of brown dwarfs. This is the first such study, but will not be the last. In the next few observing cycles, JWST will transform our understanding of both brown dwarf and young, giant exoplanet atmospheres.

WISE 1049AB is a great example of a brown dwarf pair. Another interesting study from last March showed that the older and less massive a brown dwarf is, however, the more likely it will end up solitary.

Bottom line: NASA’s Webb Space Telescope has created a new weather map of extreme storms on a binary pair of brown dwarfs only 6 light-years away.

Source: The JWST weather report from the nearest brown dwarfs I: multiperiod JWST NIRSpec + MIRI monitoring of the benchmark binary brown dwarf WISE 1049AB

Via The University of Edinburgh

Read more: Older brown dwarfs are more likely to be lonely

Read more: Tiny brown dwarf is smallest found so far

The post Scorching storms on brown dwarfs revealed by Webb first appeared on EarthSky.


from EarthSky https://ift.tt/w84r9g7
Brown dwarfs: Dark stormy clouds with bright bolt of lightning.
Artist’s concept of stormy weather on a brown dwarf, such as those in the WISE 1049AB binary pair. NASA’s Webb space telescope has taken a detailed look at scorching storms on the 2 brown dwarfs. Image via NASA/ JPL-Caltech/ University of Western Ontario/ Stony Brook University/ Tim Pyle/ University of Edinburgh.
  • NASA’s Webb space telescope has observed scorching hot storms on the binary pair of brown dwarfs called WISE 1049AB. They are the closest and brightest known brown dwarfs, only 6 light-years from Earth.
  • Webb analyzed the light waves coming from WISE 1049AB, detecting hot swirling sand in the atmospheres amid temperatures of 1,740 degrees Fahrenheit (950 C).
  • The results shed new light not only on how brown dwarfs form but also gas giant exoplanets.

Meet WISE 1049AB, a pair of hot, stormy brown dwarfs

Brown dwarfs are extreme worlds, falling somewhere between planets and stars. NASA’s James Webb Space Telescope (JWST) has revealed intense, scorching storms on a binary pair of brown dwarfs. The brown dwarfs are known collectively as WISE 1049AB. An international team of researchers said on July 15, 2024, Webb detected swirling clouds of hot sand on the two brown dwarfs. The new weather report by Webb is the most detailed to date for any bodies outside our solar system, revealing temperatures of about 1,740 degrees Fahrenheit (950 C).

The two brown dwarfs are the closest and brightest known to Earth at only 6 light-years away. This makes them well-suited for study by telescopes such as Webb.

The researchers published their peer-reviewed findings in the Monthly Notices of the Royal Astronomical Society on July 15, 2024.

A 3-D visualization of wild weather

So how did the researchers create the new weather report for WISE 1049AB? Webb measured the light waves coming from the surfaces of the two brown dwarfs. Just like with Earth, those light waves change as the part of each brown dwarf facing Earth becomes more and less cloudy.

Webb observed these weather changes over the course of one day for the brown dwarfs, about five to seven hours.

Analysis of the varying wavelengths of light showed the atmospheres of the brown dwarfs contain water, methane and carbon monoxide.

Webb is able to observe wavelengths of light that are normally blocked by Earth’s atmosphere. This makes it ideal to study objects such as brown dwarfs. As the paper stated:

WISE 1049AB is the pivotal first system to test the unique capabilities of JWST to probe the atmospheres of similar objects, as the wide-wavelength coverage of JWST opens wavelengths inaccessible from the ground or with any other telescope and enables tests of specific variability mechanisms.

The Webb observations are also unique because they captured the brown dwarfs as they rotated. Previous observations were mostly limited to taking “snapshots” of one side of a brown dwarf as it faced toward Earth. That is not as ideal, since brown dwarfs rotate relatively rapidly.

Brown dwarfs: Reddish sphere in space with bright and dark patches. Another similar sphere is in the distance.
Artist’s concept of the brown dwarf binary pair WISE 1049AB. Image via ESO/ Crossfield N. Risinger/ University of Edinburgh.

Brown dwarfs as a missing link

Since brown dwarfs are typically between planets and stars in terms of size and mass, scientists think they could be considered a missing link of sorts. Knowing more about how they form and evolve will help scientists better understand the evolution of both planets and stars as well.

There are still a lot of questions about brown dwarfs. Why are they different from both planets and stars? Why do some orbit stars, like planets, while others are solitary? And why do some orbit each other, as binary pairs?

Further studies

The new Webb observations provide valuable insight into not only WISE 1049AB, but other brown dwarfs as well, and even exoplanets. The paper said:

These observations demonstrate the transformational power of JWST to reveal the complex vertical structure of brown dwarf atmospheres. While WISE 1049AB are the two brightest brown dwarfs known, dozens of others are amenable to similar studies with JWST. JWST also enables similar studies of young, giant exoplanets, the lower surface gravity, and lower mass cousins of brown dwarfs. This is the first such study, but will not be the last. In the next few observing cycles, JWST will transform our understanding of both brown dwarf and young, giant exoplanet atmospheres.

WISE 1049AB is a great example of a brown dwarf pair. Another interesting study from last March showed that the older and less massive a brown dwarf is, however, the more likely it will end up solitary.

Bottom line: NASA’s Webb Space Telescope has created a new weather map of extreme storms on a binary pair of brown dwarfs only 6 light-years away.

Source: The JWST weather report from the nearest brown dwarfs I: multiperiod JWST NIRSpec + MIRI monitoring of the benchmark binary brown dwarf WISE 1049AB

Via The University of Edinburgh

Read more: Older brown dwarfs are more likely to be lonely

Read more: Tiny brown dwarf is smallest found so far

The post Scorching storms on brown dwarfs revealed by Webb first appeared on EarthSky.


from EarthSky https://ift.tt/w84r9g7

The Northern Cross: Find the backbone of the Milky Way

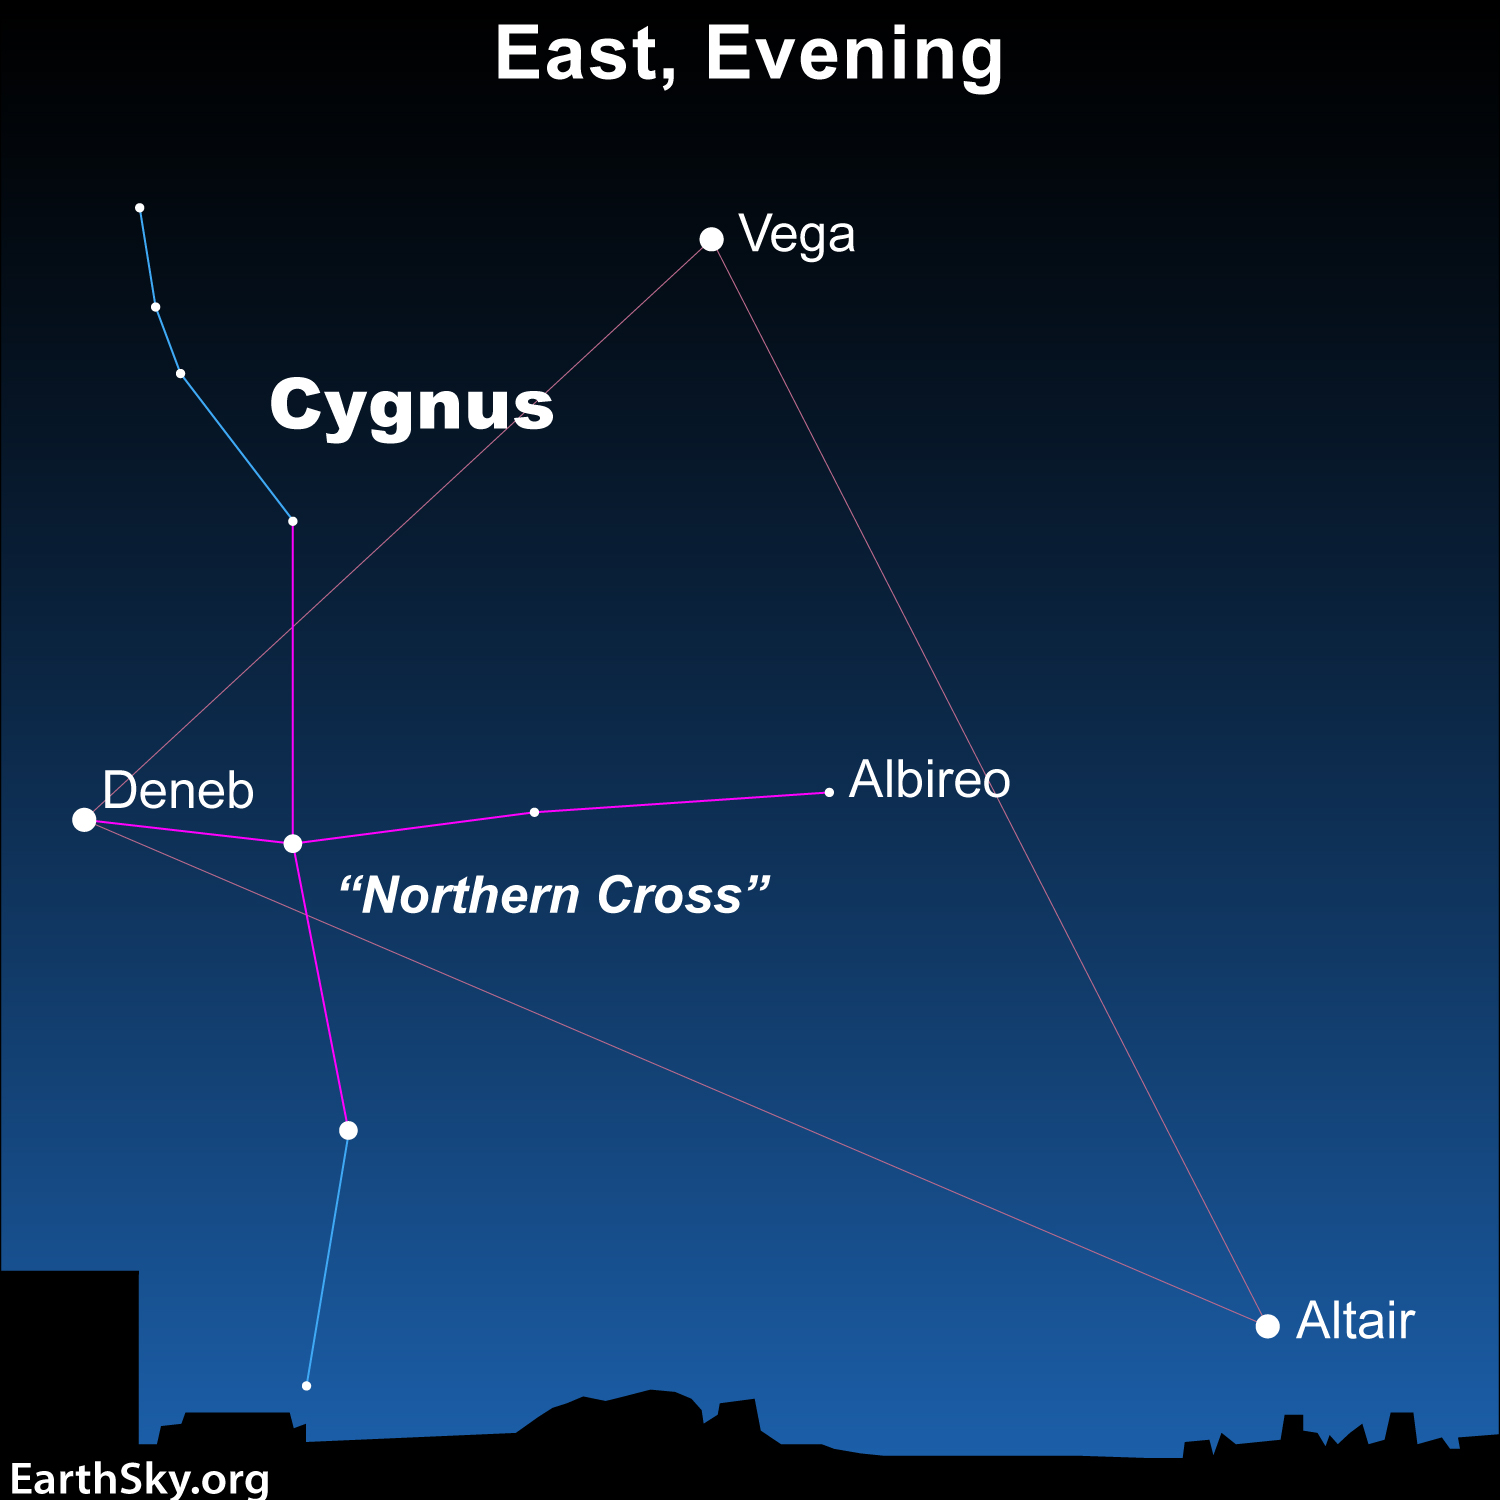
Northern cross: Star chart with a horizontal cross of stars inside a larger triangle pattern and some stars labeled.
The constellation Cygnus represents a graceful swan. But many also see it as a cross, and so these stars have become known as an asterism called the Northern Cross. The entire pattern fits inside a larger asterism created by the 3 bright stars Vega, Deneb and Altair: the famous Summer Triangle. Chart via EarthSky.

How to find the Northern Cross

The Northern Cross is a clipped version of the constellation Cygnus the Swan. It’s an asterism, or pattern of stars that’s not a recognized constellation. It lies embedded within another much larger asterism: the Summer Triangle. You’ve got to have a dark sky and a good imagination to see a swan in the stars of Cygnus. But the Northern Cross is easy to see, even if your sky is less than pristine.

Here’s step one for finding the Northern Cross. Look for the asterism’s most brilliant star, Deneb. Deneb marks the top of the Northern Cross. It’s also well known as one of the three bright stars of the Summer Triangle, along with Vega and Altair.

Now, look for a bright star roughly halfway between Altair and Vega and slightly offset toward Deneb. That’ll be Albireo. Although only a modestly bright star, Albireo is easy to see on a clear, dark night. There are no similarly bright stars near Albireo, so it’s fairly easy to find.

Once you locate Deneb and Albireo, you’re halfway to piecing together the Northern Cross. All you need now is the crossbar, which most people see as three moderately bright stars. As you can see in the illustration above, these three stars extend about halfway out into the wings of Cygnus the Swan.

Backbone of the Milky Way

When you look at the Northern Cross, you’re looking directly into the flat disk of our galaxy, the Milky Way. In fact, the galactic plane (equator) runs right through the Northern Cross, encircling the sky above and below the horizon. So the Northern Cross serves as a great signpost for a view of our home galaxy. In a dark sky on a northern summer evening, the Milky Way appears as a luminescent river of haze passing directly along the length of the Northern Cross. You can see this hazy band stretching all the way across the sky on late July and August evenings.

You probably know that this haze is actually countless stars. So, these stars will emerge beautifully through binoculars, as will the star fields, star clusters and nebulae that abound within the disk of the Milky Way!

Large clouds of red-colored gas over a multitude of distant stars.
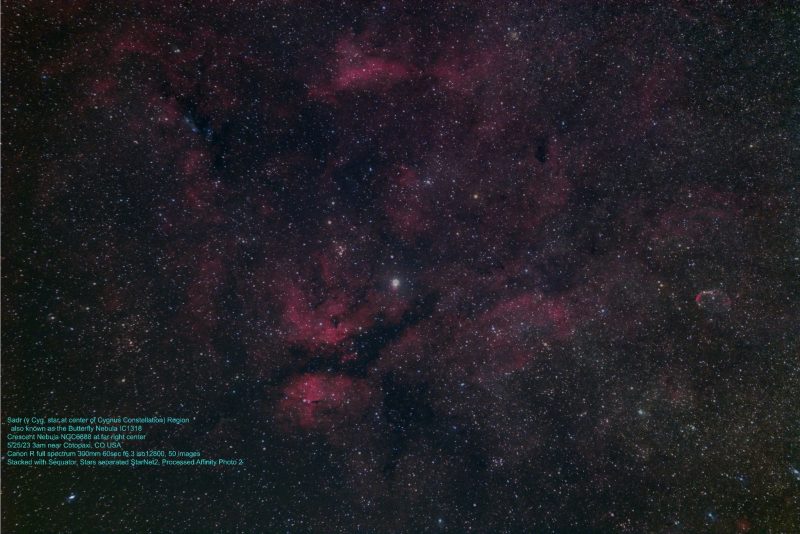
View at EarthSky Community Photos. | Andy Dungan near Cotopaxi, Colorado, captured this image of the Sadr Star Region in Cygnus the Swan on May 25, 2023. The bright central star is Sadr, the star at the intersection of the Northern Cross. Andy wrote: “Cygnus is full of fun stuff to shoot. I had no idea how large the area surrounding the central star of Cygnus (Sadr or Gamma Cygni) was. The large area around Sadr is identified as the Sadr Region or the Butterfly Nebula, IC 1318.” Thank you, Andy!

Northern Cross as a marker of seasons

As seen from mid-northern latitudes, the Northern Cross is out for at least part of the night all year around. Plus, it’s out all night in summer. On Northern Hemisphere summer nights, the Northern Cross shines in the east at nightfall, sweeps high overhead after midnight, and swings to the west by daybreak. When you see the Northern Cross in the east on summer evenings, it’s sideways to the horizon.

By the time northern autumn arrives, the Northern Cross is still out from nightfall until midnight, but it appears high overhead in the evening and sets in the northwest after midnight.

And when winter comes, the Northern Cross is standing upright over your northwest horizon before midnight.

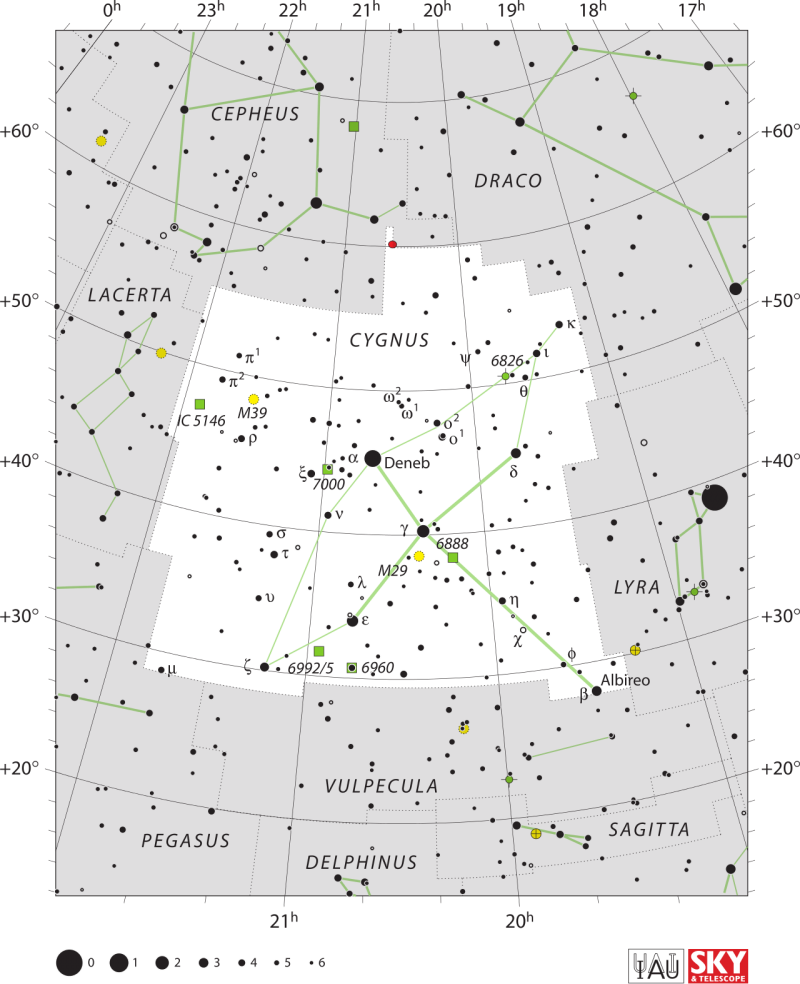
Star chart with stars in black on white with constellation Cygnus the Swan, and nearby Lyra the Harp.
The constellation Cygnus appears in the lighter area. Its primary stars make the distinct pattern of the Northern Cross. On the right of this chart you see the constellation Lyra the Harp with its brightest star, Vega. To use this chart on July or August evenings – when Cygnus is in the east – give the chart a single rotation to the left. Image via IAU and Sky & Telescope magazine (Roger Sinnott & Rick Fienberg)/ Wikimedia Commons.

Bottom line: The Northern Cross is an asterism – or recognizable pattern of stars – within the constellation Cygnus the Swan. Here’s how to find it in your sky.

The post The Northern Cross: Find the backbone of the Milky Way first appeared on EarthSky.


from EarthSky https://ift.tt/yR27TMZ

Meet Delta Scorpii, aka Dschubba, it’s a variable star

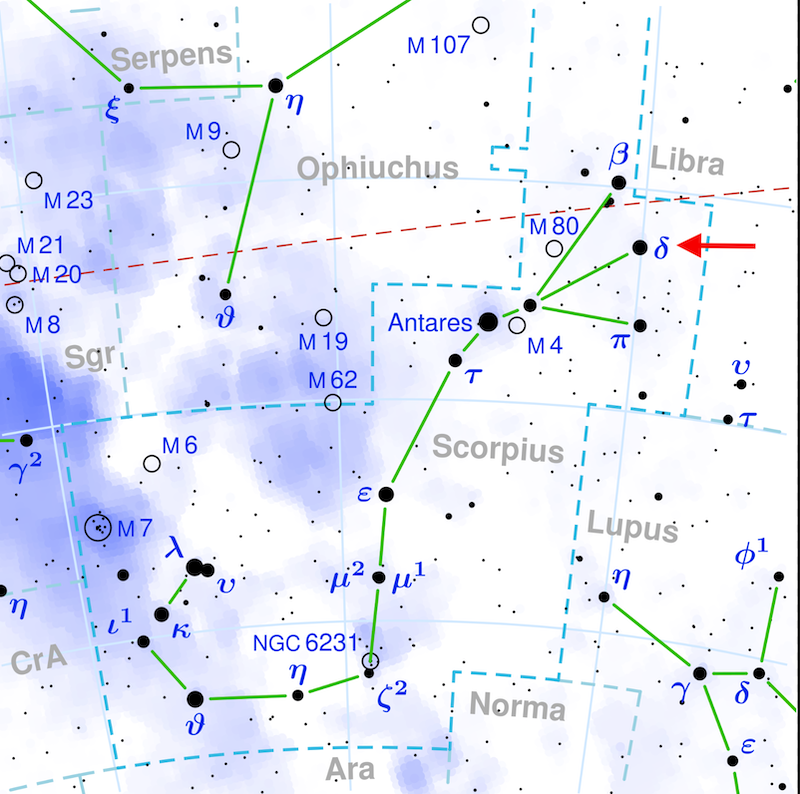
Star chart of Scorpius with green dashed lines. There are black dots for its stars and a red arrow point to Delta Scorpii
Delta Scorpii, also known as Dschubba, is in the constellation Scorpius. It’s the middle star in the little arc of 3 stars above bright red Antares, the Scorpion’s Heart. These 3 stars are called the Crown of the Scorpion. Chart via Wikimedia. Used with permission.

Finding (and pronouncing) Dschubba

Delta Scorpii – aka Dschubba – is easy to spot as the middle star in the “forehead” or Crown of the Scorpion, Scorpius. And it’s an extremely interesting star – well worth watching – unpredictably variable in a way that you can watch with your eyes alone.

On these northern summer evenings, we in the Northern Hemisphere see Scorpius and Delta Scorpii (Dschubba) in our southern sky. For Southern Hemisphere viewers, they are closer to overhead. Scorpius is an easy constellation to find, because of its curved “tail” of stars. And the brightest star in Scorpius, Antares, will catch your eyes.

To the west of Antares, you’ll find a little arc of three stars. They are tiny, but noticeable. Dschubba, the middle star, is usually the brightest of the three.

How do you pronounce Dschubba? The “D” is silent. So now we are left with “schubba”. It is two syllables, emphasizing the first: SCHUB ba. Something like “shoe ba”. Hear some pronunciations of Dschubba here.

You can also simply call the star Delta Scorpii.

Delta Scorpii: A star map of the Scorpion's Crown area, 4 bright labeled stars among others.
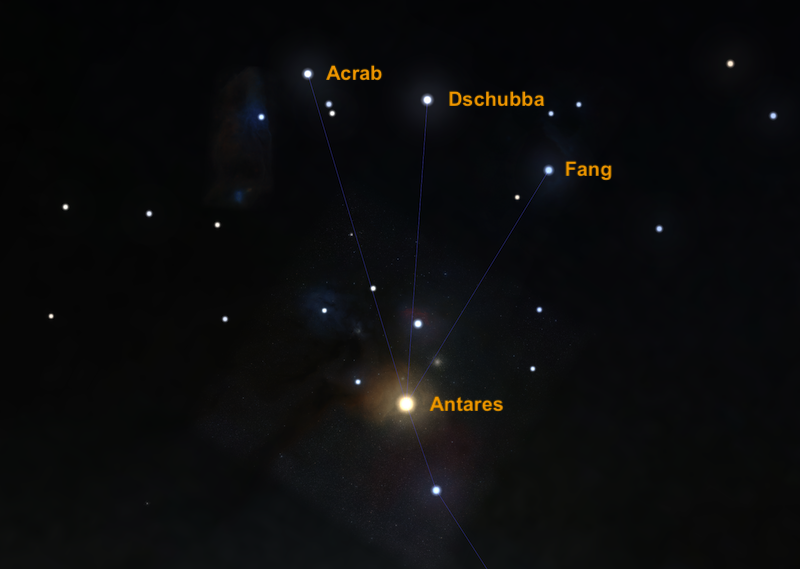
A closer look at the Scorpion’s Crown. It consists of Acrab, Delta Scorpii or Dschubba, and Fang. Also notice Antares. Image via Stellarium.

Delta Scorpii: Forehead, claw or Crown?

Delta Scorpii derives its name from the Arabic phrase meaning “the forehead” of the Scorpion. This part of the constellation is also sometimes called “the claws” of the Scorpion.

But most stargazers know that the Scorpion’s true claws once extended well beyond the boundaries of Scorpius and into the constellation of Libra. At some point, far back in the history of our sky, they clipped Scorpion’s claws to make room for Libra. Thus we now have 12 constellations of the zodiac.

The little arc of 3 stars above Antares is also called the Crown of the Scorpion.

How big and bright?

Dschubba is a moderately bright star in our sky. But it’s relatively distant at 491 light years away. The light you see beaming from Dschubba tonight left the star in the year 1533. A lot has happened here on Earth since 1533. What has the starlight been doing? Some of it has been kidnapped. There is so much dust and gas between us and the star that half of the light has been reflected and absorbed in the past 491 years. So, what we see is only half as bright as it would be if we had a clear view.

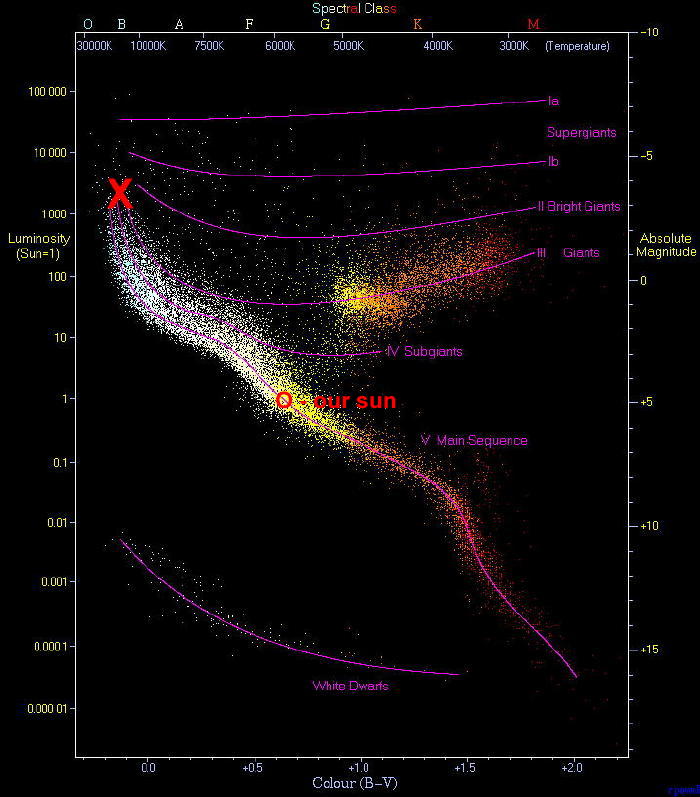
Dschubba is a type B0 star, meaning it is hot, about 22,000 Kelvin, or four times hotter than our sun. It’s a massive star too, with 13 times more mass than our sun. It’s about 7 times larger than our sun. And it’s about 14,000 brighter than the sun.

Diagram with plenty of dots. Those on the upper left are white, in the middle they are yellow and in the lower right they are purple and red.
This is the Hertzsprung–Russell diagram. It’s a plot of stars’ luminosities (true brightness) against their color. You’ll see the high-temperature blue-white stars on the left side of the diagram. You’ll see the low-temperature red stars on the right side. Near the top of the heap, Delta Scorpii, identified in the chart with an “X”, is larger, hotter, more massive, and shines far brighter than our sun. It lives among the giants. HR diagram via Wikimedia Commons.

2 types of variability

Dschubba has not one but two types of variability. First, it shows irregular small brightness variations. Those variations happen every few days and are probably due to bright spots or clouds of gas between us and the star.

The second type of variability is eruptive and unpredictable.

Dschubba is a Gamma Cassiopeiae variable star. That means it behaves like the star Gamma Cassiopeiae, the poster child for a star with these eruptive brightness changes.

Gamma Cassiopeiae – the middle star in the “W” of constellation Cassiopeia – is what’s known as an eruptive variable star. Its magnitude, or brightness, has in the past varied between a bright magnitude 1.6 and a fainter magnitude 3.0. And it spins so rapidly that it occasionally flings off material. This material forms a disk of hot gas surrounding the star near its equator.

And thus Gamma Cass brightens, not quickly, but slowly, over a few weeks to a few months. In 1937, Gamma Cassiopeiae brightened from magnitude 2.2 to 1.6 (the smaller the number, the brighter the star), then dimmed to magnitude 3.4. In the decades since, the star has slowly brightened to magnitude 2.3 again. But it has not repeated its behavior of 1937.

Only a few other such stars are known to exist, one being the star Dschubba.

An eruption disruption for Dschubba

Like Gamma Cass, Dschubba rotates quickly. At the equator it reaches a rotational speed of 112 miles per second (181 km/s). This is 90 times faster than our sun.

Astronomers believe that, occasionally, the star throws off material that forms a disk around its equator. This would be a big disk, 150 times larger than our sun. It’s this disk that causes changes in the brightness of Delta Scorpii.

At one time, Dschubba was a spectroscopic standard for the B0 IV star classification. But this variability in brightness got it removed from being a standard. You see, even stars misbehave and get kicked out of the class.

It has a companion

Dschubba is also part of a multiple-star system. It has a companion that is 10 times fainter, orbiting it every 20 days. And there is another star in this system, which might also trigger the brightness outbursts.

The second star gets as far away from the main star as our planet Saturn is from our sun. And it takes 10.8 years to orbit the main star. Every 10.8 years, the second star passes very close to Dschubba, and this passage might stir up the atmosphere of the main star, causing the main star to brighten. Or maybe not. Scientists are not sure about this; the star had an outburst that began in 2000 which may have been related to the close passage of the star. However, its passage in 2011 and 2022 didn’t have a significant outburst.

See for yourself

With the unaided eye, and within minutes, you can estimate the brightness of Delta Scorpii.

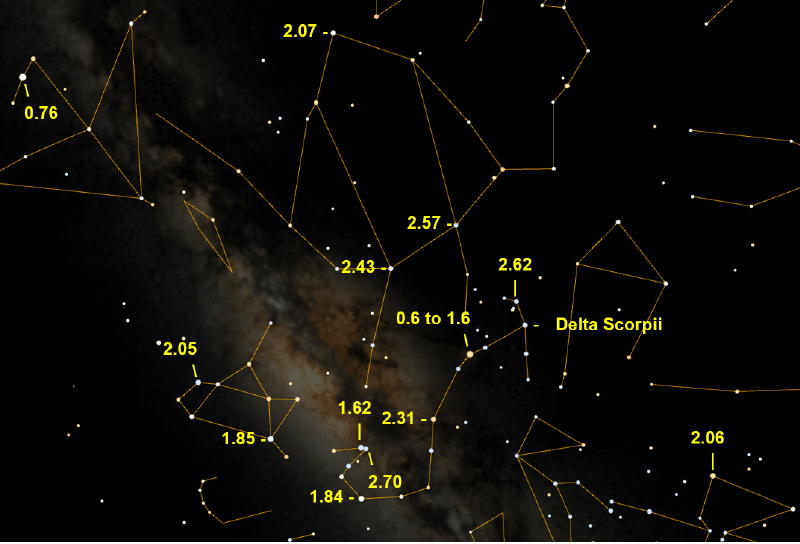
Simply compare its brightness to other stars nearly. The non-variable stars are marked on the map below. While it might be tempting to use the star Antares in your estimations, avoid it because it also varies in brightness.
Typically, Delta Scorpii is about magnitude 2.3, but it has been known to brighten up to magnitude 1.6. Remember, the higher the number, the fainter the object. So how bright is it tonight?

Black background with plenty of stars and lines that represent other constellations.
A map showing Delta Scorpii and the surrounding stars, with the magnitudes indicated. Map via Don Machholz.

A few tips

Take your time. Compare the subject star (Delta Scorpii) to each of the labeled stars on the map. Is it brighter or fainter? Keep doing that, comparing the subject star to the other stars on the map. Avoid using stars near your horizon as extinction will make them appear fainter than they appear.

When you have arrived at a number, write it down, along with the date and time. Then go out again tomorrow night and do it again. After four or five nights, you will feel comfortable making magnitude estimates. You can even send in your results to the clearinghouse for star magnitude estimates: the American Association of Variable Star Observers (AAVSO). You can submit data for free or pay a fee, join the organization, and receive a cartload of benefits. Plus, you have the satisfaction of contributing to the science of Delta Scorpii.

Bottom Line: Delta Scorpii, also known as Dschubba, is a variable star in the constellation Scorpius. With the eyes alone, you can check its brightness for yourself, and for science.

The post Meet Delta Scorpii, aka Dschubba, it’s a variable star first appeared on EarthSky.


from EarthSky https://ift.tt/yBv1KDr

Spot a fake, AI-generated image by looking at the eyes

AI-generated image: Side-by-side images of Scarlett Johansson and a young black man, with a closeup on their eyes below.
In this image, the person on the left (Scarlett Johansson) is real, while the person on the right is an AI-generated image. Look at the closeup of their eyeballs underneath their faces. The reflections in the eyeballs are consistent for the real person, but incorrect (from a physics point of view) for the fake person. Image via Adejumoke Owolabi/ Royal Astronomical Society (CC BY 4.0).
  • A way to detect deepfakes images of people has emerged from the world of astronomy. Researchers used a method of looking at galaxies to detect deepfakes. They used something called the Gini coefficient, which measures how the light in an image of a galaxy is distributed among its pixels.
  • The method can be used to examine the eyes of people in real and deepfake images (AI-generated images). If the reflections don’t match, the image is most likely fake.
  • It’s not perfect at detecting fake images. But, the researchers said, “this method provides us with a basis, a plan of attack, in the arms race to detect deepfakes.”

The Royal Astronomical Society published this original article on July 17, 2024. Edits by EarthSky.

How to spot an AI-generated image with science

In an era when the creation of artificial intelligence (AI) images is at the fingertips of the masses, the ability to detect fake pictures – particularly deepfakes of people – is becoming increasingly important.

So what if you could tell just by looking into someone’s eyes?

That’s the compelling finding of new research shared at the Royal Astronomical Society’s National Astronomy Meeting in Hull, U.K., which suggests that AI-generated fakes can be spotted by analyzing human eyes in the same way that astronomers study pictures of galaxies.

The crux of the work, by University of Hull M.Sc. student Adejumoke Owolabi, is all about the reflection in a person’s eyeballs.

If the reflections match, the image is likely to be that of a real human. If they don’t, they’re probably deepfakes.

Kevin Pimbblet is professor of astrophysics and director of the Centre of Excellence for Data Science, Artificial Intelligence and Modelling at the University of Hull. Pimbblet said:

The reflections in the eyeballs are consistent for the real person, but incorrect (from a physics point of view) for the fake person.

Like stars in their eyes

Researchers analyzed reflections of light on the eyeballs of people in real and AI-generated images. They then employed methods typically used in astronomy to quantify the reflections and checked for consistency between left and right eyeball reflections.

Fake images often lack consistency in the reflections between each eye, whereas real images generally show the same reflections in both eyes. Pimbblet said:

To measure the shapes of galaxies, we analyze whether they’re centrally compact, whether they’re symmetric, and how smooth they are. We analyze the light distribution.

We detect the reflections in an automated way and run their morphological features through the CAS [concentration, asymmetry, smoothness] and Gini indices to compare similarity between left and right eyeballs.

The findings show that deepfakes have some differences between the pair.

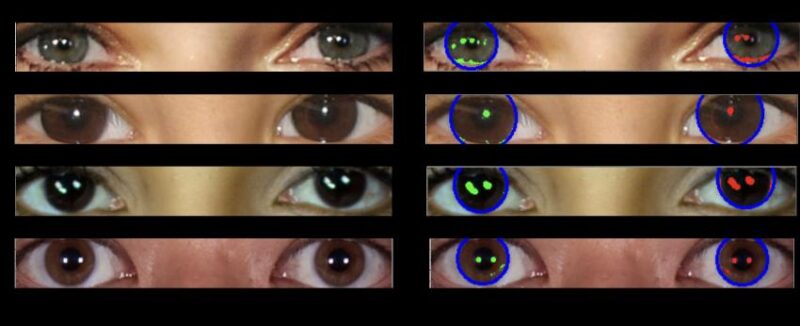
On the left are 4 pairs of eyes, and on the right is an analysis of the reflections in the eyes.
Here’s a series of deepfake eyes, showing inconsistent reflections in each eye. Image via Adejumoke Owolabi/ Royal Astronomical Society.
4 pairs of eyes on the left with shading showing matching reflections on the right.
Here’s a series of real eyes, showing largely consistent reflections in both eyes. Image via Adejumoke Owolabi/ Royal Astronomical Society.

Distribution of light

The Gini coefficient is normally used to measure how the light in an image of a galaxy is distributed among its pixels. Astronomers make this measurement by ordering the pixels that make up the image of a galaxy in ascending order by flux. Then they compare the result to what would be expected from a perfectly even flux distribution.

A Gini value of 0 is a galaxy in which the light is evenly distributed across all of the image’s pixels. A Gini value of 1 is a galaxy with all light concentrated in a single pixel.

The team also tested CAS parameters, a tool originally developed by astronomers to measure the light distribution of galaxies to determine their morphology, but found it was not a successful predictor of fake eyes. Pimbblet said:

It’s important to note that this is not a silver bullet for detecting fake images.

There are false positives and false negatives; it’s not going to get everything. But this method provides us with a basis, a plan of attack, in the arms race to detect deepfakes.

Side-by-side images of the scientists, a black woman with long hair and a blue top and a man with sandy hair and glasses.
Not AI-generated. Technology researcher Adejumoke Owolabi (left) and observational astronomer Kevin Pimbblet (right) of the University of Hull. Images via LinkedIn and University of Hull.

Bottom line: A method astronomers use to measure light from galaxies can also be used to tell whether a photo of someone is real or a deepfake AI-generated image.

Via Royal Astronomical Society

Read more: Is AI to blame for our failure to find alien civilizations?

The post Spot a fake, AI-generated image by looking at the eyes first appeared on EarthSky.


from EarthSky https://ift.tt/AOeFYJj

Precise space storm alerts could help shield Earth’s tech

Space storm alerts: Three views of the sun, one with a large flare, one with an active region in 2 wavelengths and one with the sun's disk covered and rays streaming outward.
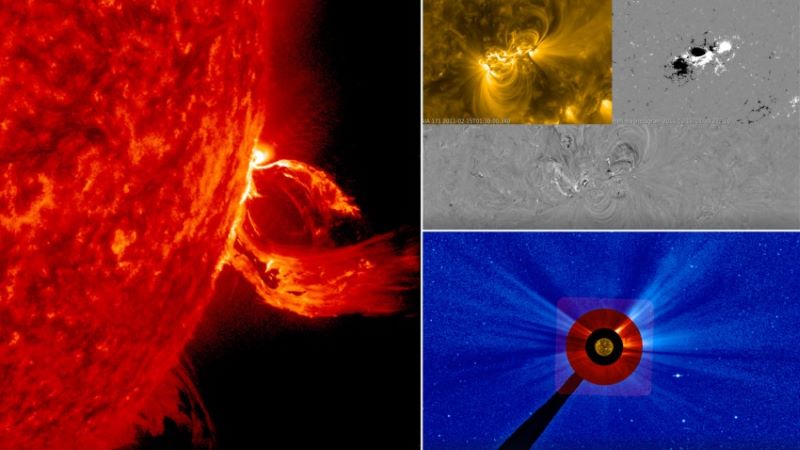
Scientists say it is now possible to predict the precise speed a coronal mass ejection (shown left in an artist’s impression) is traveling at and when it will smash into Earth (bottom right moving in our direction). And that’s even before it has fully erupted from the sun (top right). The new insights will help create more accurate space storm alerts for Earth. Image via NASA Goddard Space Flight Center/ JHelioviewer/ Royal Astronomical Society.
  • When space storms hit Earth, they can damage power grids and disrupt communications. Our sun is now at the peak of its 11-year cycle, sending more plasma and radiation our way.
  • Scientists said new insight into active regions on the sun will allow precise space storm alerts. By understanding the height at which a magnetic field becomes unstable leading to an ejection of sun stuff, they can now predict the speed of that ejecta and when it will hit Earth.
  • Being able to analyze these active regions in three dimensions means scientists can provide crucial warnings, which will help protect technology back on Earth.

The Royal Astronomical Society published this original article on July 19, 2024. Edits by EarthSky.

Studying active regions on the sun

Space storms could soon be forecast with greater accuracy than ever before thanks to a big leap forward in our understanding of exactly when a violent solar eruption may hit Earth. Scientists say it is now possible to predict the precise speed a coronal mass ejection (CME) is traveling at and when it will smash into our planet … even before it has fully erupted from the sun.

CMEs are bursts of gas and magnetic fields spewed into space from the solar atmosphere. They can cause geomagnetic storms that have the potential to wreak havoc with terrestrial technology in Earth’s orbit and on its surface. That’s why experts across the globe are striving to improve space weather forecasts.

Advancements such as this one could make a huge difference in helping to protect infrastructure that is vital to our everyday lives, according to researchers at Aberystwyth University in Wales. They presented their findings on July 19, 2024, at the Royal Astronomical Society’s National Astronomy Meeting in Hull, U.K.

The scientists made their discovery after studying specific areas on the sun called active regions. Active regions have strong magnetic fields where CMEs are born. The researchers monitored how these areas changed in the periods before, during and after an eruption.

Diagram of pink circle with lines around it like an hourglass, then pink circle with concentric circles inside and then a red balloon shape with green around it.
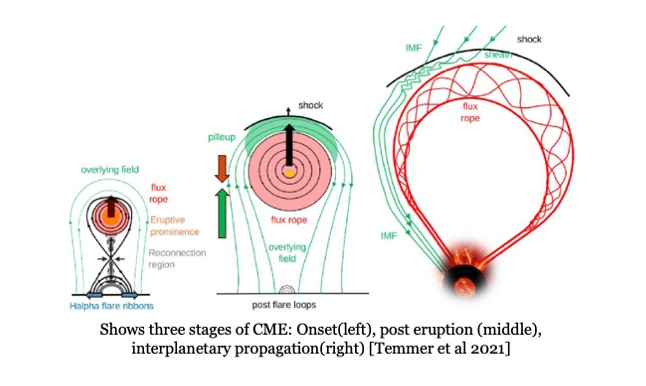
The different stages of a coronal mass ejection, from onset (left), to post-eruption (middle) and travel toward objects like Earth in our solar system (right). Image via Temmer et al. 2021/ Royal Astronomical Society (CC BY 4.0).

Critical height of active regions

A vital aspect they looked at was the “critical height” of the active regions. This is the height at which the magnetic field becomes unstable and can lead to a CME.

Lead researcher Harshita Gandhi of Aberystwyth University said:

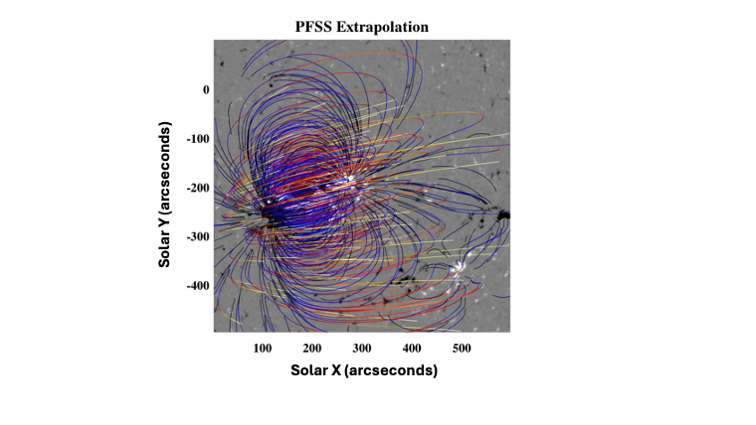
By measuring how the strength of the magnetic field decreases with height, we can determine this critical height.

This data can then be used along with a geometric model which is used to track the true speed of CMEs in three dimensions, rather than just two, which is essential for precise predictions.

Our findings reveal a strong relationship between the critical height at CME onset and the true CME speed.

This insight allows us to predict the CME’s speed and, consequently, its arrival time on Earth, even before the CME has fully erupted.

A graph showing dense loops in blue, red and yellow.
Magnetic field lines at different heights above the photosphere extrapolated using Green’s function approach as seen from top to bottom. Image via Harshita Gandhi/ Royal Astronomical Society.

Gaining knowledge toward more precise space storm alerts

When these CMEs hit the Earth they can trigger a geomagnetic storm. Geomagnetic storms are capable of producing stunning auroras, often referred to in the Northern Hemisphere as the Northern Lights.

But the storms also have the potential to disrupt vital systems we rely on daily, including satellites, power grids and communication networks. And that’s why scientists worldwide are working hard to improve our ability to better predict when CMEs will hit Earth.

This requires knowing a more accurate speed of the CME shortly after it erupts from the sun to better provide advance warnings of when it will reach our planet.

Accurate speed predictions enable better estimates of when a CME will reach Earth, providing crucial advance warnings. Gandhi said:

Understanding and using the critical height in our forecasts improves our ability to warn about incoming CMEs, helping to protect the technology that our modern lives depend on.

Our research not only enhances our understanding of the sun’s explosive behavior but also significantly improves our ability to forecast space weather events.

This means better preparation and protection for the technological systems we rely on every day.

Bottom line: A new understanding of the heights of unstable magnetic fields in active regions on the sun will lead to more precise space storm alerts, helping to protect technology on Earth.

Via Royal Astronomical Society

Read more: Are solar storms dangerous to us on Earth?

The post Precise space storm alerts could help shield Earth’s tech first appeared on EarthSky.


from EarthSky https://ift.tt/JA47ngN

Here are the US cities most vulnerable to space weather

US cities most vulnerable: Map of the US with red dots showing population and a green ring around Chicago/Milwaukee and a blue one around the DC area.
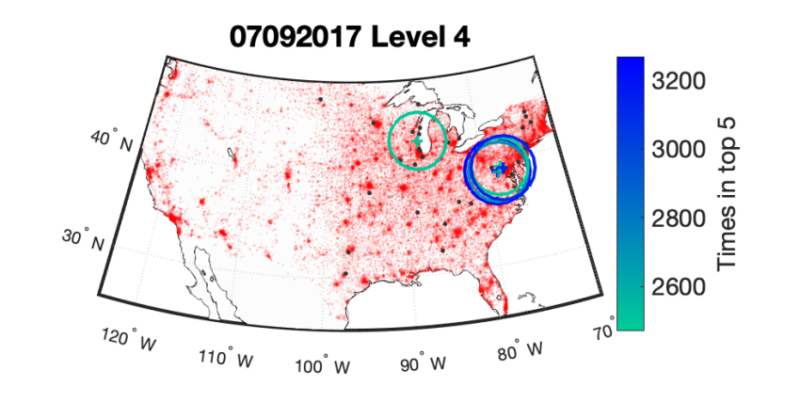
Here’s a map showing the US cities most vulnerable to space weather. The rings on the map indicate transformers that are most ‘connected’ to the network and that may therefore be the most vulnerable during stormy space weather. Image via British Geological Survey/ Royal Astronomical Society (CC BY 4.0).
  • Washington, D.C., and Milwaukee are two of the most vulnerable U.S. cities to space weather, according to scientists from the British Geological Survey.
  • The scientists are still unsure of all the reasons why these cities are more vulnerable, but their transformers are highly connected to the network. However, there are other factors that may also play a role.
  • Some of the other reasons that might make these cities vulnerable include the electrical conductivity of the ground, the physical construction of the power grid in those areas, or the location of the auroral currents in the sky.

The Royal Astronomical Society published this original article on July 19, 2024. Edits by EarthSky.

The US cities most vulnerable to space weather

Several cities in the United States – including the nation’s capital – have power grids particularly vulnerable to the threat of space weather. But experts are still trying to understand why. Researchers at the British Geological Survey (BGS) found that certain regions of the U.S. are more at risk from geomagnetic storms. These are storms that occur when the sun spits out solar flares and coronal mass ejections (CMEs).

CMEs are bursts of gas and magnetic fields which erupt into space from the solar atmosphere. They can cause geomagnetic storms that have the potential to damage infrastructure both in Earth’s orbit and on its surface, ranging from satellites to underground pipelines.

Two of the cities with power grids found to be most vulnerable to the effects of such space weather are Washington, D.C., and Milwaukee. That’s according to Lauren Orr of the BGS, who presented her findings at last week’s National Astronomy Meeting at the University of Hull. Orr said:

We have identified certain regions of the U.S. (the Washington, D.C., area and Milwaukee), which are repeatedly appearing as ‘highly connected’ in our network. Hence they are possibly regions particularly vulnerable to the effects of space weather and may benefit from further monitoring.

Orr added there were “many reasons” the cities may be more at risk to the impact of geomagnetic storms. Those include:

… electrical conductivity of the ground, the physical construction of the power grid in those areas, or the location of the auroral currents in the sky.

However, she cautioned that further work is necessary to investigate what about these areas makes them so-called supernodes in the network.

Space storms’ impacts on Earth

Severe space weather is of growing concern to scientists across the globe. In fact, it’s now considered to be as likely to occur as a pandemic, with an impact that is equivalent to extreme temperatures or flooding.

Geomagnetically induced currents (GICs) are one such hazard that can cause damage to power lines and transformers. In the past, widespread blackouts have resulted from transformer damage during geomagnetic storms. Orr explained:

Network science is now a common tool to quantify the resilience and robustness of power grids to both deliberate attacks and those caused by random failures or natural disasters.

Map of Eastern US with large circles over some cities and blue lines between them.
A snapshot of the geomagnetically induced current (GIC) network during an intense solar storm in September 2017. Image via British Geological Survey/ Royal Astronomical Society (CC BY 4.0).

Networks and nodes

A network is made up of nodes and edges, which could be anything from computers linked via the internet, to friends on Facebook, or transformers linked via cables. Orr said:

Having previously had great success using network science to uncover patterns within the auroral electrojet, we would again combine the fields of network science and space weather to capture the network response to GICs.

By applying known reliability parameters to the GIC network we can identify areas or transformers at high risk.

This is important, she added, because:

… these areas could be modified during a geomagnetic storm to prevent transformers burning out and to limit damage to the wider power grid.

The work has been carried out in collaboration with Sandra Chapman, of the University of Warwick, and Ryan McGranaghan, of NASA’s Jet Propulsion Laboratory in California.

Bottom line: Scientists have identified some U.S. cities that may be more vulnerable to space weather due to how connected their transformers are to the network.

Via Royal Astronomical Society

Watch: Will solar flares take down our electric grids?

Read more: Geomagnetic storms: Will you lose power where you live?

The post Here are the US cities most vulnerable to space weather first appeared on EarthSky.


from EarthSky https://ift.tt/T7eoQth

Sea urchins are colorful and resistant: Lifeform of the week

Sea urchins are spiny sea creatures that are a part of one of the best-preserved groups of animals in the fossil record. They’ve been around for some 200 million years, so they must be doing something right. Their preservation in the fossil record is thanks to their mega-hard shells. And sea urchins are still considered animals despite their lack of brains or blood.

What are sea urchins?

Sea urchins are echinoderms, that is, marine invertebrate animals. The famous starfish (or sea star) and sea cucumbers also belong to this group. There are around 950 species of sea urchins.

You can find sea urchins in a wide range of colors, from red to purple and green, making them one of the most visible and striking marine animals on the seafloor.

Sea urchins live in groups of five to ten individuals among rocks and on the seabed. The life expectancy of these animals often exceeds 30 years, but scientists have found specimens over 200 years old. Amazing!

3 balls covered in short spikes among corals. The one in the middle is orange and the other 2 are blue.
Sea urchins possess a wide range of colors. They live in groups among rocks and on the seafloor. Image via Marino Linic/ Unsplash.

The eye-catching structure of the sea urchin

The sea urchin looks like a ball, so you might wonder where its mouth is. You can’t see it because it’s on the bottom of its body. So what’s that opening at the top? That’s its anus.

Sea urchins don’t have brains. Instead, they have simple nerves that reach throughout the body and radiate from a neural ring around the mouth. These nerves allow them to control all parts of their body, in addition to giving them the sense of touch.

An average sea urchin is small, measuring about 1.2 to 4 inches (3 to 10 cm) in diameter. However, the largest species can reach 6.7 inches (17 cm).

Many pink and white striped spikes surround a ball-shaped creature.
Sea urchins look like balls. They are covered by a hard shell and spines. On the top, you can find the anus, and on the bottom, the mouth. Image via William Warby/ Pexels.

How hard is a sea urchin?

Sea urchins’ internal organs are protected by a skeleton made of calcareous plates (made of calcium carbonate). The plates fuse together to form a hard, compact shell from which sharp spines protrude.

This structure made of small segments of plates almost completely covers the animal (except for the mouth and anus). This is their main form of protection. However, this skeleton is quite heavy, which makes them slow animals.

A curious fact about these structures is that you can divide them into two exactly equal halves. And when they become adults, they develop five-fold symmetry, meaning you can divide their bodies into five exact sections.

Flattish, white, round shell with 5 radial dark portions separating 5 light portions.
Small segments of plates almost completely cover sea urchins. This shell is very hard and heavy. It can also be divided into 5 equal parts. Image via Milada Vigerova/ Unsplash.

Sea urchins have tentacles

Slowly but surely, the sea urchin does indeed move. However, it does so little by little due to the great weight of its shell.

These creatures move using so-called tube feet. These are a type of tentacle with thick and muscular walls found between the animal’s spines. These tentacles end in suction cups that allow them to move, adhere to surfaces and capture prey.

Even the sea urchins’ spines and mouths themselves serve to grip and move. Additionally, the spines move in all directions.

Another fascinating fact about sea urchins is they have the ability to regenerate their spines and tentacles.

Round animal covered with many very long, needle-like pink and purple spikes.
Sea urchins have tentacles among the spines. They use them to move, adhere to surfaces and capture prey. Image via Coral Grandbois/ Pexels.

Are their spines poisonous?

The tips of sea urchins’ spines have pincers that allow them to remain in the skin. If you’re ever stung by a sea urchin, stay calm, try to remove the spines as soon as possible, keep the sting area clean, and seek medical help if the pain persists for several days.

It is important to remove the spines because if they break, they can migrate to deeper tissues and touch bone or nerves. In this case, the spines would have to be removed surgically.

While some species are venomous, their stings are not fatal. If the spines are removed promptly so that the venom does not spread further and the wound is thoroughly cleaned, this should be sufficient treatment.

Despite their beauty, you have to be especially careful with flower sea urchins, as they are one of the most dangerous types. These are found in the Indian Ocean. Their body appears to be covered in white, pink and beige flowers. But the poisonous spines are short and well camouflaged, so their appearance is similar to that of small flowers.

There are very few documented deaths from this type of sea urchin, but what is certain is that death is not caused by the venom itself, but by drowning due to the shock and paralyzing effects from the venom.

A group of black balls with many extremely long spikes on the seafloor.
Some sea urchin spines are long and others are short. Some are venomous and other aren’t. Image via Stefan Sebök/ Unsplash.

Where they live, predators and food

Sea urchins live in all oceans, although they are found to a lesser extent in the polar regions. Thus, it’s more common to see them in temperate and tropical areas among rocks and reefs or on the seafloor up to 1.5 miles (2,500 m) deep.

Although resistant, they still become meals for seabirds and fish, otters, lobsters, crabs, starfish and even foxes. And of course, they can’t escape human cooking pots …

The sea urchin is very important when it comes to maintaining a certain balance in the sea. That’s thanks to its eating habits, because it is an opportunistic and omnivorous animal. Basically, it feeds on what it finds in greatest abundance.

In general, sea urchins feed on algae, small animals, mussels, sponges and barnacles. However, on some occasions they even eat dead animals deposited at the bottom of the sea.

A yellow starfish shell to the side, and 3 round, flattish, pastel sea urchin shells stacked up.
Sea urchins live in all oceans. They’ve been around for some 200 million years ago, and their hard shells preserve well in the fossil record. Sea urchins are important for maintaining a certain balance in the sea. Image via Nika Benedictova/ Unsplash.

How do sea urchins reproduce?

Sea urchins reproduce sexually. The female releases millions of tiny eggs into the water that will later be fertilized by the male’s sperm.

The tiny eggs of the sea urchins float for a few months among the plankton. The young urchins will remain in the plankton for between two and five years, depending on the species, and then descend to the seabed. They reach sexual maturation at five years of age.

White animal with very many red-orange legs and spikes covering all of them and also the body.
Sea urchins reproduce sexually. The female releases tiny eggs into the water that are fertilized by the male’s sperm. Image via Geoff Trodd/ Unsplash.

Bottom line: Sea urchins possess mega-hard shells. They’ve been around for some 200 million years. And they’re considered an animal even with no brains or blood.

Otters are cute! They’re our lifeform of the week

Sea turtles are as old as dinosaurs: Lifeform of the week

The post Sea urchins are colorful and resistant: Lifeform of the week first appeared on EarthSky.


from EarthSky https://ift.tt/nCwtlHu