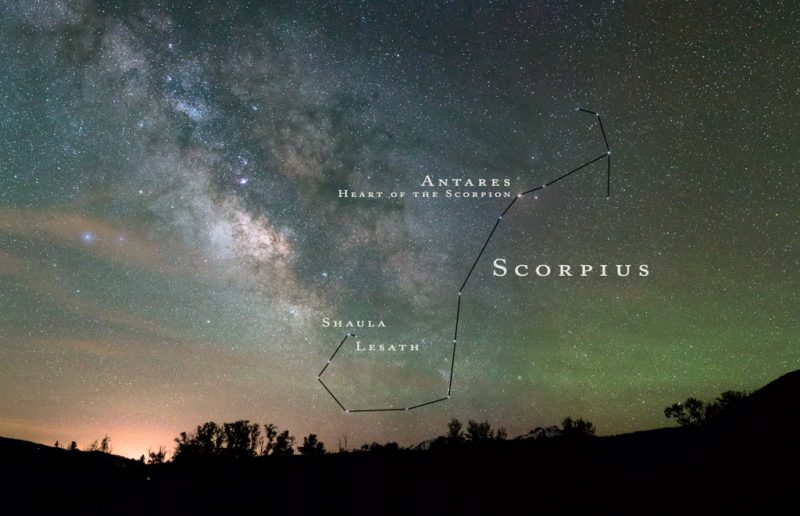
View larger. | Constellation Scorpius by Daniel McVey. The bright red star Antares represents the Scorpion’s Heart. The Stinger stars – Shaula and Lesath – can be found at the end of the Scorpion’s curved Tail.
The zodiacal constellation Scorpius the Scorpion is one of the few constellations that look like their names. It has a graceful, J-shaped pattern of stars resembling a real scorpion’s curved tail. At the end of this graceful line of stars are two stars noticeable for their nearness to each other. They are Shaula and Lesath, and they represent the Stinger of the Scorpion. It’s fun to see the curved tail of Scorpius, and Shaula and Lesath make a perfect celestial Stinger!
Shaula and Lesath appear close together. But they’re only close along our line of sight. In reality, these two stars are separated by a few tens of light-years.
Shaula, the second-brightest star in the constellation Scorpius, is actually a triple star system.
Lesath, the fainter star of the Stinger pair, doesn’t have any known companions, so far.
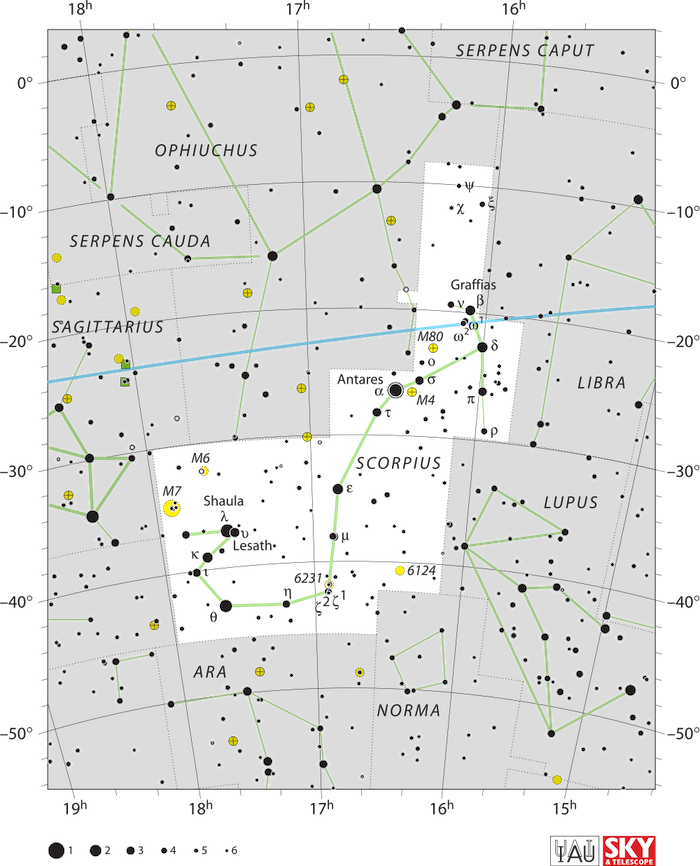
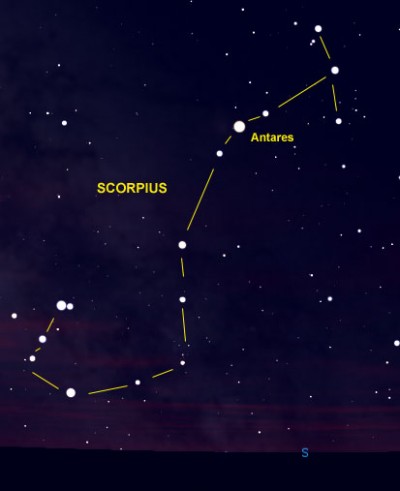
A map of Scorpius showing the location of the Stinger stars, Shaula and Lesath, at the tip of the Scorpion’s curved tail. Image via IAU/ Sky & Telescope/ Wikimedia Commons.
How to see Shaula and Lesath. The best time to see Scorpius and its stinger stars in the evening sky is during the Northern Hemisphere summer and early autumn. In the Southern Hemisphere, these stars are a feature of winter and spring.
Shaula is the second-brightest star in the constellation Scorpius, after Antares. Shaula is also the 24th brightest star in the sky. But it’s hard to think of Shaula without Lesath. These two stars are very noticeable on the sky’s dome – glittering together brighter than most other stars, and conspicuously located in an easy-to-see constellation.
From the Northern Hemisphere, Scorpius will be in your southern sky; in that case, Shaula is the star on the left. Shaula is also the brighter of the two stars. These two noticeable stars are sometimes referred to as the Stinger of Scorpius, and sometimes as the Cat’s Eyes.
At mid-northern latitudes, Lesath and Shaula never climb very high in the sky. They are highest in the sky when they’re due south. Even then, from the northern U.S., Scorpius’ stinger stars are barely a fist-width above your horizon (hold your fist an arm’s length away). They are higher in the sky as seen from the southern U.S., where Scorpius becomes a glorious sight. And from the Southern Hemisphere, all of Scorpius prominently arcs high overhead.
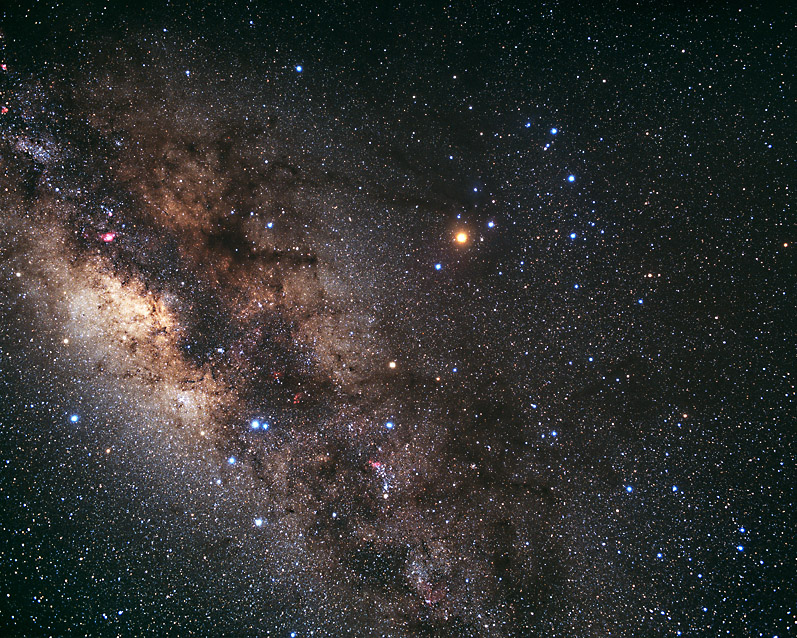
The constellation Scorpius with the Milky Way in the background. The bright reddish star is Antares. Shaula and Lesath are at the end of the J-shaped constellation, the scorpion’s stinger. Image via Akira Fujii/ David Malin Images.
Shaula and Lesath throughout the year. In the Northern Hemisphere, Scorpius is highest in the evening sky and is therefore thought of as a summer constellation. In the Southern Hemisphere, it’s considered a winter constellation.
For both hemispheres, Scorpius and its stinger stars are highest in the sky around midnight local time in mid-June. By mid-July, Lesath and Shaula are at their highest in the sky around 10 p.m. For mid-August, it’s around 8 p.m. And by mid-September, 6 p.m. Remember, the time will vary by up to an hour, depending on how far east or west you are in your time zone.
Science of Shaula and Lesath. Although these two stars look like a close-knit pair, they’re actually far apart in space. Shaula is about 570 light-years distant, whereas Lesath is some 580 light-years away. Like all individual stars we see in our night sky, these two are members of our Milky Way galaxy.
Shaula, also known as Lambda Scorpii, is actually a triple system. The largest star, which has a blue-white color, is about nine times the sun’s diameter and 14 times the sun’s mass. It is a Beta Cephei variable star, a class of stars characterized by rapid but small variations in brightness. There’s another blue-white star in that system. It’s over ten times the sun’s mass and almost five times its diameter. The third object in the system is what’s known as a pre-main sequence star, an object that has enough mass from the surrounding dust and gas to become a star but has not started nuclear fusion at its core, which would define it as a star.
Lesath’s other name is Upsilon Scorpii. It is also a hot blue-white star, about 11 times the sun’s mass and six times its diameter.
On a dark, moonless night, you can see a glowing band of stars running from Scorpius’ tail and upward through the Summer Triangle. It’s called the Milky Way, a roadway of stars arcing across the sky from horizon to horizon in northern summer. What you’re actually seeing is the edgewise view of our galaxy’s flat disk. The “haze” is really the combined light of millions upon millions of stars.
Earth has an equator, and the Milky Way galaxy does, too. The galactic equator runs through Scorpius and also its neighboring constellation to the east – Sagittarius the Archer.
And now shift your perspective from our great galaxy to our own local solar system, our sun’s family in space. The ecliptic is our sun’s annual path in front of the background stars, and it also runs through Scorpius and Sagittarius. Check out the star chart below to see the whereabouts of the ecliptic with respect to this constellation.
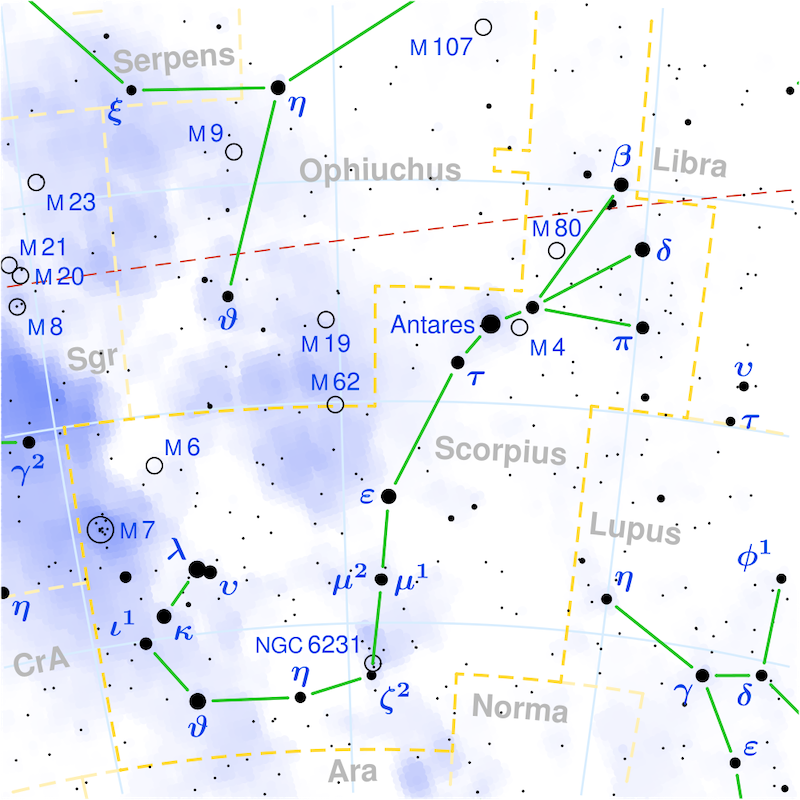
A map of the constellation Scorpius with a red dashed line showing the position of the ecliptic. The areas shaded in blue represent the Milky Way. Image via Torsten Bronger/ Wikimedia Commons.
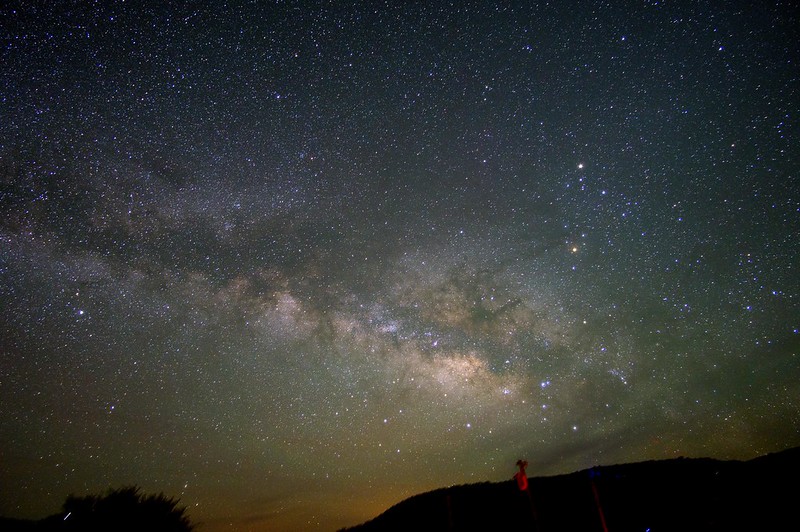
The Milky Way galaxy runs through Sagittarius and Scorpius. This image, taken in West Texas, is a long exposure that brings out the colors in the Milky Way. If you were to view it at a dark location with the unaided eye, the Milky Way will appear exactly as its name describes, a faint milky glow across the sky. Can you pick out the scorpion’s stinger in this image? (Hint: look at the lower right of the image.) Image via Rob Pettengill/ Flickr.
History of the names Shaula and Lesath. Shaula is an Arabic name meaning The Scorpion’s Stinger. Lesath’s name is less straightforward. According to Paul Kunitach and Tim Smart, authors of “A Dictionary of Modern Star Names,” the name Lesath is the final result of a long and convoluted history, initially derived from a Greek word meaning a (foggy) conglomeration.
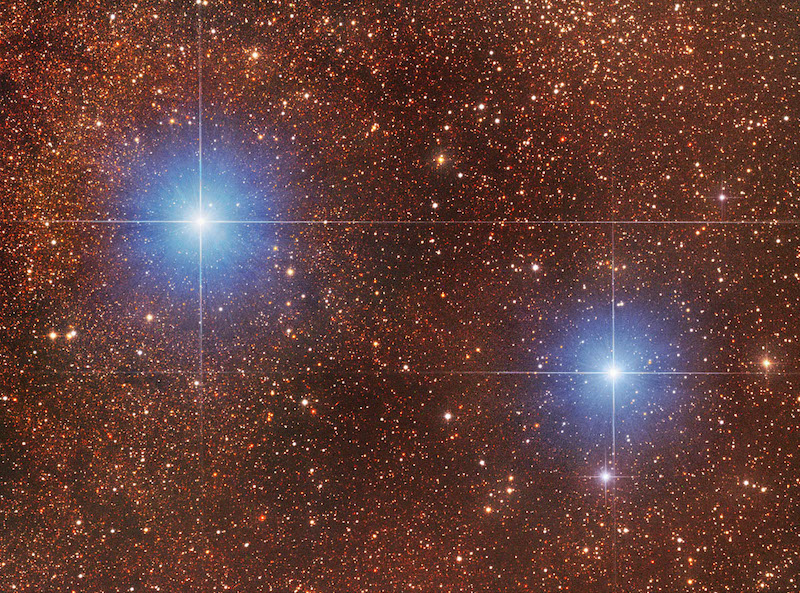
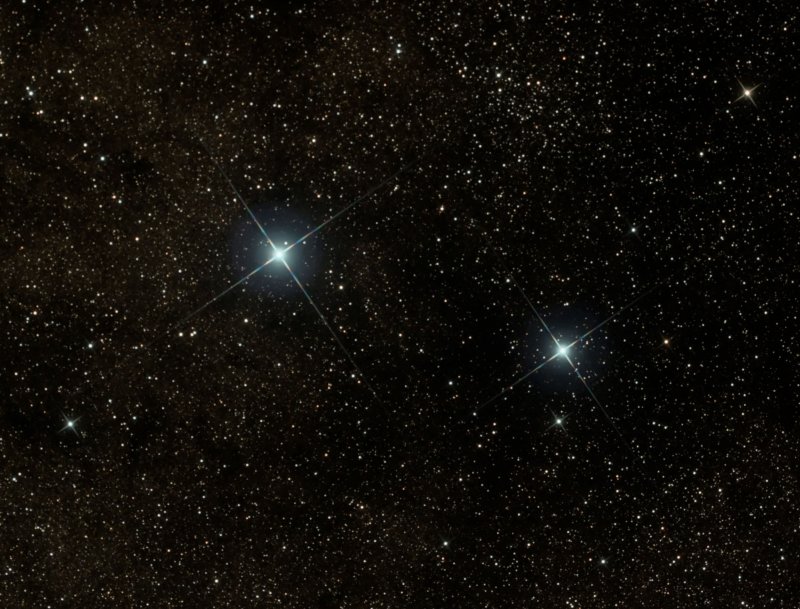
Shaula and Lesath, Scorpius’ stinger stars. Shaula is a triple system with 2 young blue-white stars that are not resolved in this image. Lesath is a single blue-white star. Even though they appear close in the sky, they are actually many light-years apart. Image via Sergio Eguivar.
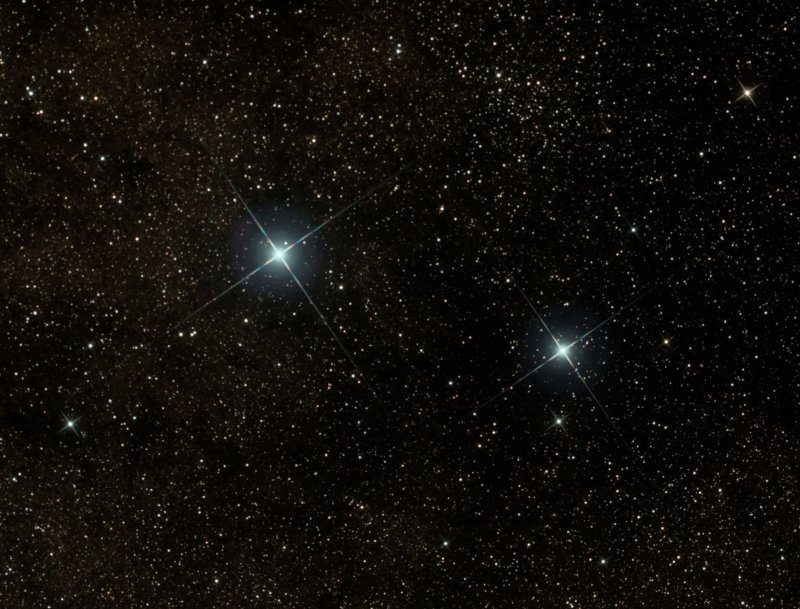
Another beautiful shot of Shaula and Lesath. Image via John Glossop.
Bottom line: Shaula and Lesath, known as the “stinger stars,” mark the location of the scorpion’s stinger in the zodiacal constellation Scorpius.
from EarthSky https://ift.tt/3jDehkl
View larger. | Constellation Scorpius by Daniel McVey. The bright red star Antares represents the Scorpion’s Heart. The Stinger stars – Shaula and Lesath – can be found at the end of the Scorpion’s curved Tail.
The zodiacal constellation Scorpius the Scorpion is one of the few constellations that look like their names. It has a graceful, J-shaped pattern of stars resembling a real scorpion’s curved tail. At the end of this graceful line of stars are two stars noticeable for their nearness to each other. They are Shaula and Lesath, and they represent the Stinger of the Scorpion. It’s fun to see the curved tail of Scorpius, and Shaula and Lesath make a perfect celestial Stinger!
Shaula and Lesath appear close together. But they’re only close along our line of sight. In reality, these two stars are separated by a few tens of light-years.
Shaula, the second-brightest star in the constellation Scorpius, is actually a triple star system.
Lesath, the fainter star of the Stinger pair, doesn’t have any known companions, so far.
A map of Scorpius showing the location of the Stinger stars, Shaula and Lesath, at the tip of the Scorpion’s curved tail. Image via IAU/ Sky & Telescope/ Wikimedia Commons.
How to see Shaula and Lesath. The best time to see Scorpius and its stinger stars in the evening sky is during the Northern Hemisphere summer and early autumn. In the Southern Hemisphere, these stars are a feature of winter and spring.
Shaula is the second-brightest star in the constellation Scorpius, after Antares. Shaula is also the 24th brightest star in the sky. But it’s hard to think of Shaula without Lesath. These two stars are very noticeable on the sky’s dome – glittering together brighter than most other stars, and conspicuously located in an easy-to-see constellation.
From the Northern Hemisphere, Scorpius will be in your southern sky; in that case, Shaula is the star on the left. Shaula is also the brighter of the two stars. These two noticeable stars are sometimes referred to as the Stinger of Scorpius, and sometimes as the Cat’s Eyes.
At mid-northern latitudes, Lesath and Shaula never climb very high in the sky. They are highest in the sky when they’re due south. Even then, from the northern U.S., Scorpius’ stinger stars are barely a fist-width above your horizon (hold your fist an arm’s length away). They are higher in the sky as seen from the southern U.S., where Scorpius becomes a glorious sight. And from the Southern Hemisphere, all of Scorpius prominently arcs high overhead.
The constellation Scorpius with the Milky Way in the background. The bright reddish star is Antares. Shaula and Lesath are at the end of the J-shaped constellation, the scorpion’s stinger. Image via Akira Fujii/ David Malin Images.
Shaula and Lesath throughout the year. In the Northern Hemisphere, Scorpius is highest in the evening sky and is therefore thought of as a summer constellation. In the Southern Hemisphere, it’s considered a winter constellation.
For both hemispheres, Scorpius and its stinger stars are highest in the sky around midnight local time in mid-June. By mid-July, Lesath and Shaula are at their highest in the sky around 10 p.m. For mid-August, it’s around 8 p.m. And by mid-September, 6 p.m. Remember, the time will vary by up to an hour, depending on how far east or west you are in your time zone.
Science of Shaula and Lesath. Although these two stars look like a close-knit pair, they’re actually far apart in space. Shaula is about 570 light-years distant, whereas Lesath is some 580 light-years away. Like all individual stars we see in our night sky, these two are members of our Milky Way galaxy.
Shaula, also known as Lambda Scorpii, is actually a triple system. The largest star, which has a blue-white color, is about nine times the sun’s diameter and 14 times the sun’s mass. It is a Beta Cephei variable star, a class of stars characterized by rapid but small variations in brightness. There’s another blue-white star in that system. It’s over ten times the sun’s mass and almost five times its diameter. The third object in the system is what’s known as a pre-main sequence star, an object that has enough mass from the surrounding dust and gas to become a star but has not started nuclear fusion at its core, which would define it as a star.
Lesath’s other name is Upsilon Scorpii. It is also a hot blue-white star, about 11 times the sun’s mass and six times its diameter.
On a dark, moonless night, you can see a glowing band of stars running from Scorpius’ tail and upward through the Summer Triangle. It’s called the Milky Way, a roadway of stars arcing across the sky from horizon to horizon in northern summer. What you’re actually seeing is the edgewise view of our galaxy’s flat disk. The “haze” is really the combined light of millions upon millions of stars.
Earth has an equator, and the Milky Way galaxy does, too. The galactic equator runs through Scorpius and also its neighboring constellation to the east – Sagittarius the Archer.
And now shift your perspective from our great galaxy to our own local solar system, our sun’s family in space. The ecliptic is our sun’s annual path in front of the background stars, and it also runs through Scorpius and Sagittarius. Check out the star chart below to see the whereabouts of the ecliptic with respect to this constellation.
A map of the constellation Scorpius with a red dashed line showing the position of the ecliptic. The areas shaded in blue represent the Milky Way. Image via Torsten Bronger/ Wikimedia Commons.
The Milky Way galaxy runs through Sagittarius and Scorpius. This image, taken in West Texas, is a long exposure that brings out the colors in the Milky Way. If you were to view it at a dark location with the unaided eye, the Milky Way will appear exactly as its name describes, a faint milky glow across the sky. Can you pick out the scorpion’s stinger in this image? (Hint: look at the lower right of the image.) Image via Rob Pettengill/ Flickr.
History of the names Shaula and Lesath. Shaula is an Arabic name meaning The Scorpion’s Stinger. Lesath’s name is less straightforward. According to Paul Kunitach and Tim Smart, authors of “A Dictionary of Modern Star Names,” the name Lesath is the final result of a long and convoluted history, initially derived from a Greek word meaning a (foggy) conglomeration.
Shaula and Lesath, Scorpius’ stinger stars. Shaula is a triple system with 2 young blue-white stars that are not resolved in this image. Lesath is a single blue-white star. Even though they appear close in the sky, they are actually many light-years apart. Image via Sergio Eguivar.
Another beautiful shot of Shaula and Lesath. Image via John Glossop.
Bottom line: Shaula and Lesath, known as the “stinger stars,” mark the location of the scorpion’s stinger in the zodiacal constellation Scorpius.
from EarthSky https://ift.tt/3jDehkl