Moon and Mars from midnight until dawn

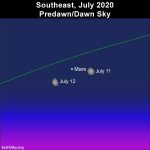
The bright planets Jupiter and Saturn light the eastern half of the sky in early evening now. An even brighter planet, Venus, shines in the east at dawn. Meanwhile, in July 2020, Mars is the bright planet ascending in the east in the middle of the night. Mars isn’t as bright as Jupiter or Venus. And the Red Planet is nowhere close to Venus or Jupiter on the sky’s dome, but instead is found roughly midway between those other two brilliant orbs. The mornings of July 11 and 12, 2020 – from about midnight until dawn – are excellent times to watch for Mars. On these mornings, look first for the moon. The brilliant nearby “star” will be Mars.

Then, once you spot Mars, keep an eye on it in the weeks ahead.

Although the moon will move away from Mars after a few days, you should have little trouble finding Mars in the coming months. Brilliant Mars rules over a relatively “empty” realm of starry heavens, with no nearby bright stars to distract you from this fiery red planet.

Plus Mars will be rising earlier – and earlier – with each passing night. That’s because Earth is now about to catch up to Mars, and pass it, in the race of the planets around the sun. Mars is bright and very red now, and its due to get brighter in the coming months as it approaches its October opposition to the sun. At that time, Earth will be more or less between Mars and the sun. Mars will be opposite the sun in our sky, rising in the east at sundown, blazing very bright and fiery, visible from dusk to dawn.

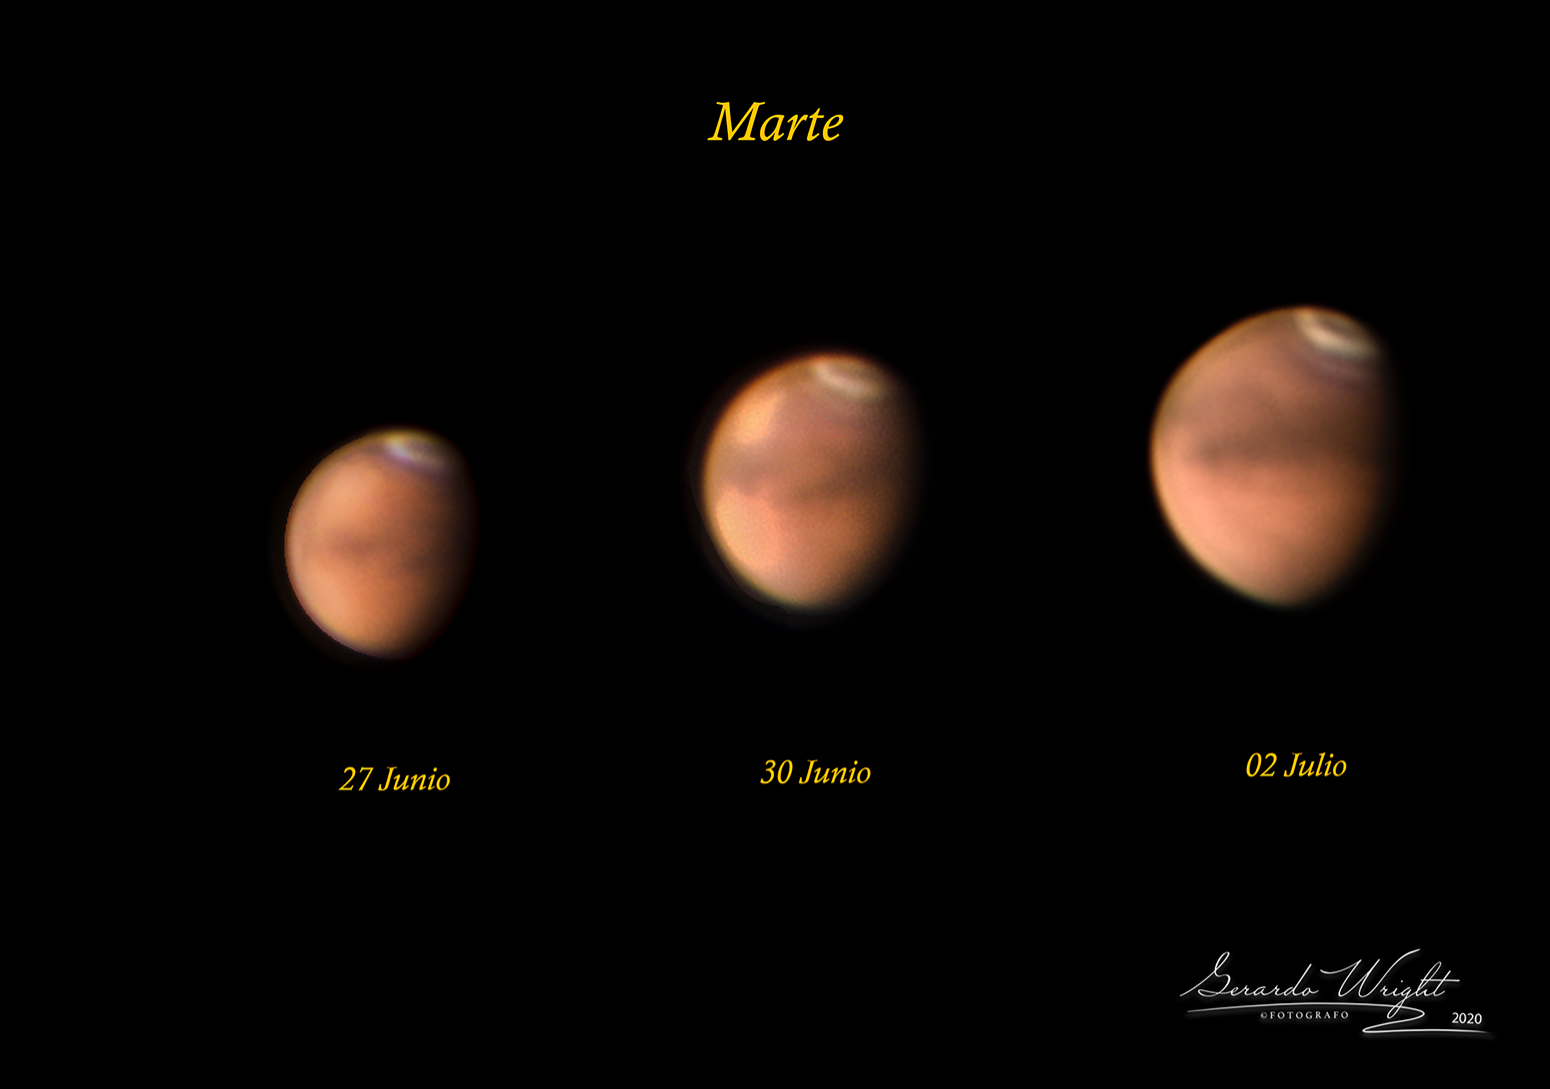
Three telescopic views of the red planet Mars, showing a mottled red surface and a north polar cap.

View at EarthSky Community Photos. | Three days, three recent telescopic views of the Red Planet Mars by Gerardo Wright at Cancun Quintana Roo, México.

Venus and Jupiter rank as the 2nd- and 3rd-brightest celestial objects to light up the heavens, after the sun and moon. Yet, as Mars gets brighter in our sky day and day, it’ll ultimately supplant Jupiter as the 4th-brightest celestial body. That’ll happen in October 2020.

For now, Jupiter is enjoying its moment of glory, as the king planet shining at its brightest for the year.Read more: Jupiter at opposition on July 13-14, 2020

Read more: Saturn at opposition on July 20

Read more: Before 2020 ends, a great conjunction of Jupiter and Saturn

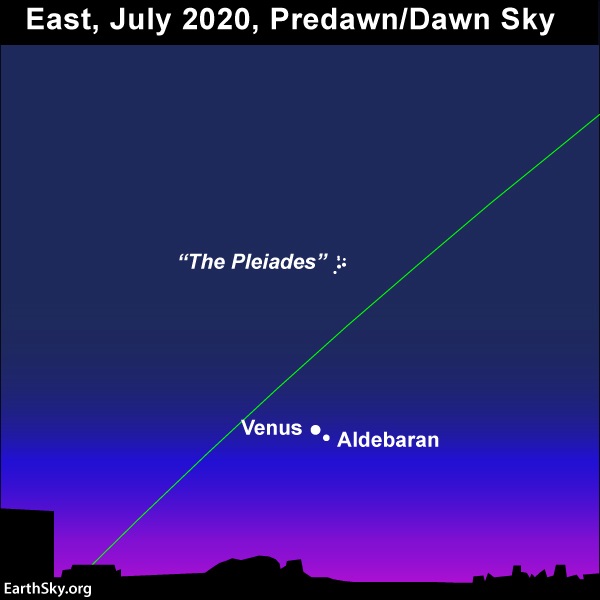
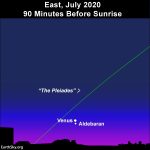
Venus adorns the eastern sky before sunrise in July 2020.

Venus lights up the eastern predawn/dawn sky in July 2020. If you’re up early enough around July 11 – when your morning sky is still dark – watch for the bright star Aldebaran in the constellation Taurus pairing up with Venus on the sky’s dome. Read more.

The moon travels in front of the constellations of the zodiac in an eastward direction, at the rate of about 13 degrees per day. To know which way is east, simply look at the waning moon in your morning sky. The lit side of the waning moon always points eastward (in the direction of sunrise).

So as the moon leaves Mars’ section of the zodiac, it’ll be heading for Venus, to rendezvous with the queen planet in about a week.

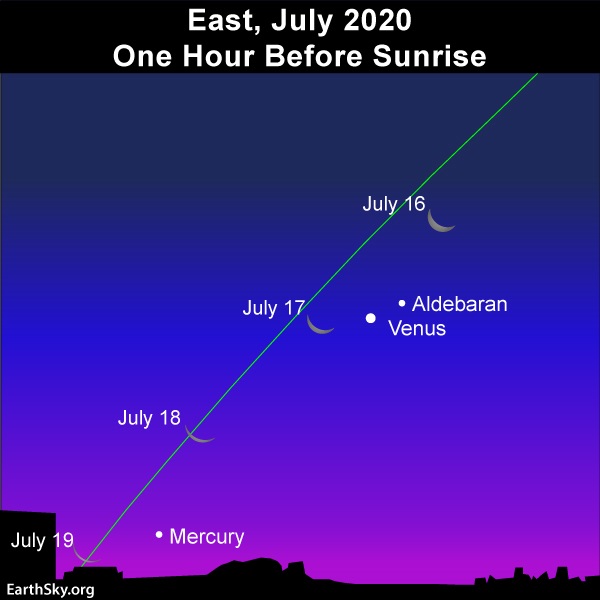
Slender waning crescent moon swings by Venus and then Mercury in the morning sky.

Watch for the waning crescent moon to sink downward day by day during the 3rd week of July 2020. It’ll sweep past both Venus and Mercury. Read more.

Bottom line: Jupiter dominates over the July evening sky, staying out from dusk until dawn. Venus, the sky’s brightest planet, lords over the eastern sky at dawn. Mars is roughly midway between Jupiter and Saturn. It’s near the moon on the mornings of July 11 and 12, 2020.

Read more: Year’s farthest quarter moon July 12


from EarthSky https://ift.tt/3gPNpLP

NASA announces Venus rover challenge winners

A collage showing 15 Venus rover designs.

View larger. | This collage shows all 15 finalists for NASA’s “Exploring Hell” Venus rover competition. In all, designers, makers, and citizen scientists in 82 countries submitted 572 entries. Image via NASA/ HeroX.

Published originally by NASA’s Jet Propulsion Laboratory on July 6, 2020

How do you design a vehicle that can withstand the furnace-like heat and crushing pressures of Venus? One idea being explored by NASA’s Jet Propulsion Laboratory in Southern California is a wind-powered clockwork rover, and it’s just been given a boost by designers, the maker community, and citizen scientists from around the world. In February, NASA launched a public competition to seek ideas for a mechanical obstacle-avoidance sensor that could be incorporated into the novel rover’s design. And on July 6, 2020, the winners were announced.

Jonathan Sauder, a senior mechatronics engineer at JPL, said:

The response from the community was incredible and better than I ever dreamed. There were so many great ideas and well-developed concepts that in addition to first, second, and third place, we decided to add two finalists and another 10 honorable mentions in recognition of the amazing work people put into this project.

The brilliance of the ideas is matched by the harrowing challenge facing future robotic explorers of Venus. The longest any spacecraft has survived on the surface of Venus is a little over two hours – a record set by the Soviet Union’s Venera 13 probe in 1981. And the last spacecraft to land on Venus was the Soviet Vega 2 mission in 1985. It survived only 52 minutes.

Venus may be known as Earth’s “sister planet,” but to develop machines that can better withstand its harsh environment, we’ll obviously need a different approach.

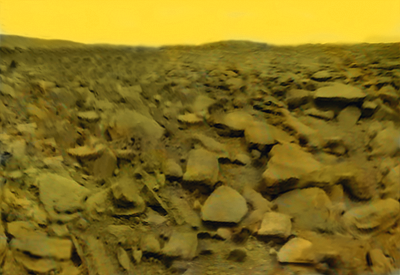
You can see the lander's base, and some rocks.

Surface of Venus from the Soviet Venera 13 lander, March 1, 1982. The lander set a record by surviving just over 2 hours on the hellish surface of Venus. See more images from Venus’ surface in this blog post by Ted Stryk, via the Planetary Society.

Enter AREE, a project being led by Sauder at JPL. Short for Automaton Rover for Extreme Environments, AREE is a rover concept with a mechanical locomotion approach capable of performing complex sequences of operations and instructions autonomously. The concept originated as a NASA Innovative Advanced Concepts (NIAC) study, which funds early-stage technologies that may support future space missions.

AREE would use a small wind turbine and a system of springs to generate and store mechanical energy that could power its locomotion. Think of how a wind-up pocket watch stores energy and drives the motion of its internal gears to keep the time, and you have a basic idea about how this machine would operate.

By replacing sensitive electronics and delicate computers with gears, components made from advanced heat-resistant alloys, and limited-capability high-temperature electronics, a more robust machine can be built – one that might last for months in the punishing environment.

But how would such a machine navigate the terrain without advanced electronic sensors? That was the question behind NASA’s Exploring Hell: Avoiding Obstacles on a Clockwork Rover challenge. In all, 572 entries from a mix of teams and individuals were submitted from 82 countries, with ideas that ranged from systems of rollers to detect hazards to oversized fenders that would snap the rover in reverse should it hit a boulder.

The first-place prize is $15,000; second place wins $10,000; and third place, $5,000. The two additional, unplanned finalist prizes for the entry that was the most innovative and the entry with the best prototype are $2,000 each. The grant money was provided by NIAC and NASA Prizes and Challenges programs.

But the biggest prize for the finalists? Being considered for inclusion in AREE’s design as the rover concept continues to develop.

Final Awards

First Place: “Venus Feelers” by Youssef Ghali
Second Place: “Skid n’ Bump – All-mechanical, Mostly Passive” by Team Rovetronics
Third Place: “Direction Biased Obstacle Sensor (DBOS)” by Callum Heron
Best Prototype: “AMII Sensor” by KOB ART
Most Innovative: “ECHOS: Evaluate Cliffs Holes Objects & Slopes” by Matthew Reynolds

Honorable Mentions

“CATS – Cable Actuated Tactile Sensor” by Team – Spaceship EAC
“Mechanical Logic Obstacle Avoidance Sensor” by Christopher Wakefield
“Clockwork Cucaracha” by Michael Sandstrom
“Vibrissae Inspired Mechanical Avoidance Sensor” by ARChaic Team
“V-Track with Scotch Yoke Clinometer – Prototype” by Jason McCallister
“SPIDER (Sense, Perceive, ID in Exploration Rover)” by Ryan Zacheree Lewis
“The Double Octopus” by Thomas Schmidt
“Mechanical Sensor for Avoiding Compound Obstacles” by Aurelian Zapciu
“DEMoN Fire Sensor” by Santiago Forcada Pardo
“Cane and Able” by Martin Holmes

For more information about the challenge and the winning entries, including videos and photos of the designs, visit:

https://www.herox.com/VenusRover/128-meet-the-winners

You can also participate in a moderated discussion with Jonathan Sauder and the winners of the “Exploring Hell” Challenge, hosted by HeroX, on July 23 at 10 a.m. PDT (1 p.m. EDT). Register here.

Learn more about opportunities to participate in your space program:

www.nasa.gov/solve

Spacecraft image of a lifeless, dry, rocky planetary surface, under a yellow sky.

This modified image is based on the 1st-ever image from the surface of Venus – 1st-ever from another planet, in fact – returned by the Soviet Venera 9 spacecraft in 1975. Looks harsh, doesn’t it? Image via Venera 9/ Ted Styrk. Read more about this image from the Planetary Society.

Bottom line: The Venus rover challenge – titled “Exploring Hell” – received a great response from countries around the world. The design ideas submitted will help advance the final design of a mechanical rover that might one day explore the hellish surface of Venus.

Via NASA


from EarthSky https://ift.tt/3fgTQa4

Venus brightest, near star Aldebaran, around July 10

On July 10, 2020, the dazzling planet Venus reaches a big milestone in the morning sky, as this world displays its greatest illuminated extent. It’s around this time that Venus beams most brilliantly in our sky. What’s more, Venus is near a bright star now, Aldebaran, the fiery Eye of the Bull in the constellation Taurus. So right now is a great time to look for Venus in the east before sunrise!

What is greatest illuminated extent for Venus? As you might know, Venus orbits the sun one step inward from Earth. Thus this inferior planet shows phases, much like the phases of the moon. Sometimes, as now, Venus’ day side is facing mostly away from Earth, and we see a crescent Venus. Venus’ great illuminated extent happens when the day side of Venus covers more square area on the sky’s dome than at any other time during a particular (morning or evening) apparition. More square area visible equals more brightness for Venus in our sky. Thus Venus is brightest around now.

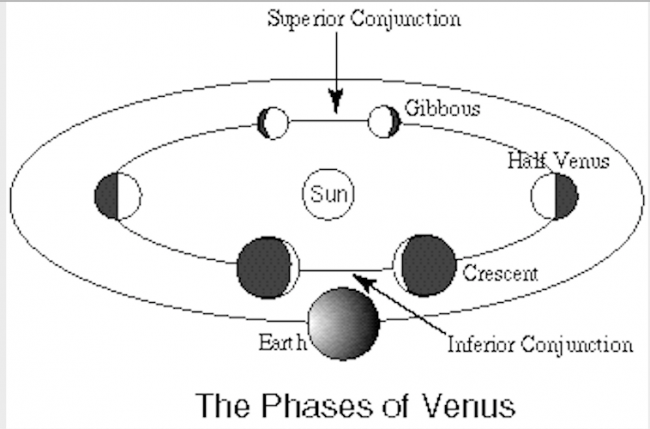
Diagram showing the phases of Venus at inferior and superior conjunction.

The closer that Venus comes to Earth, the thinner the crescent yet the larger the disk. The farther that Venus travels from Earth, the wider the phase yet the smaller the disk. Image via UCLA.

And that is dazzling indeed! Venus is always the third-brightest celestial body to light up the heavens, after the sun and moon. At its brightest, as now, Venus shines about 2 1/2 times more brightly than at its faintest.

Venus beams so brilliantly that some people can see this world in a daytime sky with the unaided eye. Before dawn, Venus blazes ahead of the coming sunrise. It’s accompanied by Aldebaran, the brightest star in Taurus. If, when you look, the dawn light has washed Aldebaran from view, aim binoculars at Venus; Aldebaran might pop into view nearby. Although Aldebaran ranks as a first-magnitude star – one of the sky’s brightest stars – it pales next to Venus, with Venus more than 100 times brighter than Aldebaran.

Click here for recommended almanacs; they can tell you when Venus rises into the morning sky.

You might think Venus appears most brilliant in our sky when its disk is most fully illuminated. Not so. If you were to observe Venus with the telescope at its greatest illuminated extent, you’d see that Venus’ disk is only a touch more than one-quarter illuminated by sunshine now. A full Venus is always on the far side of the sun from us, so its disk size at or near full phase always appears small to us on Earth. It’s only when we see Venus as a crescent – when Earth and Venus are on the same side of the sun – that this world is close enough to us to exhibit its greatest illuminated extent. At that juncture, Venus’ daytime side covers the greatest area of Earth’s sky.

Thus Venus’ greatest brilliancy in our sky depends on just the right combination of distance from Earth and phase visible from Earth.

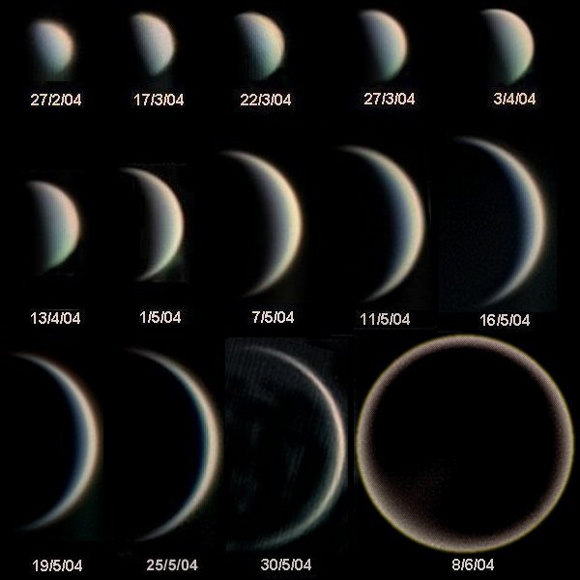
14 photos of Venus with phases changing from small semicircle through larger and thinner crescents.

As Venus comes closer to Earth in the evening sky, its phase shrinks but its disk size enlarges. The converse is also true. When Venus gets farther away from Earth in the morning sky, its phase increases but its disk size diminishes. Image via Statis Kalyvis/ Wikipedia.

We refer you to the diagram below. Venus passed between the Earth and sun (at inferior conjunction) on June 3, 2020 and so entered Earth’s morning sky. Venus will shine in our morning sky for the rest of 2020 and finally transition back to the evening sky (at superior conjunction) on March 26, 2021.

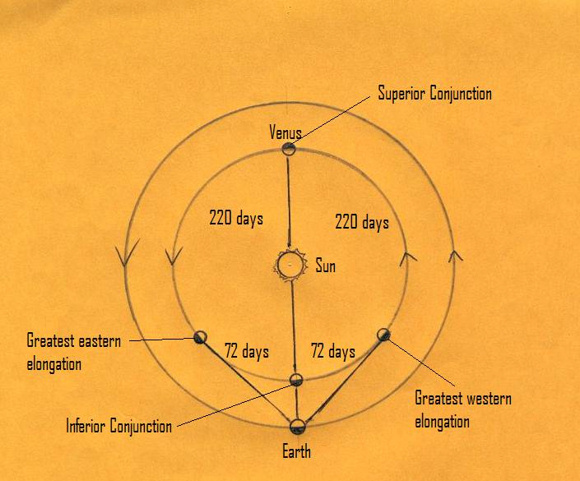
The illustration below provides a bird’s-eye view of Earth and Venus in orbit, helping you see how and why Venus transitions from the evening to morning sky. Because Venus orbits the sun inside Earth’s orbit, we can’t see Venus opposite (180 degrees) the sun in our sky (like the full moon). We can’t even see Venus 90 degrees from the sun (like the half-lit quarter moon). At most, Venus strays no farther than 47 degrees from the sun in our sky.

This is called Venus’ greatest eastern elongation when Venus appears in the evening sky and greatest western elongation when Venus is in the morning sky.

Earth's and Venus' orbits with different positions of Venus marked.' orbits

Earth and Venus orbit the sun counterclockwise as seen from the north of the solar system. Venus always reaches its greatest eastern (evening) elongation about 72 days before inferior conjunction and its greatest western (morning) elongation about 72 days after inferior conjunction. Venus exhibits its greatest illuminated extent – greatest brilliancy as seen from Earth – midway between a greatest elongation and inferior conjunction.

Venus reaches its greatest elongation in the evening sky about 72 days before inferior conjunction, and then reaches its greatest elongation in the morning sky some 72 days after inferior conjunction. If you look at Venus through a telescope at these times, you’ll see that its disk is about 50% illuminated by sunshine.

Venus exhibits its greatest illuminated extent about 36 days before – and after – inferior conjunction. Through the telescope, Venus appears about one quarter illuminated in sunshine at these times. Thirty-six days before inferior conjunction, it’s Venus’ brightest appearance in the evening sky; 36 days after inferior conjunction, it’s Venus brightest appearance in the morning sky.

Let the golden triangle help you to remember these Venus milestones. The two base angles equal 72 degrees and the apex angle equals 36 degrees. Quite by coincidence, Venus’ greatest elongations happen 72 days before and after inferior conjunction, and Venus’ greatest illuminated extent happens 36 days before and after inferior conjunction. See the diagram above of Venus’ and Earth’s orbits.

Venus, which is well-known for its 8-year cycles, returns to its greatest illuminated extent in the morning sky five times in eight years. Eight years from now – July 10, 2028 – expect to see Venus at its brightest as the morning “star” and near the star Aldebaran on the sky’s dome.

A tall pointy triangle.

The Golden Triangle, with the apex angle = 36 degrees and base angles = 72 degrees.

Slender waning crescent moon swings by Venus and then Mercury in the morning sky.

Watch for the waning crescent moon to sink downward day by day during the 3rd week of July 2020. It’ll sweep past both Venus and Mercury. Read more.

Bottom line: Even though – as seen from Earth – Venus appears only slightly more than one-quarter illuminated on July 10, 2020, it is nonetheless shining at its brightest in our morning sky! Look east before sunup for Venus. The bright star nearby is Aldebaran.


from EarthSky https://ift.tt/2DdOn5L

How many ETs are in our galaxy? Ask the Alien Civilization Calculator

Dark sky with long fuzzy white band across it with with numbers and letters superimposed.

A long-exposure photograph of the Milky Way overlaid by the Drake equation: an equation developed by Frank Drake in 1961 for estimating the number of extraterrestrial civilizations in the galaxy. Image via Medium.com.

Are we alone in our galaxy? If not, how many other civilizations might there be? And … where are they? In 1961, astronomer Frank Drake created what’s now known as the Drake Equation – shown above – a tool for discussing the question of alien life. Now two scientists have incorporated the Drake Equation into a new system called the Alien Civilization Calculator. In addition to the Drake Equation, the new calculator also employs a new method called the Astrobiological Copernican Limits, to find the number of advanced civilizations we might be able to communicate with in the future. Like the Drake Equation itself, the new calculator is a tool for thinking and discussing. It’s an aid for contemplating how many advanced alien civilizations there might be – theoretically speaking – in our own galaxy. Using the calculator, you can compare outcomes using the Drake Equation and the Astrobiological Copernican Limits. And you can adjust the input values, to how different factors might affect the number of alien civilizations in our Milky Way galaxy, and how close the nearest ones might be.

The scientists who created the Alien Civilization Calculator are with Omni Calculator – which has many different types of calculators under one roof (1,197 according to the website) – and which, Omni Calculator says, makes it:

… super simple for anyone to solve their day-to-day calculations and math problems with ease in no time.

So … a super simple answer to the question of alien life? Let’s see.

Young scientist, arms folded, standing in front of dish-type radio telescope.

A young Frank Drake. Drake, an astronomer, has been a leader in the search for extraterrestrial intelligence since the 1960s when he implemented Project Ozma to search for radio signals from advanced extraterrestrial civilizations. He developed the Drake equation. And he created the Arecibo Message, a 1974 interstellar radio message from Earth to the globular star cluster M13, carrying encoded information about Earth and its humans. Image via Spaceflight Now.

The inspiration for the calculator came from recent news about the Astrobiological Copernican Limits method, a new method for looking at the possibilities for alien life, based on a study by Tom Westby and Christopher J. Conselice. That study reached the conclusion that there should be at least 36 worlds with advanced alien societies in our galaxy. The peer-reviewed paper was published on April 8, 2020, in The Astrophysical Journal. The study estimated that the nearest civilization would probably be about 17,000 light-years away, so not all that close.

This gave Steve Wooding and Dominik Czernia at Omni Calculator the idea to create a new calculator, combining the Astrobiological Copernican Limits method with the Drake Equation. The two approaches are rather different, so using and comparing both of them was a unique and novel way to try to find possible solutions to what scientists called the Fermi Paradox. That paradox is based on physicist Enrico Fermi’s famous pondering about an apparent contradiction. That is, the Drake equation suggests there should be many, many extraterrestrial civilizations. Yet, all rumors to the contrary aside, there’s been no hard and fast evidence for these civilizations that we all can see and agree upon. Fermi famously asked:

Where are they?

An intelligent-looking man in a suit with a big control panel behind him.

Enrico Fermi (1901-1954) was an Italian-American physicist, who received a 1938 Nobel Prize in physics for his work in nuclear physics. He famously asked, “Where are they?” Image via Wikimedia Commons.

Using the calculator is quite simple. First, you select which method you want to use, and then fill in all the fields in the Milky Way assumptions section. The result gives you an estimate of the number of civilizations in the galaxy, depending on the variables that you input, such as star formation rate, number of stars with planets, etc. It will also tell you how far away the closest of those civilizations should be. You can create many different combinations of variables to test your ideas out with. There’s even a space travel calculator to find out how long it would take to travel to these other worlds by rocket!

So how do the two methods compare?

The first, the Drake Equation, is a rather simple formula, and was developed by astronomer Frank Drake, who is also the father of modern SETI, the Search for Extraterrestrial Intelligence. The formula looks like this:

N = R* x fp x ne x fl x fs x ft x L

N stands for the number of detectable civilizations. The other variables are as follows:

R* is the average rate of star formation in our galaxy. By observing our galaxy and all nearby galaxies, we know it’s about 2.3 per year;
fp is the percentage of stars that have at least one planet. Scientists agree that almost every star has a planet, therefore fp ? 100%;
ne is the average number of hospitable planets per star. Thanks to the Kepler space mission, we know that each star in the galaxy has, on average, four Earth-sized planets;
fl is the percentage of those planets where life actually emerges;
fs is the percentage of those planets where life evolves into intelligent beings;
ft is the percentage of those planets with intelligent creatures capable of interstellar communication; and
L is the lifetime a civilization remains detectable for.

A jagged white line connecting a distant star with a dish-shaped radio telescope in a rural setting.

Perhaps the world’s ongoing effort to search for extraterrestrial life operates under the auspice’s of Yuri Milner’s project called Breakthrough Listen. Here is the Green Bank Telescope in West Virginia, one of the telescopes used by Breakthrough Listen for SETI. This is an artist’s concept of a signal from a Fast Radio Burst – or FRB – detected by the telescope. FRBs are one of the sorts of objects on the new Breakthrough Listen Exotica list, which some hope will help guide the search for ET. Image via UC Berkeley.

The first three are now well-known or fairly well-known at this point, but the remaining three are not. This of course makes it difficult still to come to any solid conclusions. But the Drake Equation is what has been used by astronomers for decades now, to try to come to at least some kind of understanding of how common, or rare, intelligent life might be.

That’s where the second method, the Astrobiological Copernican Limits, comes into play. Westby and Conselice developed it in April 2020 as a more modern form of the Drake Equation. The parameters are different from the Drake Equation, and based on the assumption that any habitable, Earth-like planet, presumably near in size to the Earth, with a similar composition, atmosphere and water, would eventually host life. That may sound like a big assumption to make, and it is. This method is also based on the one example we have so far of a communicating, intelligent civilization, our own. The paper has generated a lot of discussion, including criticism from some fellow scientists. For example, Caleb Scharf, Director of Astrobiology at Columbia University, wrote on Twitter:

From the paper:

We present a cosmic perspective on the search for life and examine the likely number of Communicating Extra-Terrestrial Intelligent civilizations (CETI) in our galaxy by utilizing the latest astrophysical information. Our calculation involves Galactic star-formation histories, metallicity distributions, and the likelihood of stars hosting Earth-like planets in habitable zones, under specific assumptions which we describe as the Astrobiological Copernican Weak and Strong conditions. These assumptions are based on the one situation in which intelligent, communicative life is known to exist, on our own planet.

For the purposes of the calculator, the premise is that an Earth-like planet could only support intelligent life when it is five billion years old or older. This is based on the knowledge that Earth is about five billion years old, and humanity has only appeared within the last three million years or so, as currently understood. The equation for this method looks like this:

N = N* x fL x fHZ x fM x (L/?’)

Large round sphere with interconnected bands and stars in background.

Giant artificial constructions in space, such as this hypothetical type of Dyson sphere, are one kind of possible technosignature. Image via CapnHack.

Again, N stands for the number of intelligent, and communicable, civilizations. But now the variables are as such:

N* is the total number of stars within the galaxy;
fL is the percentage of those stars which are at least 5 billion years old;
fHZ is the percentage of those stars which host a suitable planet for supporting life;
fM is the percentage of those stars for which there is a sufficient amount of metal resources allowing the formation of advanced biology and a communicable civilization;
L is the average lifetime of an advanced, communicable civilization; and
?’ is the average amount of time available for life to develop on a planet, or, in other words, ?’ is the time in which life could exist.

For this model, users can also choose between strong, moderate or weak values in regards to how strict conditions are for intelligent life to appear and evolve. Strong = only a few stars with planets able to host such life, while weak = many such stars.

The maximum distance results from both methods can be used to calculate how many civilizations might be nearby. As might be expected, the farther out you go, the greater the chances of a habitable planet having intelligent life. This is based on the volume of space involved and simple statistics. For example, according to the calculator, there is only a one in 3 billion chance of the nearest star, the Alpha Centauri system, having a planet with intelligent life. But the farther out you go, the greater the odds.

As discussed in EarthSky recently, we are also now getting a better idea of where to search for evidence of advanced alien civilizations. The new Exotica Catalog, aka The Breakthrough Listen Exotic Target Catalog, from Breakthrough Listen, currently lists over 700 objects and phenomena of interest in the universe that might be good places to look. The catalog lists “one of everything” in the known universe that might be a good target for study and observations.

Two smiling young men side-by-side on white background.

Steven Wooding and Dominik Czernia of Omni Calculator, who created the Alien Civilization Calculator. Image via Omni Calculator.

The catalog will help guide the search efforts of those looking for evidence of intelligent life, in particular by searching for technosignatures – artifacts or phenomena produced by a highly advanced intelligent species – that could be detected by telescopes. Modern SETI, the Search for Extraterrestrial Intelligence, is now finally starting to move beyond just looking for alien radio signals. Technosignatures could include many different possibilities, like Dyson spheres built around stars or other huge artificial constructions, lasers or other more exotic communications like Fast Radio Bursts, evidence of industrial pollution on a planet, etc.

The Alien Civilization Calculator is useful in trying to determine how many civilizations might exist in our galaxy, albeit based on many variables, and how close by some of them might be. Projects like the Exotic Catalog and Breakthrough Listen/ SETI will help to narrow down more specific locations and actual detected candidates. This kind of multi-pronged approach is what is needed, even if it still takes a long time to actually find something … or someone.

Series of colorful vertical rectangles with illustrations and text annotations.

The famous Drake Equation in illustrative form, depicting the different variables involved. The new calculator combines this formula with the new Astrobiological Copernican Limits method. Image via SETI Institute/ Enter the Realm of Guy Erma.

Bottom line: The new Alien Civilization Calculator combines two different methods of calculating how many advanced alien civilizations may exist in our galaxy.

Via Alien Civilization Calculator


from EarthSky https://ift.tt/3ebJ43w

Life inside Pluto?

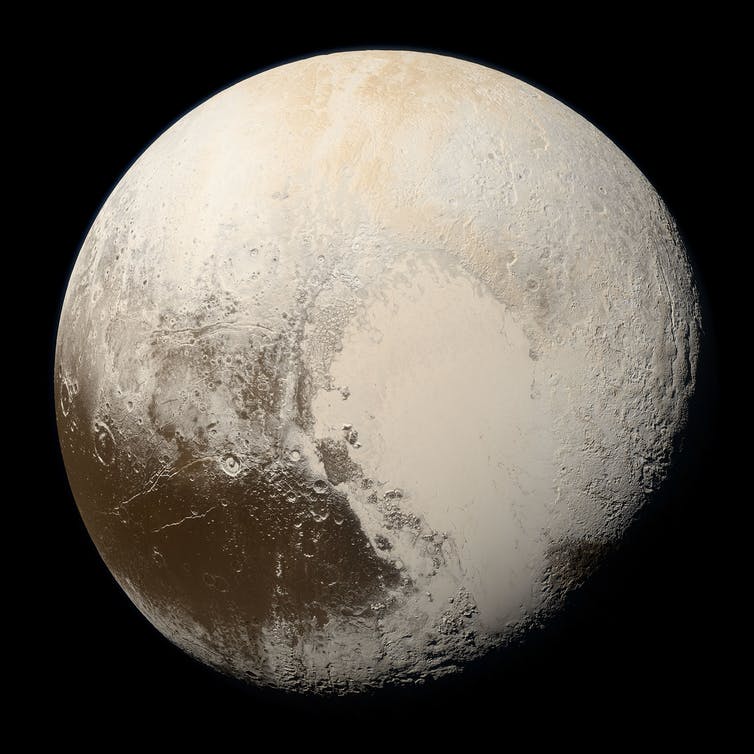
Pale, lightly cratered planet with large dark brown patch on left side and white patch on right.

Pluto, with its basin Sputnik Planitia on the right. Image via NASA/ Johns Hopkins University Applied Physics Laboratory/ Southwest Research Institute/ Alex Parker.

By David Rothery, The Open University

Pluto, along with many other dwarf planets in the outer solar system, is often thought of as dark, icy and barren – with a surface temperature of just -382 degrees Fahrenheit (-230 degrees Celsius). But now a new study, published in Nature Geoscience, suggests that the body has had a warm interior ever since it formed, and may still have a liquid, internal ocean under its icy crust.

It could mean that other sizable icy dwarf planets may have had early internal oceans too, with some possibly persisting today. This is exciting, as where there’s warm water, there could be life.

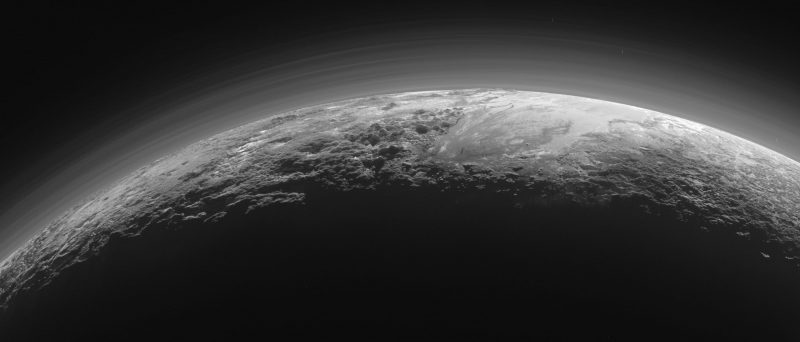
Orbital view of section of round, cratered planet with a rim of atmospheric haze.

Near-sunset view of Pluto’s rugged, icy mountains and flat plains. Image via NASA/ Johns Hopkins University Applied Physics Laboratory/ Southwest Research Institute.

As soon as NASA’s New Horizons probe began to send back its haul of pictures and other data from its 2016 flyby of Pluto, it became clear that this is one of the most interesting worlds ever seen. Beneath its haze-layered atmosphere is a frigid, cratered surface of impure water-ice and one major impact basin (Sputnik Planitia) that has been flooded by frozen nitrogen.

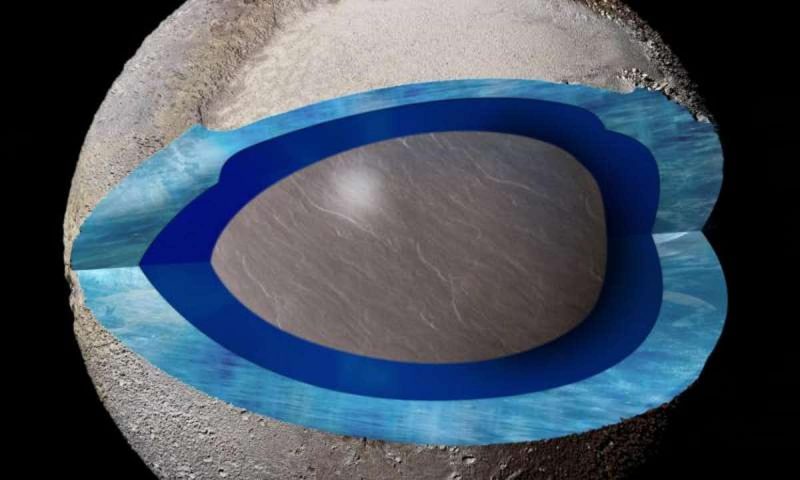
The water-ice crust is cut by numerous fractures, all of which appear to be the result of stretching of the surface. Those cracks in the ice provided the first hints that there might be liquid water flowing underneath, in the form of an internal ocean between the icy shell and rocky core. More evidence soon emerged in favor of this, such as hints that the icy shell has been able to re-orient itself, gliding over an essentially frictionless (hence liquid) interior.

Cutaway view of a sphere with two thick blue layers around a large gray spherical core.

Artist’s concept of Pluto’s interior. An ocean of liquid water lies between the icy crust and rocky core. Image via Pam Engebretson/ Physics Org/ The Conversation.

If it does have an internal ocean, Pluto is far from unique. Evidence for present-day oceans inside icy moons such as Jupiter’s Europa, and Saturn’s Titan and Enceladus is so strong that few scientists doubt the likelihood of an ocean inside Pluto for at least part of its history.

Cracking time

The insight offered by the new study comes from studying maps of Pluto’s shape and features. The researchers discovered that cracks in its surface are of all ages – right back to the most remote times we can see, soon after the surface formed, possibly 4.5 billion years ago.

Scientists have assumed that Pluto grew by slowly accumulating icy material that condensed when the outer solar system was forming. In such a scenario, no internal ocean could have formed until trapped heat generated by radioactive decay in the rocky core had built up sufficiently to melt the overlying ice.

In that situation, the oldest geological faults on the surface would have certain specific characteristics (dubbed compressional features). This is because turning the lower part of the ice into liquid water, which is denser and occupies less volume, would have placed the overlying ice into compression.

Other types of fractures interpreted as “extensional cracks” could begin to form only when the top of this ocean began to freeze as its heat escaped to space. The pressure of the ice forced the interior to expand slightly, stretching and cracking the surface a little. However, Pluto’s surface is cut by what appear to be extensional cracks only, right back to the most ancient times.

Gray surface with round and linear features, darker on right side.

Part of a map of Pluto’s topography (dark = low, bright = high). The dark (low) area in the east is part of Sputnik Planitia. Ancient north-south troughs run to its west; more obvious narrower and younger cracks run obliquely. Image via Paul Schenk/ The Conversation.

The authors therefore argue that the young Pluto grew to its present size by accumulating tiny pieces of material in a so-called “pebble accretion” process that was energetic and rapid enough to cause melting at the base of the ice layer. This is termed a “hot start,” though all it means is “just warm enough for water-ice to melt.”

The crust, from the first moment that it became stable, never experienced compression. Instead, its surface suffered extension as liquid water at top of the ocean froze onto the base of the ice shell during Pluto’s first half billion years.

Ocean freezing may then have paused for about the next billion years because the build-up of radioactive heat was temporarily able to balance the rate of heat escape to space. But ever since then, as Pluto’s radioactive heat production dwindled over time, the roof of the ocean continued to freeze. The thickness of the ice shell has maybe doubled to about 180km (about 110 miles). The surviving ocean is likely a 200km (120 mi) thick layer between the ice and the rock.

Oceans and life

Internal oceans are fascinating, not just because of how changes in volume can stretch or compress the surface, but because they are potential habitats for life. It is irrelevant that Pluto’s surface temperature is extremely low, because any internal ocean would be warm enough for life.

This could not be life depending on sunlight for its energy, like most life on Earth, and it would have to survive on the probably very meagre chemical energy available within Pluto. So while we can’t rule out there could be life inside Pluto, Europa and Enceladus are likely to be better contenders, since they have more chemical energy available.

David Rothery, Professor of Planetary Geosciences, The Open University

This article is republished from The Conversation under a Creative Commons license. Read the original article.

Bottom line: A new study suggests that Pluto has had a warm interior ever since it formed, and may still have a liquid, internal ocean under its icy crust. It could mean that other sizable icy dwarf planets have had early internal oceans too, with some possibly persisting today. This is exciting, as where there’s warm water, there could be life.

The Conversation


from EarthSky https://ift.tt/2ZLAuDK

How volcanoes explode deep under the ocean

An island of the Azores: It is an example of an underwater volcano that has reached the sea surface. The crater is clearly visible. Image via aroxopt / iStock.com/ University of Würzburg

Most of the volcanic eruptions on Earth happen unseen at the bottom of the world’s oceans. In recent years, oceanography has shown that these submarine volcanoes not only deposit lava, but also eject large amounts of volcanic ash.

Bernd Zimanowski, of Julius-Maximilians-Universität in Bavaria, said in a statement:

So even under layers of water kilometers thick, which exert great pressure and thus prevent effective degassing, there must be mechanisms that lead to an ‘explosive’ disintegration of magma.

How are explosive volcanic eruptions possible deep underwater? Zimanowski is part of an international research group that has now demonstrated a mechanism for these undersea explosions. The results were published June 29, 2020 in the journal Nature Geoscience.

There are around 1,900 active volcanoes on land or as islands. The number of submarine volcanoes is estimated to be much higher. Exact numbers are not known because the deep sea is largely unexplored. Accordingly, most submarine volcanic eruptions go unnoticed. Submarine volcanoes grow slowly upwards by recurring eruptions. When they reach the water surface, they become volcanic islands – like the active Stromboli near Sicily (pictured above) or some of the Canary Islands. Image via Novinite.com

The team did research at the Havre Seamount volcano , which lies northwest of New Zealand about half a mile (1,000 meters) below the sea surface. The scientific community became aware the volcano when it erupted in 2012. The eruption created a floating carpet of pumice that expanded to about 150 square miles (400 square km), roughly the size of the city of Vienna.

For the new research, the team used a diving robot to examine the ash deposits on the seabed. From the observational data the group detected more than 100 million cubic meters of volcanic ash. The diving robot also took samples from the seafloor, which were then analyzed in the lab. Zimanowski said:

We melted the material and brought it into contact with water under various conditions. Under certain conditions, explosive reactions occurred which led to the formation of artificial volcanic ash.

The comparison of this ash with the natural samples showed that processes in the laboratory must have been similar to those that took place at a depth of 1,000 meters on the sea floor. Zimanowski added:

In the process, the molten material was placed under a layer of water in a crucible with a diameter of ten centimeters and then deformed with an intensity that can also be expected when magma emerges from the sea floor. Cracks are formed and water shoots abruptly into the vacuum created. The water then expands explosively. Finally, particles and water are ejected explosively. We lead them through an U-shaped tube into a water basin to simulate the cooling situation under water.

The particles created in this way, the “artificial volcanic ash”, corresponded in shape, size and composition to the natural ash.

The researchers believe that further investigations should also show whether underwater volcanic explosions could possibly have an effect on the climate. Zimanowski said:

With submarine lava eruptions, it takes a quite long time for the heat of the lava to be transferred to the water. In explosive eruptions, however, the magma is broken up into tiny particles. This may create heat pulses so strong that the thermal equilibrium currents in the oceans are disrupted locally or even globally.

Source: Deep-sea eruptions boosted by induced fuel–coolant explosions

Via University of Würzburg

Bottom line: How explosive volcanic eruptions are possible deep down in the sea.


from EarthSky https://ift.tt/2VVZpDg

Vega and its constellation Lyra

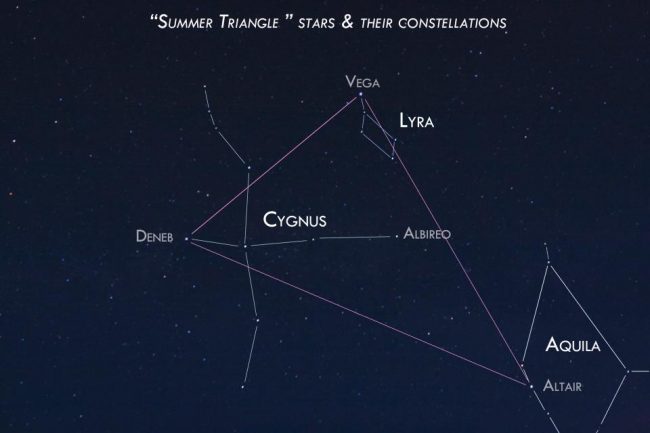
Tonight, look eastward during the evening hours, and it’s hard to miss the season’s signature star formation, called the Summer Triangle. Its stars – Vega, Deneb and Altair – are the first three to light up the eastern half of sky after sunset, and their bright and sparkling radiance is even visible from light-polluted cities or on a moonlit night.

Try looking first for the most prominent star in the eastern sky, which is Vega in the constellation Lyra the Harp. Vega is blue-white in color. It’s sometimes called the Harp Star. And many people recognize its constellation, Lyra, as a triangle of stars connected to a parallelogram.

Star chart of constellation with prominent stars marked, also M57 the ring nebula.

The constellation Lyra the Harp.

It’s hard to gauge the humongous size of the Summer Triangle by looking at our little chart. A 12-inch ruler, when placed at an arm’s length from your eye, spans the approximate distance from Vega to the star Altair. And an outstretched hand more or less fills the gap between Vega and Deneb.

More than any other month, July is the month of the Summer Triangle. At mid-northern latitudes, the Summer Triangle’s stars – as if a trio of school kids on vacation – stay out from dusk till dawn, dancing amid the stars of our Milky Way galaxy. As our Earth turns tonight, Vega, Deneb and Altair travel westward across the sky. The Summer Triangle shines high overhead in the middle of the night, and sparkles in the west as the rose-colored dawn begins to color the sky.

Star field with lines of three constellations and summer triangle drawn on it.

The Summer Triangle, photographed by Susan Jensen in Odessa, Washington.

Our Summer Triangle series also includes:

Part 2: Deneb and its constellation Cygnus

Part 3: Altair and its constellation Aquila

Bottom line: The Summer Triangle consists of 3 bright stars in 3 different constellations. The brightest is Vega in the constellation Lyra.

EarthSky astronomy kits are perfect for beginners. Order yours today.


from EarthSky https://ift.tt/2LtdODm