Plastic rain: More than 1,000 tons of microplastic rain onto western US

A new study estimates that more than 1,000 tons of microplastics from the air – equivalent to more than 123 million plastic water bottles – rain down onto protected areas in the western U.S. each year.

The discovery of the microplastics was a surprise. A research team was analyzing rainwater samples from national parks and wilderness areas across Colorado, as part of a pilot study on a new type of field equipment. They were shocked to find that the samples contained microplastics – plastic fragments less than 5 mm length – including a rainbow of plastic fibers, as well as beads and shards.

Utah State University Assistant Professor Janice Brahney is lead author of the study, published June 12, 2020 in Science. Brahney said in a statement:

We were shocked at the estimated deposition rates and kept trying to figure out where our calculations went wrong. We then confirmed through 32 different particle scans that roughly 4% of the atmospheric particles analyzed from these remote locations were synthetic polymers.
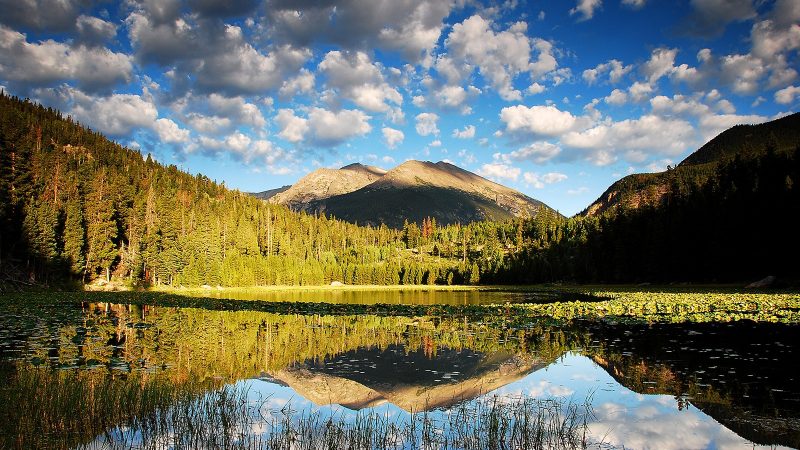
Mountain, lake and blue sky.

Pictured here, Rocky Mountain National Park, which had the greatest amount microplastics among the national parks and wilderness areas in the study. Image via Utah State University.

The world produced 348 million metric tons of plastic in 2017, and global production shows no sign of slowing down. In the United States, the per capita production of plastic waste is 340 grams per day. Although plastics’ high resilience and longevity make them useful in everyday life, these same properties mean that they fragment into tiny particles – microplastics – rather than degrade in the environment. These microplastics are known to accumulate in wastewaters, rivers, and ultimately the worlds’ oceans – and as Brahney’s team shows, they also accumulate in the atmosphere. Brahney said:

Several studies have attempted to quantify the global plastic cycle but were unaware of the atmospheric limb. Our data show the plastic cycle is reminiscent of the global water cycle, having atmospheric, oceanic, and terrestrial lifetimes.
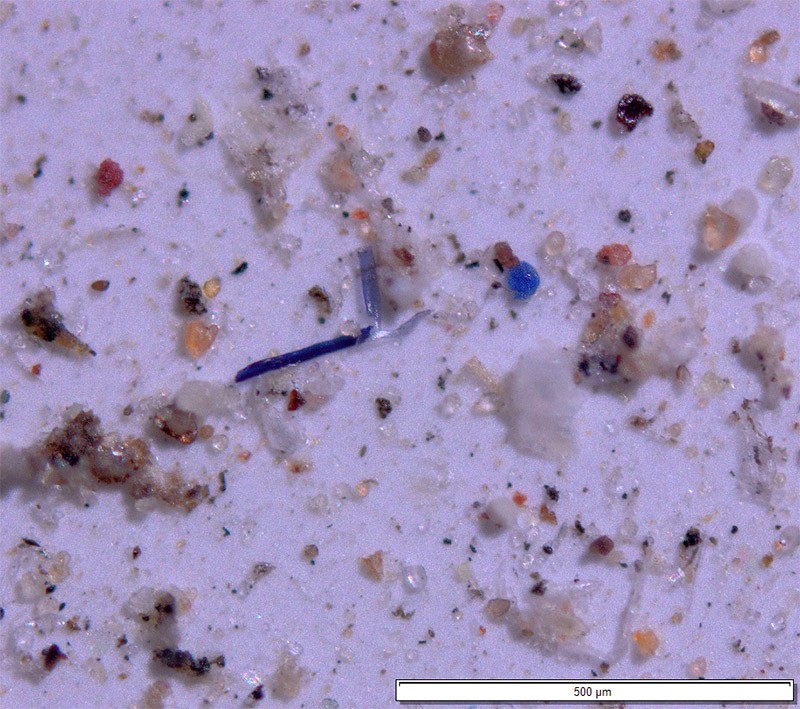
Microscope image of microplastics in atmospheric particulate samples. 500 pm. Image via Janice Brahney/ Utah State University.

The researchers examined the source and life history of microplastics that were deposited via rain versus via dry air. They found that nearby cities and population centers were the initial source of plastics in rain. In contrast, plastics from dry air showed indicators of long-range transport associated with large-scale atmospheric patterns. The researchers say this suggests that microplastics are small enough to be carried in the atmosphere across continents.

Most of the plastics deposited in both wet and dry samples were microfibers from clothing and industrial materials. Approximately 30% of the particles were brightly-colored microbeads, but not those commonly associated with personal care products, these microbeads were acrylic and likely derived from industrial paints and coatings. Other particles were fragments of larger pieces of plastic. The report notes:

This result, combined with the size distribution of identified plastics, and the relationship to global-scale climate patterns, suggest that plastic emission sources have extended well beyond our population centers and, through their longevity, spiral through the Earth system.

The researchers made weekly and monthly examinations of wet and dry samples from 11 sites, and estimate that more than 1,000 tons of microplastics are deposited onto protected lands in the western U.S. each year. A staggering 4% of the atmospheric particulates that the researchers identified collected in the samples from these remote locations were plastic polymers.

The ubiquity of miccroplastics in the atmosphere has unknown consequences for human and animal health, but the size ranges the researchers observed were well within that which accumulate in lung tissue.

Source: Plastic rain in protected areas of the United States

Via Utah State University


from EarthSky https://ift.tt/2ViCMZw

A new study estimates that more than 1,000 tons of microplastics from the air – equivalent to more than 123 million plastic water bottles – rain down onto protected areas in the western U.S. each year.

The discovery of the microplastics was a surprise. A research team was analyzing rainwater samples from national parks and wilderness areas across Colorado, as part of a pilot study on a new type of field equipment. They were shocked to find that the samples contained microplastics – plastic fragments less than 5 mm length – including a rainbow of plastic fibers, as well as beads and shards.

Utah State University Assistant Professor Janice Brahney is lead author of the study, published June 12, 2020 in Science. Brahney said in a statement:

We were shocked at the estimated deposition rates and kept trying to figure out where our calculations went wrong. We then confirmed through 32 different particle scans that roughly 4% of the atmospheric particles analyzed from these remote locations were synthetic polymers.

Mountain, lake and blue sky.

Pictured here, Rocky Mountain National Park, which had the greatest amount microplastics among the national parks and wilderness areas in the study. Image via Utah State University.

The world produced 348 million metric tons of plastic in 2017, and global production shows no sign of slowing down. In the United States, the per capita production of plastic waste is 340 grams per day. Although plastics’ high resilience and longevity make them useful in everyday life, these same properties mean that they fragment into tiny particles – microplastics – rather than degrade in the environment. These microplastics are known to accumulate in wastewaters, rivers, and ultimately the worlds’ oceans – and as Brahney’s team shows, they also accumulate in the atmosphere. Brahney said:

Several studies have attempted to quantify the global plastic cycle but were unaware of the atmospheric limb. Our data show the plastic cycle is reminiscent of the global water cycle, having atmospheric, oceanic, and terrestrial lifetimes.

Microscope image of microplastics in atmospheric particulate samples. 500 pm. Image via Janice Brahney/ Utah State University.

The researchers examined the source and life history of microplastics that were deposited via rain versus via dry air. They found that nearby cities and population centers were the initial source of plastics in rain. In contrast, plastics from dry air showed indicators of long-range transport associated with large-scale atmospheric patterns. The researchers say this suggests that microplastics are small enough to be carried in the atmosphere across continents.

Most of the plastics deposited in both wet and dry samples were microfibers from clothing and industrial materials. Approximately 30% of the particles were brightly-colored microbeads, but not those commonly associated with personal care products, these microbeads were acrylic and likely derived from industrial paints and coatings. Other particles were fragments of larger pieces of plastic. The report notes:

This result, combined with the size distribution of identified plastics, and the relationship to global-scale climate patterns, suggest that plastic emission sources have extended well beyond our population centers and, through their longevity, spiral through the Earth system.

The researchers made weekly and monthly examinations of wet and dry samples from 11 sites, and estimate that more than 1,000 tons of microplastics are deposited onto protected lands in the western U.S. each year. A staggering 4% of the atmospheric particulates that the researchers identified collected in the samples from these remote locations were plastic polymers.

The ubiquity of miccroplastics in the atmosphere has unknown consequences for human and animal health, but the size ranges the researchers observed were well within that which accumulate in lung tissue.

Source: Plastic rain in protected areas of the United States

Via Utah State University


from EarthSky https://ift.tt/2ViCMZw

Watch ISS spacewalk June 26

Astronaut in a white spacesuit, intently working on machinery, against dark background with small orange dots.

NASA astronaut Jessica Meir is pictured during a spacewalk she conducted with NASA astronaut Christina Koch (out of frame) in October 2019 to install new lithium-ion batteries that store and distribute power collected from solar arrays on the station’s Port-6 truss structure. Image via NASA.

On Friday, June 26, 2020, two astronauts will perform the first of a pair of International Space Station (ISS) spacewalks, to replace aging nickel-hydrogen batteries. NASA TV’s live coverage of the spacewalk will begin on Friday at 10:00 UTC (6:00 a.m. EDT). The spacewalk itself will begin at around 11:35 UTC (7:35 a.m. EDT), and will last as long as seven hours. Translate UTC to your time. The second in the pair of spacewalks is scheduled for July 1. Watch here.

On Friday’s spacewalk, NASA astronauts Chris Cassidy, the commander of Expedition 63, and Robert Behnken, who joined the crew May 31 after arriving aboard SpaceX’s Crew Dragon, will begin the replacement of batteries for one of the power channels on the orbiting laboratory.

According to a statement from NASA:

The spacewalking astronauts will replace aging nickel-hydrogen batteries for one of two power channels on the far starboard truss (S6 Truss) of the station with new lithium-ion batteries that arrived to the station on a Japanese cargo ship last month. The battery replacement work is the culmination of power upgrade spacewalks that began in January 2017.

The spacewalkers are following up on the battery swap work that begun last year and continued into January. It’s a complex repair job has been taking place on both the starboard and port sides of the station’s truss structure, where the basketball court-sized solar arrays are located. The solar arrays slowly rotate around the truss structure and track the sun, but are locked into place during the spacewalks.

Cassidy will be extravehicular crew member 1, wearing the spacesuit with red stripes. Behnken will be extravehicular crew member 2, wearing the spacesuit without stripes.

Bottom line: On June 26, 2020, two astronauts will perform the first of a pair of International Space Station (ISS) spacewalks, to replace aging nickel-hydrogen batteries. How to watch.

Via NASA

Via NASA Space Station blog


from EarthSky https://ift.tt/2NFJFQx

Moon sweeps through Leo July 25 and 26

The bright star shining close to the waxing crescent moon on June 25, 2020 is Regulus, Heart of the Lion in the constellation Leo. The following night – June 26 – the moon will have moved some 14 degrees (14 moon-diameters) east on the sky’s dome, following its endless orbit around Earth. It’ll be closer to Denebola, the Lion’s Tail.

If you look carefully and have a dark-enough sky, you can make out patterns in the stars near both Denebola and Regulus. Denebola is part of a triangle of stars. Regulus is part of a pattern that looks like a backwards question mark, with Regulus – the brightest star in Leo – marking the bottom of this question mark pattern. This pattern of stars is called the Sickle. It’s not a constellation but instead an asterism, or recognizable pattern on the sky’s dome.

Illustration of constellation Leo, with The Sickle marked.

Regulus is part of a backwards question mark pattern known as the Sickle in Leo. Image via Derekscope.

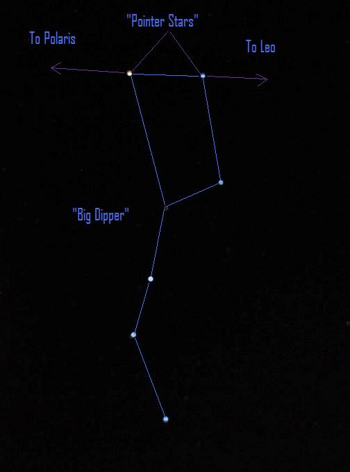
As the moon continues to move from night to night, shifting eastward in front of the constellations of the zodiac, it’ll move onward away from Leo. How can you find Regulus then? One way is to look for the stars of the Sickle. Another way is to use the bowl of the Big Dipper to find your way to Regulus.

A star chart showing that the Big Dipper's bowl can be used to find Regulus.

An imaginary line drawn between the pointer stars in the Big Dipper – the two outer stars in the Dipper’s bowl – points in one direction toward Polaris, the North Star, and in the opposite direction toward Leo.

Regulus is considered to be one of the four Royal Stars of ancient Persia. These Royal Stars mark the four quadrants of the heavens. They are Regulus, Antares, Fomalhaut, and Aldebaran.

Four to five thousand years ago, the Royal Stars defined the approximate positions of equinoxes and solstices in the sky. Regulus reigned as the summer solstice star, Antares as the autumn equinox star, Fomalhaut as the winter solstice star, and Aldebaran as the spring equinox star. Regulus is often portrayed as the most significant Royal Star, possibly because it symbolized the height and glory of the summer solstice sun. Although the Royal Stars as seasonal signposts change over the long coarse of time, they still mark the four quadrants of the heavens.

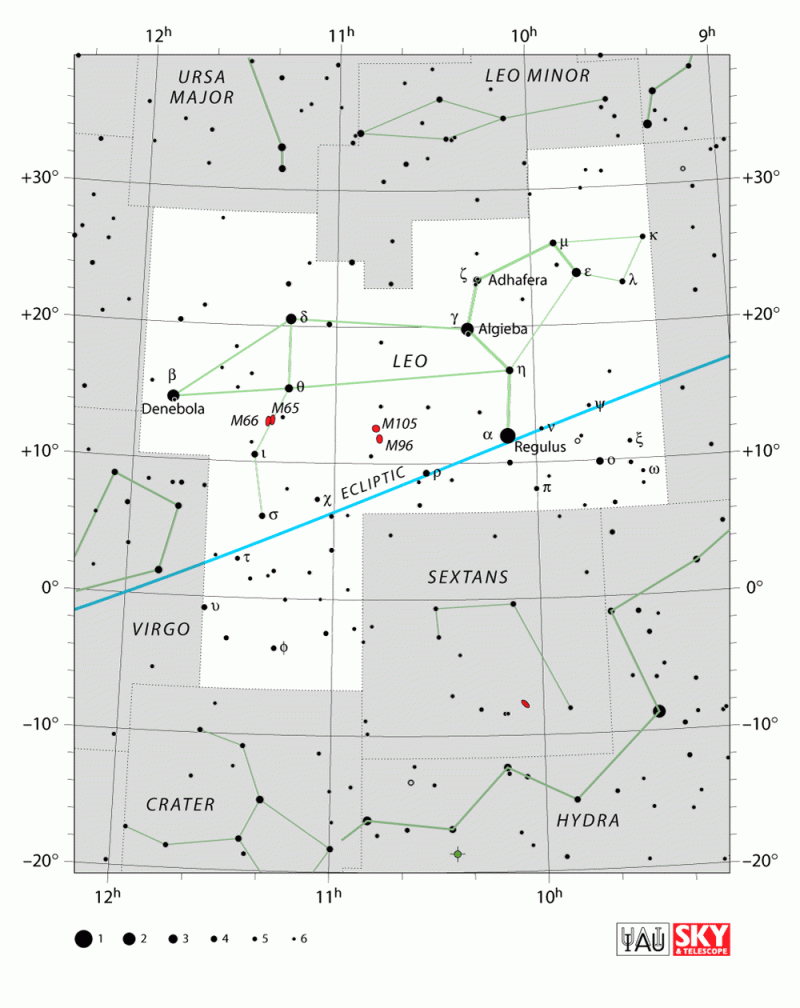
Star chart of the constellation Leo the Lion

Chart of the constellation Leo via the IAU. The ecliptic depicts the annual pathway of the sun in front of the constellations of the zodiac. The sun passes in front of the constellation Leo each year from around August 10 to September 17, and has its yearly conjunction with the star Regulus on or near August 23.

Regulus is the only bright star to reside almost squarely on the ecliptic, that is, Earth’s orbital plane projected onto the sphere of stars. Regulus coincided with the summer solstice point some 4,300 years ago. In our time, the sun has its annual conjunction with Regulus on or near August 23, or about two months after the summer solstice, or alternatively, one month before the autumn equinox. Regulus will mark the autumn equinox point some 2,100 years into the future.

What is the ecliptic?

Eight years ago, in 2012, Regulus reached a place on the zodiac where it was precisely 150 degrees east of the March equinox point (and 30 degrees west of the September equinox point). Before that juncture, Regulus and the March equinox point were a little less than 150 degrees apart, and Regulus and the September equinox point were a little more than 30 degrees apart. For some astrologers, this instant at which Regulus was precisely 30 degrees west of the September equinox point marked the end of the Age of Pisces and the beginning of the Age of Aquarius. Click here to find out why.

Whether you enjoy the arcane speculation on the Royal Star Regulus and the Age of Aquarius – or not – that star now close to the moon has given definition to the ecliptic and the zodiac since time immemorial!

When does the Age of Aquarius begin?

Bottom line: Regulus is the brightest star in the constellation Leo the Lion.  The moon can help you find it – and maybe the planets Jupiter and Venus – on the night of July 7, 2016.

A planisphere is virtually indispensable for beginning stargazers. Order your EarthSky planisphere today.

Help support EarthSky! Visit the EarthSky store for to see the great selection of educational tools and team gear we have to offer.

Leo? Here’s your constellation


from EarthSky https://ift.tt/31gV1Cu

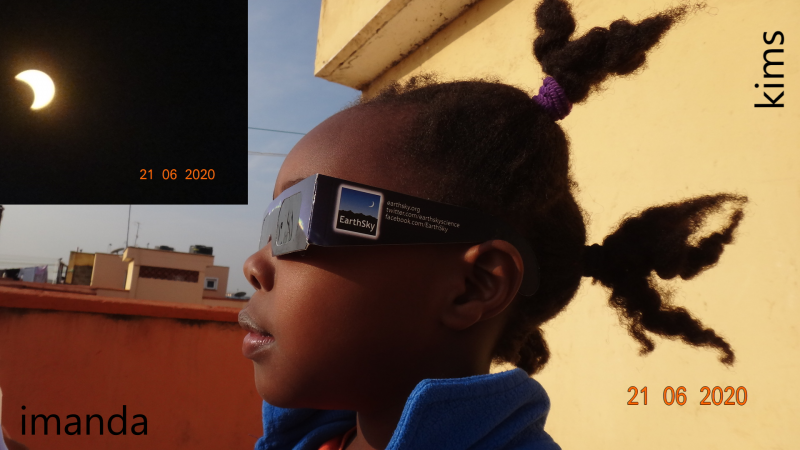
Imanda watching the eclipse

Christopher Kipkemei captured his daughter, Imanda, viewing the annular solar eclipse of June 21, 2020 as it developed over Syokimau, Kenya (just south of the Equator). Thanks Christoper.

And … check out Imanda’s eclipse glasses. We love them! You can get yours here.


from EarthSky https://ift.tt/3dqrwQR

Study reveals biggest Yellowstone supervolcano eruption

Explosions from volcanic super-eruptions have been some of the most extreme events in Earth’s history, ejecting enormous volumes of material – at least 1,000 times more than the 1980 eruption of Mount St. Helens – with the potential to alter the planet’s climate.

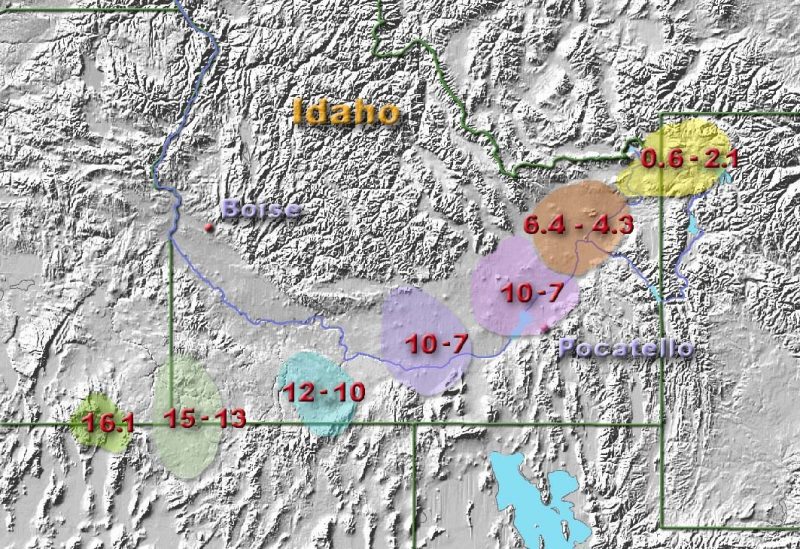
Now, in a study published June 1, 2020 in the peer-reviewed journal Geology, researchers have announced the discovery of two newly identified super-eruptions that occurred 9.0 and 8.7 million years ago, associated with the Yellowstone hotspot track – a volcanic hotspot responsible for large scale volcanism in Idaho, Montana, Nevada, Oregon, and Wyoming. The researchers believe the younger of the two – known as the Grey’s Landing super-eruption – was the volcanic province’s largest and most cataclysmic event. Volcanologist Thomas Knott of University of Leicester is the paper’s lead author. Knott said in a statement:

Based on the most recent collations of super-eruption sizes, it is one of the top five eruptions of all time.

Orbital view of mountainous territory with seven roundish colored areas in a line across it.

Yellowstone hotspot track. Image via Kelvin Case/ Wikimedia Commons.

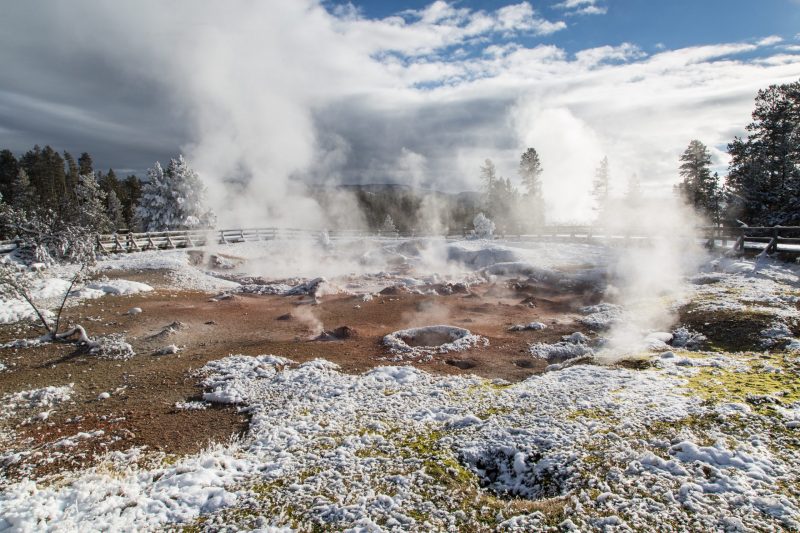
The results indicate the hotspot, which today fuels the famous geysers, mudpots, and fumaroles in Yellowstone National Park, may be waning in intensity. Knott told Scientific American that although the current rate of eruptions suggests that another explosion will not occur for roughly 900,000 years, this estimate is simply a historical average, and it doesn’t forecast how and when nature will act. He said:

We don’t want to encourage complacency—nor do we want to fearmonger.

Landscape of gritty gray rock surrounding a brown patch with steam rising from several points within it.

Fountain Paint Pot. Image via National Park Service/ GSA.

The team used a combination of techniques to correlate volcanic deposits scattered across tens of thousands of square kilometers. Knott said:

We discovered that deposits previously believed to belong to multiple, smaller eruptions were in fact colossal sheets of volcanic material from two previously unknown super-eruptions at about 9.0 and 8.7 million years ago.

The younger of the two, the Grey’s Landing super-eruption, is now the largest recorded event of the entire Snake-River–Yellowstone volcanic province.

The team estimates the Grey’s Landing super-eruption was 30% larger than the previous record-holder (the well-known Huckleberry Ridge Tuff) and had devastating local and global effects. Knotts said:

The Grey’s Landing eruption enameled an area the size of New Jersey in searing-hot volcanic glass that instantly sterilized the land surface. Anything located within this region would have been buried and most likely vaporized during the eruption.

Particulates would have choked the stratosphere, raining fine ash over the entire United States and gradually encompassing the globe.

Both of the newly discovered super-eruptions occurred during the Miocene, the interval of geologic time spanning 23–5.3 million years ago. Knott said:

These two new eruptions bring the total number of recorded Miocene super-eruptions at the Yellowstone–Snake River volcanic province to six. This means that the recurrence rate of Yellowstone hotspot super-eruptions during the Miocene was, on average, once every 500,000 years.

By comparison, Knott says, two super-eruptions have — so far — taken place in what is now Yellowstone National Park during the past three million years. He said:

It therefore seems that the Yellowstone hotspot has experienced a three-fold decrease in its capacity to produce super-eruption events. This is a very significant decline.

But the new findings, says Knott, have little bearing on assessing the risk of another super-eruption occurring today in Yellowstone.

We have demonstrated that the recurrence rate of Yellowstone super-eruptions appears to be once every 1.5 million years. The last super-eruption there was 630,000 years ago, suggesting we may have up to 900,000 years before another eruption of this scale occurs.

Bottom line: A new study has identified the biggest eruption in the history of the Yellowstone supervolcano and also suggests that its activity might be slowing.

Source:
Discovery of two new super-eruptions from the Yellowstone hotspot track (USA): Is the Yellowstone hotspot waning?

Via Geological Society of America


from EarthSky https://ift.tt/3ewNjrv

Latest dusk for northerly latitudes

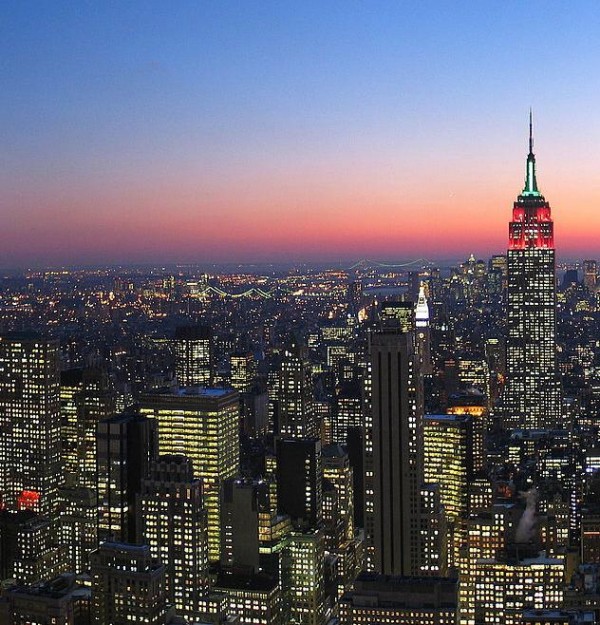
Twilight over Manhattan, New York City

Twilight over Manhattan.

Tonight – June 24, 2020 – if you’re located around 40 degrees north latitude, it’s your latest evening twilight for the year. The longest evening twilights always happen around the summer solstice. Although the Northern Hemisphere’s summer solstice, and longest day, happened a few days ago on June 20, the latest twilight at 40 degrees north latitude always occurs several days afterwards, on or near June 24.

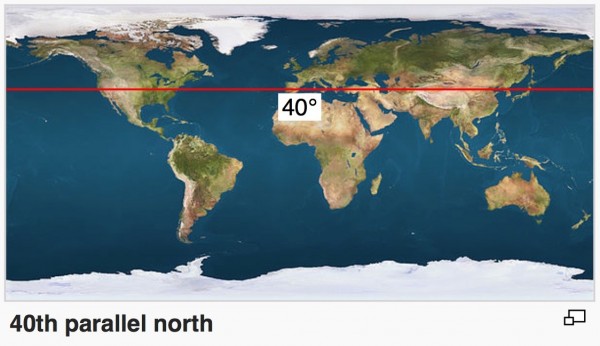
The parallel 40 degrees north passes through Philadelphia, Pennsylvania, and the northern suburbs of Denver, Colorado. Worldwide the 40th parallel runs through Beijing, China; Turkey; Japan and Spain.

Want to know for your latitude? Click here and check the “astronomical twilight” box.

The year’s latest sunsets don’t come exactly on the solstice either. For 40 degrees north latitude, the latest sunset happens about a week after the summer solstice, on or near June 27.

Earth map with red line through US, Spain, Turkey, China, and Japan.

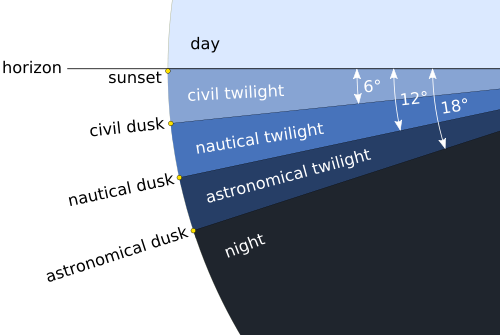
Let us introduce you to the three different kinds of twilight:

Civil twilight starts at sundown and ends when the sun is 6 degrees below the horizon.

Nautical twilight occurs when the sun is 6 to 12 degrees below the horizon.

Astronomical twilight happens when the sun is 12 to 18 degrees below the horizon.

North of 50 degrees north latitude, there’s no true night in the month of June. In June, that far north, the sun never gets far enough below the horizon for true night to occur.

It’s the land of the midnight twilight from 50 degrees north latitude to the Arctic Circle (66.5 degrees north latitude).

It’s the land of the midnight sun from the Arctic Circle to the North Pole (90 degrees north latitude).

At the temperate zones and the tropics, the longest period of twilight after sunset or before sunrise happens around the summer solstice, and the shortest period around the equinoxes. At 40 degrees latitude, astronomical twilight ends about 2 hours after sunset on the summer solstice; and on the equinoxes, astronomical twilight ends about 1 1/2 hours after sunset. Believe it or not, the duration of astronomical twilight reaches a secondary peak around the winter solstice, lasting about 1 2/3 hours after the sun goes down at 40 degrees latitude.

Read more: What exactly is twilight?

Chart with light to dark shades of blue, with 3 types of twilight labeled.

True night doesn’t begin until the sun sinks 18 degrees beneath the horizon.

Bottom line: Although the latest sunset won’t happen at 40 degrees north latitude for another few days, the latest twilight happens on June 24.


from EarthSky https://ift.tt/3fUcB3i

How much oxygen comes from the ocean?

Blue ocean, apparently seen from the rear of a boat, under a blue sky.

The surface layer of the ocean is teeming with photosynthetic plankton. Though they’re invisible to the naked eye, they produce more oxygen than the largest redwoods. Image via Cindy Chai.

Via National Ocean Service/ NOAA

Scientists estimate that 50-80% of the oxygen production on Earth comes from the ocean. The majority of this production is from oceanic plankton — drifting plants, algae, and some bacteria that can photosynthesize – convert sunlight into energy. One particular species, Prochlorococcus, is the smallest photosynthetic organism on Earth. But this little bacteria produces up to 20% of the oxygen in our entire biosphere. That’s a higher percentage than all of the tropical rainforests on land combined.

Calculating the exact percentage of oxygen produced in the ocean is difficult because the amounts are constantly changing. Scientists can use satellite imagery to track photosynthesizing plankton and estimate the amount of photosynthesis occurring in the ocean, but satellite imagery cannot tell the whole story. The amount of plankton changes seasonally and in response to changes in the water’s nutrient load, temperature, and other factors. Studies have shown that the amount of oxygen in specific locations varies with time of day and with the tides.

It’s important to remember that although the ocean produces at least 50% of the oxygen on Earth, roughly the same amount is consumed by marine life. Like animals on land, marine animals use oxygen to breathe, and both plants and animals use oxygen for cellular respiration. Oxygen is also consumed when dead plants and animals decay in the ocean.

This is particularly problematic when algal blooms die and the decomposition process uses oxygen faster than it can be replenished. This can create areas of extremely low oxygen concentrations, or hypoxia These areas are often called dead zones, because the oxygen levels are too low to support most marine life.

Blue ocean next to blue beach with a small child observing the waves.

Overlooking the Atlantic Ocean from the Georgia coast, by Greg Hogan.

Bottom line: How much of Earth’s oxygen comes from the ocean?


from EarthSky https://ift.tt/3fPUECM