COVID-19: The Lighthouse Labs leading the way for COVID-19 testing in the UK

Researcher in PPE

COVID-19 testing is essential in the UK’s fight against coronavirus and to help get cancer services back on track. We’ve estimated that between 21,000 and 37,000 COVID-19 tests must be done each day to ensure there are COVID-protected safe spaces for cancer diagnosis and treatment.

It’s vital for healthcare workers to know if their suspected symptoms are COVID-19, or if they’re carrying the virus despite not showing symptoms in order to protect themselves, their families and their patients. It’s also vital that patients are tested before they come into hospital to make sure it’s safe for them to have treatment.

In order to ramp up COVID-19 testing in the UK, a series of Lighthouse Labs have been assembled. Based in Cheshire, Glasgow, and Milton Keynes, they’re expected to be instrumental in the nation’s efforts to increase testing capacity.

Each of the sites took just three weeks to get up and running. But an empty lab is of no use, it must be filled with expert personnel.

We spoke to Cancer Research UK scientists who are volunteering at the Alderley Park Lighthouse lab in Cheshire and at the Beatson Institute in Glasgow, about how and why they decided to get involved in the initiative.

Isabelle Thompson, Alderley Park: “This pandemic is hopefully like nothing we’ll ever live through again and it’s pushing everyone to their limits”

Isabelle Thompson is a scientific officer at the Cancer Research UK Manchester Institute. Day-to-day, Thompson ensures the smooth running of the preclinical pharmacology laboratory at the Cancer Biomarker Centre, a growing team of 20 scientists who look at testing novel therapies for lung cancer.  

Thompson told us how the Cancer Biomarker Centre receive regular updates on what’s going on in the Institute. And it was in one of these meetings that they were told about the opportunity to get involved in the Lighthouse Labs at Alderley Park.

“Because we’ve already got training in a lot of methods that can be used, they said that we would be able to volunteer our time in the labs,” says Thompson.

As soon as the plans were announced, Thompson knew she wanted to get involved, and signed up straight away. “I think if you can do something, then you really should. I felt that if I’ve got the skills to even just go in and do a bit of lab work, even if it’s just for a few months, then I then I think that is a worthwhile thing to do.”

The Alderley Park Lighthouse Lab has 5 different workstations, representing different stages of the testing procedure. Thompson describes how the samples go through a diligent process that begins with simply unpacking the swabs, to deactivating the virus and finding out whether the test is positive or negative.

“Each part of the process isn’t too complex,” Thompson explains, “it just needs to be very meticulously done, which I guess kind of suits the way a lot of scientist’s work”.

Thompson says the volunteers working there have experience of working in labs and are using lots of the same techniques and methods in the Lighthouse Lab that they use in their day jobs. And where their expertise lie depends at which workstation they’ll be placed.

With her background in molecular biology, Thompson went for one of the first workstations, where the live virus is isolated from patient samples and deactivated in preparation for the next step of the process, where some of the virus’ genetic material, known as RNA, is extracted.

But Thompson explains how there was still a lot to learn, and quickly. “It was new for me to be working with patient samples, and with a live virus.”

As well as adapting to new techniques, Thompson is adjusting to a whole new wardrobe. Volunteers must wear full PPE, including safety specs, a Howie-style lab coat, disposable sleeve, visors, extended cuffs and secondary gloves.

And it’s not just what to wear, it’s how to wear it. Anyone working in PPE must get training in how to operate efficiently whilst wearing the equipment. “There’s a lot of different PPE that you need to know how to use. So if your hands are in the hoods, working with the samples, you can’t bring them out, you can’t catch a sneeze. So it’s just a case of getting used to that.”

Recently, Thompson has been training new volunteers and working with a small team to implement new automated robotic systems, looking to optimise the number of samples they can process each day. The Alderley Park Lighthouse Lab is not short of things to do but morale remains high, “everyone’s coming together and everyone’s keen to help you learn”.

Dr Jo Birch, The Beatson Institute: “It’s nice to have that feeling of contributing to the cause”

Dr Jo Birch is a Cancer Research UK scientist who researches glioblastoma, an aggressive brain cancer at our Beatson Institute in Glasgow.

Since the pandemic began and laboratories across the country began to close, Birch was working from home, before being furloughed. “It is quite difficult to work from home, but I was doing as much as I could. I just had a review accepted, so I’d written that up, but it is limited when you can’t get back into the lab of course.”

Birch says it was difficult to leave the lab when they had to. “It’s very strange

Jo in her full PPE.

because I think we’re all very passionate about what we do. It’s like a lifestyle, we all enjoy it and we’re very impassioned to make a difference with what we’re doing. So, it was a very strange feeling when we had to walk away.”

Birch received an e-mail from the University of Glasgow requesting volunteers to sign up for the Lighthouse Lab at the Beatson Institute. Like Thompson, Birch decided to sign up straight away. “You see so much on the news about current under-testing and how that really needs to be improved in order to get people moving and back to work, and everything getting back to normal – so it’s just good to be able to contribute to that.”

After receiving confirmation, Birch was back in the lab within two days, but this time helping the national effort to increasing COVID-19 testing.

Like Thompson, Birch has been assigned to a station at the beginning of the work chain, logging sample barcodes and assigning them to a 96-well plate.

She believes that the Institute has a good chance of getting through a significant number of samples and is ready to take on the challenge. “It’s fairly high-throughput, so it’s 90 samples that go into the machines at a time, along with six essential control samples to ensure the testing process is accurate. And they’ve got a bank of 18 machines now.”

Lilly


from Cancer Research UK – Science blog https://ift.tt/30o5jA9
Researcher in PPE

COVID-19 testing is essential in the UK’s fight against coronavirus and to help get cancer services back on track. We’ve estimated that between 21,000 and 37,000 COVID-19 tests must be done each day to ensure there are COVID-protected safe spaces for cancer diagnosis and treatment.

It’s vital for healthcare workers to know if their suspected symptoms are COVID-19, or if they’re carrying the virus despite not showing symptoms in order to protect themselves, their families and their patients. It’s also vital that patients are tested before they come into hospital to make sure it’s safe for them to have treatment.

In order to ramp up COVID-19 testing in the UK, a series of Lighthouse Labs have been assembled. Based in Cheshire, Glasgow, and Milton Keynes, they’re expected to be instrumental in the nation’s efforts to increase testing capacity.

Each of the sites took just three weeks to get up and running. But an empty lab is of no use, it must be filled with expert personnel.

We spoke to Cancer Research UK scientists who are volunteering at the Alderley Park Lighthouse lab in Cheshire and at the Beatson Institute in Glasgow, about how and why they decided to get involved in the initiative.

Isabelle Thompson, Alderley Park: “This pandemic is hopefully like nothing we’ll ever live through again and it’s pushing everyone to their limits”

Isabelle Thompson is a scientific officer at the Cancer Research UK Manchester Institute. Day-to-day, Thompson ensures the smooth running of the preclinical pharmacology laboratory at the Cancer Biomarker Centre, a growing team of 20 scientists who look at testing novel therapies for lung cancer.  

Thompson told us how the Cancer Biomarker Centre receive regular updates on what’s going on in the Institute. And it was in one of these meetings that they were told about the opportunity to get involved in the Lighthouse Labs at Alderley Park.

“Because we’ve already got training in a lot of methods that can be used, they said that we would be able to volunteer our time in the labs,” says Thompson.

As soon as the plans were announced, Thompson knew she wanted to get involved, and signed up straight away. “I think if you can do something, then you really should. I felt that if I’ve got the skills to even just go in and do a bit of lab work, even if it’s just for a few months, then I then I think that is a worthwhile thing to do.”

The Alderley Park Lighthouse Lab has 5 different workstations, representing different stages of the testing procedure. Thompson describes how the samples go through a diligent process that begins with simply unpacking the swabs, to deactivating the virus and finding out whether the test is positive or negative.

“Each part of the process isn’t too complex,” Thompson explains, “it just needs to be very meticulously done, which I guess kind of suits the way a lot of scientist’s work”.

Thompson says the volunteers working there have experience of working in labs and are using lots of the same techniques and methods in the Lighthouse Lab that they use in their day jobs. And where their expertise lie depends at which workstation they’ll be placed.

With her background in molecular biology, Thompson went for one of the first workstations, where the live virus is isolated from patient samples and deactivated in preparation for the next step of the process, where some of the virus’ genetic material, known as RNA, is extracted.

But Thompson explains how there was still a lot to learn, and quickly. “It was new for me to be working with patient samples, and with a live virus.”

As well as adapting to new techniques, Thompson is adjusting to a whole new wardrobe. Volunteers must wear full PPE, including safety specs, a Howie-style lab coat, disposable sleeve, visors, extended cuffs and secondary gloves.

And it’s not just what to wear, it’s how to wear it. Anyone working in PPE must get training in how to operate efficiently whilst wearing the equipment. “There’s a lot of different PPE that you need to know how to use. So if your hands are in the hoods, working with the samples, you can’t bring them out, you can’t catch a sneeze. So it’s just a case of getting used to that.”

Recently, Thompson has been training new volunteers and working with a small team to implement new automated robotic systems, looking to optimise the number of samples they can process each day. The Alderley Park Lighthouse Lab is not short of things to do but morale remains high, “everyone’s coming together and everyone’s keen to help you learn”.

Dr Jo Birch, The Beatson Institute: “It’s nice to have that feeling of contributing to the cause”

Dr Jo Birch is a Cancer Research UK scientist who researches glioblastoma, an aggressive brain cancer at our Beatson Institute in Glasgow.

Since the pandemic began and laboratories across the country began to close, Birch was working from home, before being furloughed. “It is quite difficult to work from home, but I was doing as much as I could. I just had a review accepted, so I’d written that up, but it is limited when you can’t get back into the lab of course.”

Birch says it was difficult to leave the lab when they had to. “It’s very strange

Jo in her full PPE.

because I think we’re all very passionate about what we do. It’s like a lifestyle, we all enjoy it and we’re very impassioned to make a difference with what we’re doing. So, it was a very strange feeling when we had to walk away.”

Birch received an e-mail from the University of Glasgow requesting volunteers to sign up for the Lighthouse Lab at the Beatson Institute. Like Thompson, Birch decided to sign up straight away. “You see so much on the news about current under-testing and how that really needs to be improved in order to get people moving and back to work, and everything getting back to normal – so it’s just good to be able to contribute to that.”

After receiving confirmation, Birch was back in the lab within two days, but this time helping the national effort to increasing COVID-19 testing.

Like Thompson, Birch has been assigned to a station at the beginning of the work chain, logging sample barcodes and assigning them to a 96-well plate.

She believes that the Institute has a good chance of getting through a significant number of samples and is ready to take on the challenge. “It’s fairly high-throughput, so it’s 90 samples that go into the machines at a time, along with six essential control samples to ensure the testing process is accurate. And they’ve got a bank of 18 machines now.”

Lilly


from Cancer Research UK – Science blog https://ift.tt/30o5jA9

Rise of carbon dioxide in the atmosphere continues unabated

View over the wing of an airplane of hazy skies and a city spread out below.

Image via NOAA.

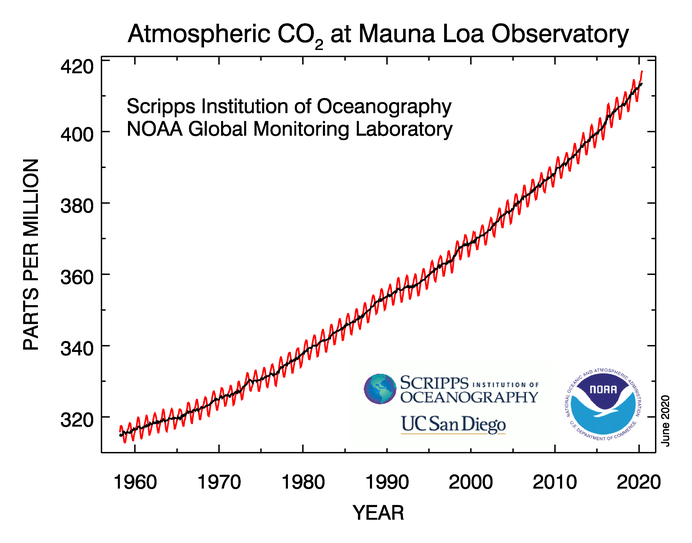
The amount of carbon dioxide (CO2) in Earth’s atmosphere continues to rise, say scientists. On June 4, 2020, scientists from NOAA and Scripps Institution of Oceanography announced that atmospheric CO2 measured at Mauna Loa Observatory in Hawaii reached a seasonal peak of 417.1 parts per million for 2020 in May, the highest monthly reading ever recorded.

Meanwhile, a new study, published May 29,2020 in Geology, concludes that today’s carbon dioxide (CO2) levels are higher than they have been for the past 23 million years. The study’s CO2 timeline revealed no evidence for any fluctuations in CO2 that might be comparable to the dramatic CO2 increase of the present day, suggesting that today’s abrupt greenhouse disruption is unique across recent geologic history. Read more about the study here.

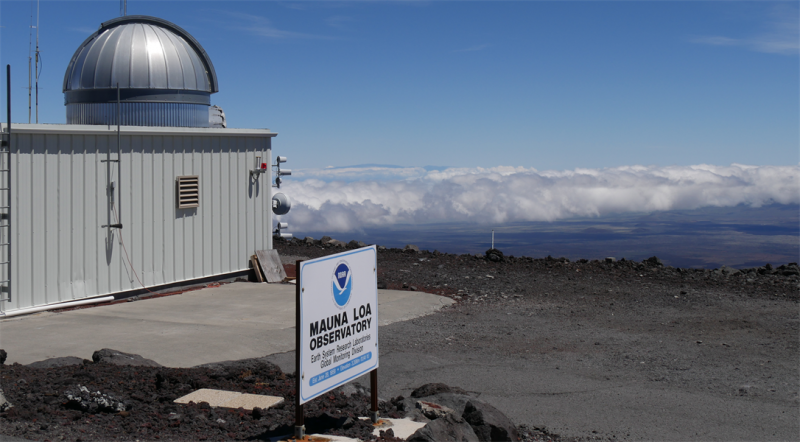
CO2 measurements at Mauna Loa in Hawaii began in 1958, initiating what has become the longest unbroken record of CO2 measurements in the world. The Mauna Loa observatory is a benchmark sampling location for CO2. Perched on a barren volcano in the middle of the Pacific Ocean, the observatory is ideally situated for sampling well-mixed air – undisturbed by the influence of local pollution sources or vegetation – that represents the global background for the northern hemisphere. The Mauna Loa data, together with measurements from sampling stations around the world, are incorporated into NOAA’s Global Greenhouse Gas Reference Network, a foundational research dataset for international climate scientists. Image via NOAA.

Pieter Tans, senior scientist with NOAA’s Global Monitoring Laboratory. Tans said in a statement:

Progress in emissions reductions is not visible in the CO2 record. We continue to commit our planet – for centuries or longer – to more global heating, sea level rise, and extreme weather events every year.

If humans were to suddenly stop emitting CO2, it would take thousands of years for our CO2 emissions so far to be absorbed into the deep ocean and atmospheric CO2 to return to pre-industrial levels.

Graph with a red line going upward.

Image via NOAA/ Scripps Institution of Oceanography.

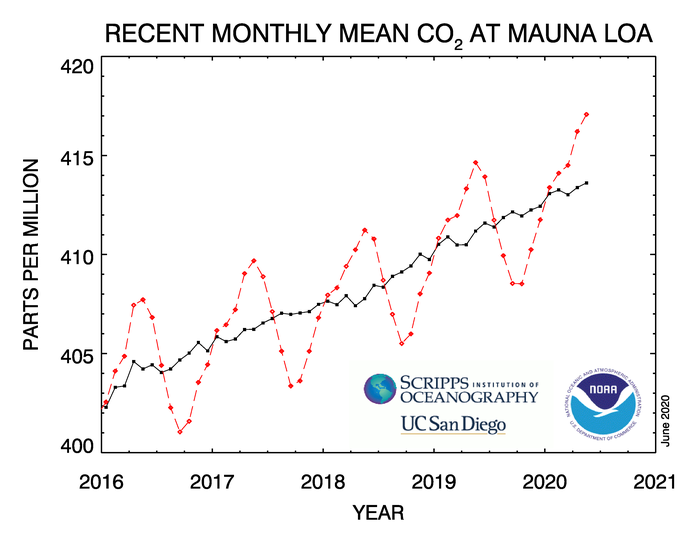
According to the NOAA report, this year’s peak value was 2.4 parts per million (ppm) higher than the 2019 peak of 414.7 ppm recorded in May 2019. NOAA scientists reported a May average of 417.1 ppm. Scripps scientists reported an May average of 417.2 ppm. Monthly carbon dioxide (CO2) values at Mauna Loa first breached the 400 ppm threshold in 2014, and are now at levels not experienced by the atmosphere in several million years.
The rate of increase during 2020 does not appear to reflect reduction in pollution emissions due to the sharp, worldwide economic slowdown in response to the coronavirus pandemic. The reason, says NOAA, is that the drop in emissions would need to be large enough to stand out from natural CO2 variability, caused by how plants and soils respond to seasonal and annual variations of temperature, humidity, soil moisture, etc. These natural variations are large, and so far the emissions reductions associated with COVID19 do not stand out. If emissions reductions of 20 to 30 percent were sustained for six to 12 months, then the rate of increase of CO2 measured at Mauna Loa would be slowed.

Geochemist Ralph Keeling runs the Scripps Oceanography program at Mauna Loa. He said:

People may be surprised to hear that the response to the coronavirus outbreak hasn’t done more to influence CO2 levels. But the buildup of CO2 is a bit like trash in a landfill. As we keep emitting, it keeps piling up. The crisis has slowed emissions, but not enough to show up perceptibly at Mauna Loa. What will matter much more is the trajectory we take coming out of this situation.

Even though terrestrial plants and the global ocean absorb an amount of CO2 equivalent to about half of the 40 billion tons of CO2 pollution emitted by humans each year, the rate of CO2 increase in the atmosphere has been steadily accelerating. In the 1960s, the annual growth averaged about 0.8 ppm per year. It doubled to 1.6 ppm per year in the 1980s and remained steady at 1.5 ppm per year in the 1990s. The average growth rate again surged to 2.0 ppm per year in the 2000s, and increased to 2.4 ppm per year during the last decade.

Tans said:

There is abundant and conclusive evidence that the acceleration is caused by increased emissions … Well-understood physics tells us that the increasing levels of greenhouse gases are heating Earth’s surface, melting ice and accelerating sea-level rise. If we do not stop greenhouse gases from rising further, especially CO2, large regions of the planet will become uninhabitable.

Graph with lines moving upward.

This graph depicts the last four complete years of the Mauna Loa carbon dioxide record plus the current year. The dashed red lines represent the monthly mean values, centered on the middle of each month. The black lines represent the same, after correction for the average seasonal cycle. Image via NOAA

Bottom line: A NOAA report released in June 2020 says that atmospheric carbon dioxide (CO2) measured at Hawaii’s Mauna Loa Observatory for May 2020 was the highest monthly reading ever recorded.

Source: A 23 m.y. record of low atmospheric CO2

Via The Geological Society of America

Via NOAA


from EarthSky https://ift.tt/3hbvL5R

Happy World Oceans Day 2020

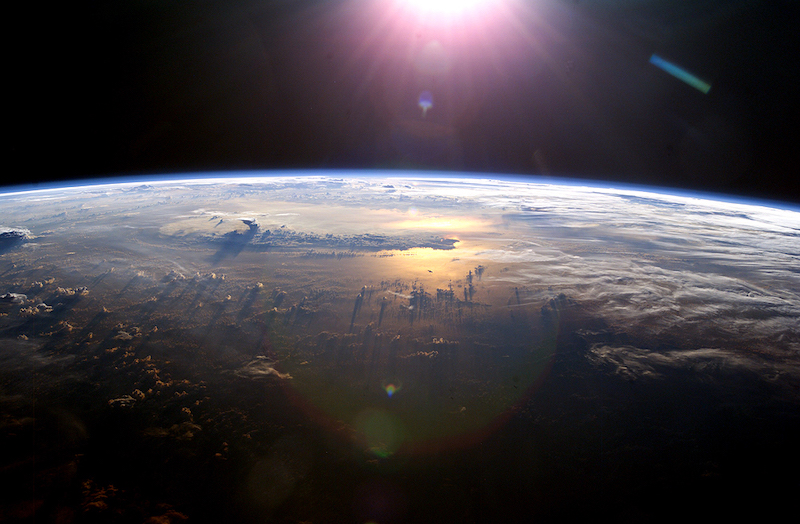
Pacific Ocean with some clouds, with the Earth's terminator visible in half the image, sun above glinting off the sea.

The Pacific Ocean, viewed from the International Space Station. Image via NASA. Longing for the sea? Check out these photos from the EarthSky community.

World Oceans Day has been celebrated every year on June 8 since 1992. It’s a day to raise awareness about how we’re connected – no matter where we live – to the oceans, and about what we can do to protect ocean habitats. This year’s theme – announced by United Nations World Oceans Day 2020 – is Innovation for a Sustainable Ocean. The day is meant to focus on new ideas, techniques, and products for a more sustainable management of our oceans’ resources.

It’s widely recognized that Earth’s oceans are critical to human survival. More than half the oxygen in our atmosphere is generated via photosynthesis by phytoplankton and seaweed in oceans. Millions of people depend on fish and other marine animals for food. Research in some marine organisms have led to the development of new medications; for example, the drug remdesivir, an antiviral medication currently being evaluated in clinical trials as a treatment for Covid-19, contains compounds that are found in some sea sponges. Earth’s climate is regulated by ocean currents known as global conveyor belts.

Perhaps the best reason we’ve seen to celebrate and protect Earth’s oceans comes from the 2013 video below, featuring Sylvia Earle, who is a National Geographic Society Explorer-in-Residence and perhaps the world’s most recognized living oceanographer. In the video, among other things, Earle says:

I think of the ocean as the blue heart of the planet.

And she says:

We, too, are sea creatures.

Canada made the original proposal for World Oceans Day in 1992 at the Earth Summit in Rio de Janeiro, Brazil. The day was unofficially celebrated on June 8 until 2008, when the United Nations officially recognized it. Since then, World Oceans Day has been coordinated internationally by The Ocean Project and the World Ocean Network. These organizations say they have had greater success and global participation each year.

We know that human activities have adversely affected the health of oceans: pollution, over-fishing, seawater acidification due to increased carbon dioxide, ocean warming, habitat destruction. There is so much to do to repair the damage.

In 2020, organizations such as aquariums and marine research institutions – which would otherwise host public events for World Oceans Day – are unable to do it due to the Covid-19 pandemic. Some online events and cleanups are listed at the World Oceans Day website.

There are also things you can do on your own, on this day or any other. If you live near an ocean, perhaps join a shoreline cleanup (with appropriate social distancing during this time of pandemic).

Even if you’re not near the sea, you can encourage your seafood retailers and favorite seafood restaurants to to source their seafood more sustainably (Monterey Bay Aquarium’s Seafood Watch program is a terrific resource).

And we can all reduce our use of plastics with reusable shopping bags and refillable water bottles, and by using biodegradable products over plastic.

Plus we can contemplate the sea, and teach our children to love it. Show your kids the sea creature below, just announced a couple of months ago … perhaps the longest living animal ever recorded! Happy World Oceans Day, everyone!

A very long, delicate white spiral against a blue ocean background.

The thin, white spiral in this aerial image is a living creature, reported on in April 2020 by scientists. They said this 150-foot (46-meter) siphonophore might be the the longest animal ever recorded. The massive gelatinous siphonophore was discovered during a month-long scientific expedition exploring the submarine canyons near Ningaloo in the Indian Ocean off the coast of Western Australia. Read more and see a video.

Bottom line: June 8, 2020, is World Oceans Day. This year’s theme is Innovation for a Sustainable Ocean. You can find some online events for June 8 at the World Oceans Day website.

Longing for the sea? Check out these photos from the EarthSky community.


from EarthSky https://ift.tt/2YaxkbS

Longing for the sea? Check out these photos

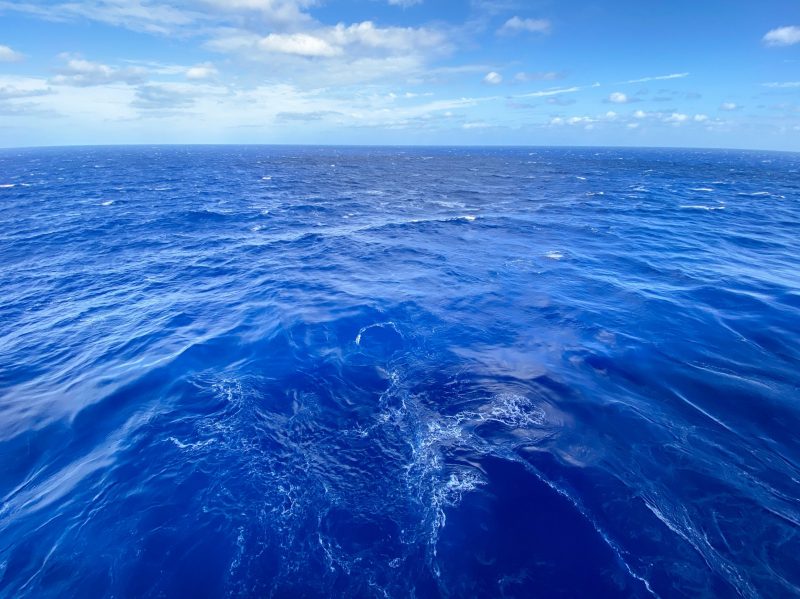
Blue ocean, apparently seen from the rear of a boat, under a blue sky.

View at EarthSky Community Photos. | Cindy Chai wrote from the North Pacific Ocean: “Smell the sea and feel the sky! During the COVID 19 period, many people can’t get out of their home due to lock down, so I think I’m lucky because I still get to see the ocean everyday due to my job on sea.” Thank you, Cindy.

World Oceans Day – a global day of ocean celebration – takes place every year on June 8. The World Ocean Project first organized the day as a time to celebrate the oceans and take steps to protect ocean health. This year’s theme is Innovation for a Sustainable Ocean.

Find out more about World Oceans Day 2020

A sandy beach, blue-green ripples rolling in under a blue sky with complex clouds.

View at EarthSky Community Photos. | Kim Cronan of Wabasso Beach, Florida, sent in this photo and wrote, “Taken while enjoying a typically gorgeous December day in South Florida and the Atlantic Ocean’s amazing shades of blue.” Thanks, Kim!

Clouds over a gray sea with a veil of rain on the right of the image.

View at EarthSky Community Photos. | Kevan Hubbard at Seaton Carew in County Durham, England, wrote: “A window in the clouds with rain heading to the Yorkshire Moors.” Thank you, Kevan.

Beach with shallow stream on it reflecting setting sun.

Paulo P. Pereira of Torres Vedras, Lisbon, Portugal, captured this image.

Blue ocean next to blue beach with a small child observing the waves.

Overlooking the Atlantic Ocean from the Georgia coast, by Greg Hogan.

Rocky coast and incoming waves all in shades of pink, purple, and mauve.

West Bay, Dorset, at sunset. Image via Roger Morgan.

View straight along rocky breakwater with dot of light at end in dark twilight sky.

“Into the Bay of Bengal” by Karthik Easvur.

Thin ice on sea surface under lowering cloudy sky.

Tommy Richardsen Photography in Nordreisa, in northern Norway, captured this image of ice melting in the Norwegian Sea in May 2018. He wrote: “Magic of May. Close to 7 hours of good weather conditions for photography, rain, fog, mist, sunlight and crazy clouds, all one can ask for. :)” D810, 15mm.

Edge of beach with wavelets under cloudy sky.

Leo Carrillo State Beach, Malibu, California. Photo via Kristal Alaimo-Moritz Klear.

Splendid orange sunset over waves coming onto beach on rocky coast.

Twilight at Waimanalo Beach, Oahu, Hawaii, on June 4, 2017, via Chantel Dunlap.

Immense billowing white cloud against blue sky over calm sea.

Summer showers near Galveston, Texas, by Brett Stone.

Sunset over dark ocean waters.

San Francisco Bay by Matt Snow.

A large, lone, irregular rock sticks out of ocean waters with distance perfectly straight horizon.

From Reykjanes Peninsula in Iceland, by Vladimir Zlvkovic.

Waves crash onto a rocky coastline on a misty day.

York Beach, Maine, by Kevin Pratt.

A turquoise sea next to vertical red cliffs above a narrow beach.

From the Great Ocean Road in Australia by Malck Coolen Photography.

Dark sea under a blue sky.

“Seawater inlet of Indian Ocean where two seas of different texture meet!” by Sima Sweet.

Scudding clouds over choppy water on a rocky coastline.

Atlantic Ocean, off the coast of Cape Breton Island, Canada, by Tynski Photographic.

Sun high in orange sky with golden reflection in ocean below.

Glenn Miles Photography took this photo from the north coast of Northern Ireland. Thank you, Glenn.

Pure sunrise fading from red to blue above horizon with rocky promontory on right.

Maine coast at sunrise by John Gravell.

Pink and blue sunset reflected in ocean.

Sunset in Truro, Massachusetts, looking toward Provincetown, by John Gravell.

Low sun over sea with what looks like tractor tracks leading to water.

“Loggerhead sea turtle tracks at sunrise on Florida’s beautiful east coast.” Photo via Rachel Smith. Thanks Rachel!

Enjoying EarthSky? Sign up for our free daily newsletter today!

Bottom line: Ocean photos from EarthSky friends across the globe in celebration of World Oceans Day 2020.

Help EarthSky keep going! Please donate what you can to our annual crowd-funding campaign.


from EarthSky https://ift.tt/2AQAQzQ

Video: 2 minutes of cool ocean facts

In celebration of 2020’s World Oceans Day, NOAA released this video with a bunch of cool facts about our planet’s oceans. Did you know, for example, that Australia’s Great Barrier Reef is the largest living structure on Earth and can be seen from the moon?

Bottom line: Two-minute video with facts about Earth’s oceans.

Via NOAA


from EarthSky https://ift.tt/3h7c2UY

Middle of eclipse season June 20

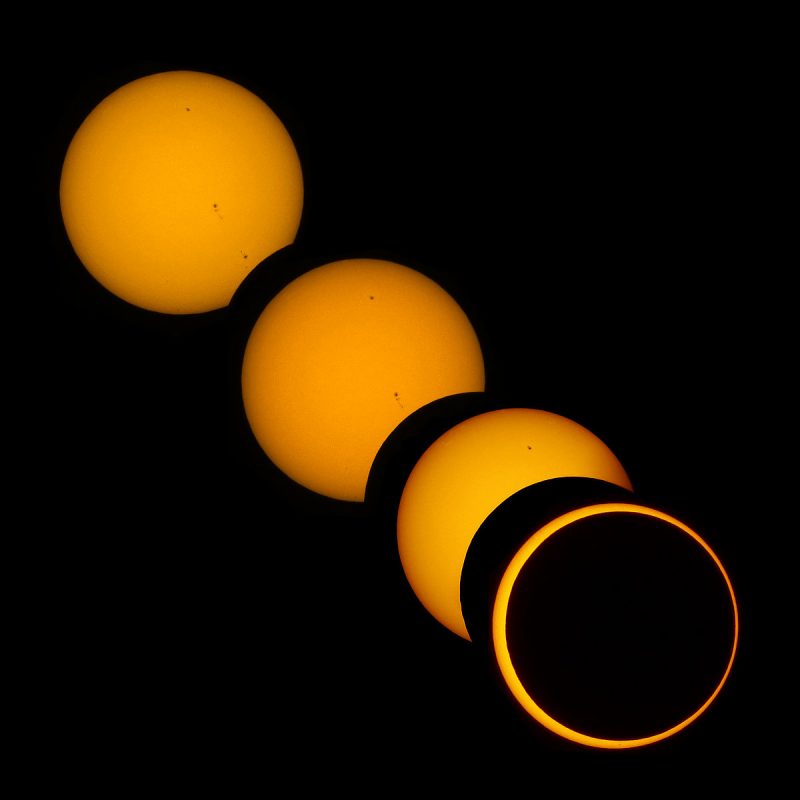
Three views of eclipsing sun, last a thin orange ring around black center.

Various stages of an annular solar eclipse from Brocken Inaglory via Wikimedia Commons.

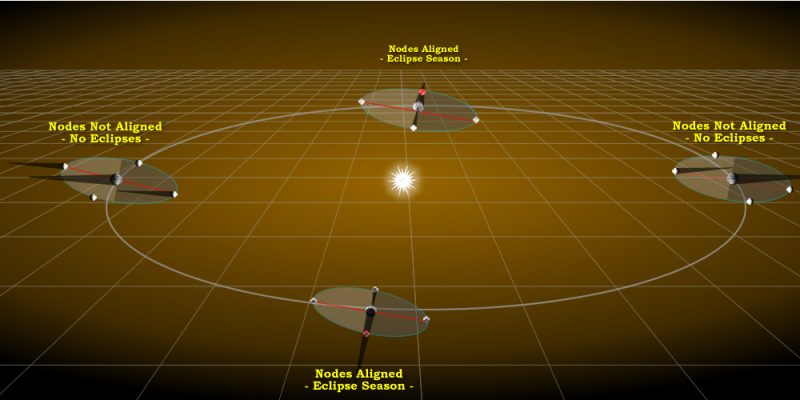
Eclipses of the new moon and full moon don’t occur every month, because the moon’s orbital plane is inclined by about 5 degrees to the plane of the ecliptic (Earth’s orbital plane). But the moon’s orbital path does intersect the Earth’s orbital plane at two points called nodes. Whenever these lunar nodes point directly at the sun, it marks the midpoint of the eclipse season. The lunar nodes line up with the sun in periods of about 173.3 days, or nearly 10 days shy of six calendar months.

The middle of the eclipse season (when the line of nodes points directly the sun) last took place on December 30, 2019. The middle of the eclipse season will next occur on June 20, 2020, and then – after that – on December 11, 2020.

Oblique view of Earth and moon orbits with lunar nodes located at four points in Earth's orbit.

Whenever the lunar nodes point directly at the sun, it marks the midpoint of the approximate 35-day eclipse season. In the year 2020, the middle of the eclipse season occurs on June 20, 2020, and then again on December 11, 2020. Image via Go Science Go.

An eclipse season lasts for approximately 35 days, and any new moon or full moon occurring within this time period will undergo an eclipse. Given that the lunar month (period of time between successive new moons or successive full moons) is about 29.5 days long, a minimum of two eclipses (one solar and one lunar, in either order), or a maximum of three eclipses (either lunar/solar/lunar, or solar/lunar/solar) can take place in one eclipse season.

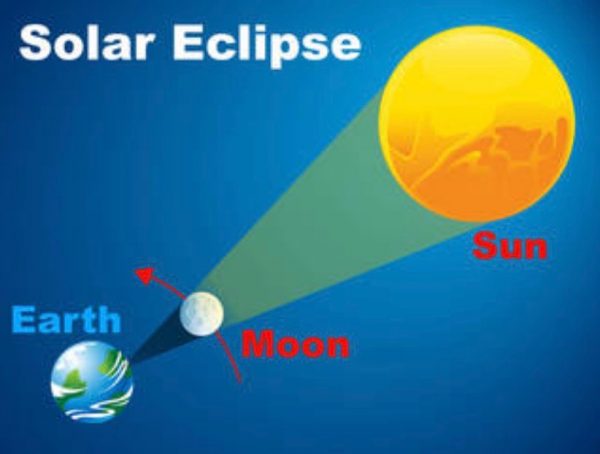
Graphic of Earth, moon, and sun showing moon's shadow blocking the sun.

Eclipses are all about alignments. In a solar eclipse, the sun, moon and Earth line up, with the moon in the middle. Image via NASA.

Graphic of Earth, moon, and sun with Earth shading the moon.

In a lunar eclipse, the sun, Earth and moon line up, with the Earth in the middle. Image via NASA.

Most often, there are only two eclipses in one eclipse season. For three eclipses to occur, the first one has to come quite early in the eclipse season to allow for a third eclipse near the end. For the first time since the year 2018, we’ll have three eclipses in one eclipse season in 2020. We won’t have three eclipses in one eclipse season again until the year 2029.

The year 2020:

June 5, 2020: Penumbral lunar eclipse
June 21, 2020: Annular solar eclipse
July 5, 2020: Penumbral lunar eclipse

Read more: How often are there 3 eclipses in a month?

If an eclipse happens at or near the mid-point of the eclipse season, as the upcoming solar eclipse on June 21st does, then we’ll have a central eclipse. If it’s a solar eclipse, the central eclipse presents either a total or annular eclipse of the sun; or if it’s a lunar eclipse, the central eclipse features a total eclipse of the moon. If the eclipse falls near the beginning or the end of the eclipse season, it’s either a penumbral eclipse of the moon or small partial eclipse of the sun.

Read more: Annular eclipse of the sun on June 21, 2020

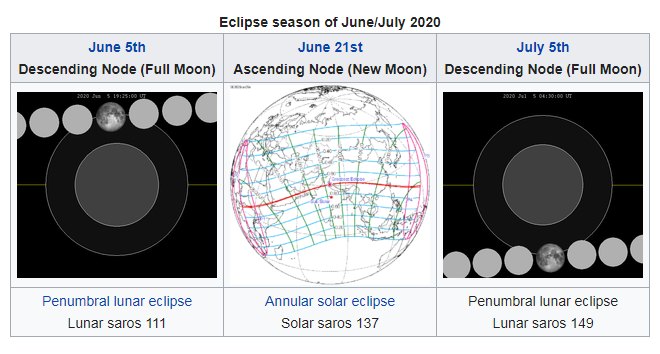
Because the lunar eclipses occur so early and so late in the June/July 2020 eclipse season, the lunar eclipses on June 5, 2020, and July 5, 2020, will be extremely faint and hard-to-see penumbral lunar eclipses. See the illustration of these eclipses below.

Diagrams of lunar eclipses and map of the world with solar eclipse path.

The next eclipse season in June/July 2020 will showcase three eclipses (lunar/solar/lunar). Image via Wikipedia.

On the other hand, the solar eclipse on June 21, 2020, which takes place almost dead center in the eclipse season, will present a central eclipse, exhibiting an annular eclipse of the sun. See diagram above.

Thirty-eight eclipse seasons (19 eclipse years) are almost exactly commensurate to 223 lunar months, a period of 18 years and 11 1/3 days (four intervening leap years) or 18 years and 10 1/3 days (5 intervening leap years). Therefore, the eclipses coming up in June/July 2038 display similar geometries to those in June/July 2020. This 223-lunar-month period of time is known as the Saros.

The year 2020:

June 5, 2020: Penumbral lunar eclipse
June 21, 2020: Annular solar eclipse
July 5, 2020: Penumbral lunar eclipse

The year 2038:

June 17, 2038: Penumbral lunar eclipse
July 2, 2038: Annular solar eclipse
July 16, 2038: Penumbral lunar eclipse

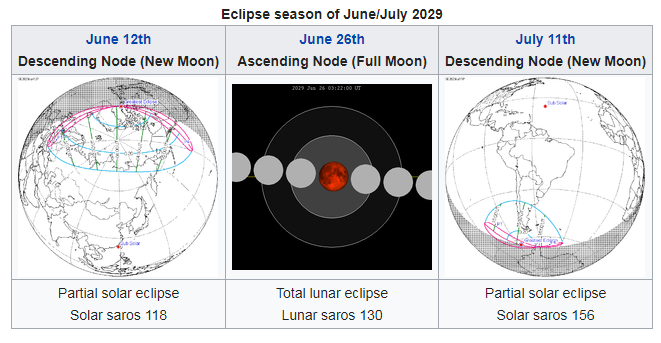
Interestingly, the Sar or Half Saros, representing a period of 111.5 lunar months (9 years and 5 2/3 days), gives us alternating eclipses (solar/lunar/solar) of similar character. Contrast the years 2020 and 2038 listed above with the years 2029 and 2047 listed below.

Two maps of world with eclipse paths and diagram of lunar eclipse.

Many people are familiar with the Saros period of 223 lunar months (18.03 years), whereby a similar progression of eclipses takes place in one eclipse season (lunar/solar/lunar). Less well known, the Sar or Half Saros of 111.5 lunar months (9.015 years) also presents 3 eclipses in one eclipse season, though in alternate order (solar/lunar/solar). Image via Wikipedia.

The year 2029:

June 12, 2029: Partial solar eclipse
June 26, 2029: Total lunar eclipse
July 11, 2029; Partial solar eclipse

The year 2047:

June 23, 2047: Partial solar eclipse
July 7, 2047: Total lunar eclipse
July 22, 2047: Partial solar eclipse

The eclipse master Fred Espenak tells us a Saros series can last anywhere from 1,226 to 1,550 years and is made up of 69 to 87 eclipses. A Saros series, whether it be solar or lunar, always starts off with skimpy eclipses and ends with skimpy eclipses. The middle of a Saros series brings about the closest alignment of the three celestial bodies – Earth, sun and moon – whereby they line up almost perfectly in space.

In any eclipse season where there are three eclipses, the first and third eclipses are meager productions whereas the middle eclipse is a highly visible central eclipse. And in any Saros series, the early and late eclipses are also paltry at best, whereas the middle part of a Saros series presents central eclipses.

Here’s something that may surprise you: Any eclipse happening early in an eclipse season always occurs late in a Saros series – and vice versa. For example, let’s look at the upcoming three-eclipse season in June/July 2020:

The year 2020:

June 5, 2020: Penumbral lunar eclipse
June 21, 2020: Annular solar eclipse
July 5, 2020: Penumbral lunar eclipse

The first eclipse of the eclipse season on June 5, 2020, belongs to Lunar Saros 111 and presents the 67th of 71 eclipses in this Saros series. Yet, the third and final eclipse of the eclipse season on July 5, 2020, belongs to Lunar Saros 149, and features the third of 71 eclipses in this particular Saros series.

Unsurprisingly, perhaps, the second (or middle) eclipse of the eclipse season on June 21, 2020, is the 36th of 70 eclipses in Solar Saros 137.

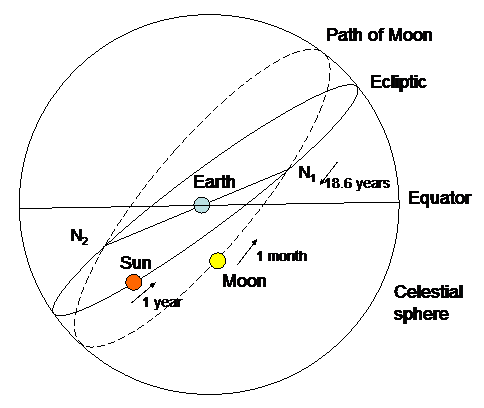
Line drawing of sphere with oblique view of orbits.

The plane of the moon’s orbit is inclined at 5 degrees to the plane of Earth’s orbit around the sun (the ecliptic). In this diagram, however, the ecliptic is portrayed as the sun’s apparent annual path in front of the constellations of the zodiac. The moon’s orbit intersects the ecliptic at two points called nodes (labeled here as N1 and N2). It’s the middle of the eclipse season whenever this line of nodes points directly at the sun. In the above diagram, the line of nodes does not point at the sun.

Bottom line: The middle of the eclipse season falls on June 20, 2020, and this eclipse season produces three eclipses (lunar/solar/lunar), though only the second of these three eclipses – the annular “ring of fire” eclipse on June 21, 2020 – will produce any real theatrics on the great stage of the sky.


from EarthSky https://ift.tt/2UkWFi1

Jupiter gives us Pluto in 2020

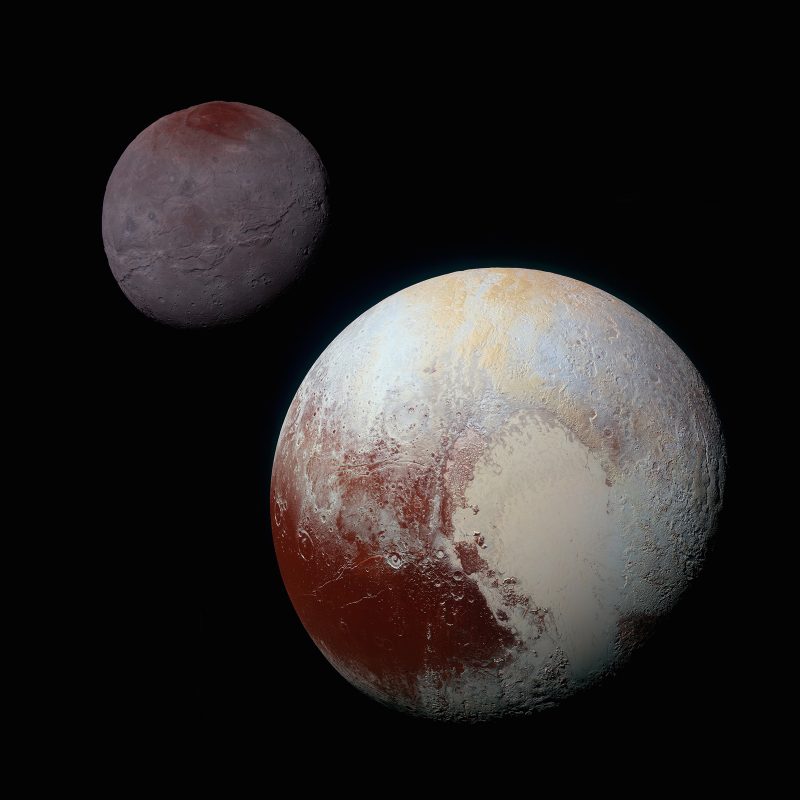
Multi-colored gray, russet, and tan planet with smaller gray moon.

Mosaic image of Pluto and its largest moon Charon, captured around the time the New Horizons spacecraft swept closest to them on July 14, 2015. Image via NASA/ JHUAPL/ SwRI.

The year 2020 is exceptional for Jupiter and Pluto. These two worlds are having a triple conjunction this year. They’ll come together, move apart, and come together again three times in 2020. The first conjunction took place on April 5. The second one will come on June 30, and the final one on November 12. Because all of these Jupiter-Pluto conjunctions happen when these two planets are actually visible in our night sky (as opposed to being lost in the sun’s glare), this year’s Jupiter-Pluto alignment may be the best for centuries to come.

This year, very bright Jupiter and very faint Pluto will remain near each other throughout the year, closely aligned in front of the constellation Sagittarius. Pluto requires a telescope to be seen. No telescope? Try NASA’s Night Sky Network to find star parties and/or astronomy clubs near you.

And you don’t need a telescope to use your imagination. Throughout 2020, dazzling Jupiter will enable us to envision Pluto with the mind’s eye on the sky’s dome. First find Jupiter and – presto – you’ve nearly stumbled upon Pluto. Just remember, Jupiter outshines Pluto by several million times.

Where are these worlds now? Both Pluto and Jupiter came out from behind the sun in January 2020, and then hovered low in the east before sunrise. Now – in June 2020 – these two worlds come up at late evening at mid-northern latitudes, and at mid-evening for the Southern Hemisphere. Jupiter and Pluto climb upward throughout the nighttime morning hours, to reach the meridian in the predawn/dawn sky on these June 2020 mornings.

Positions of moon, Saturn and Jupiter, with Pluto's position marked with an arrow.

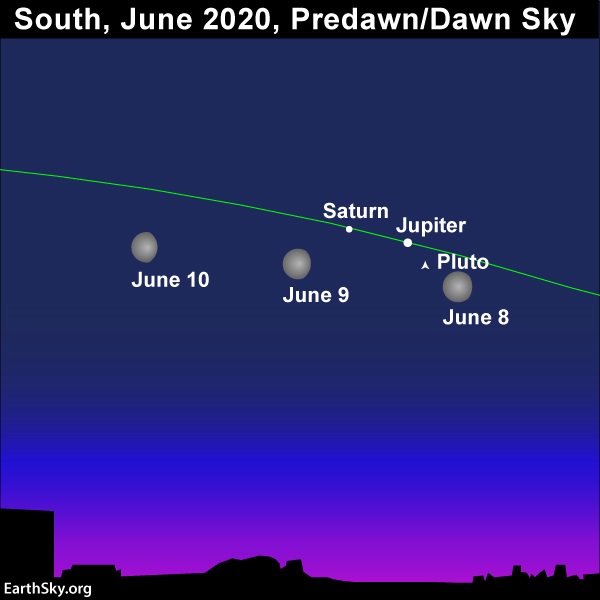
Jupiter is very bright. You can’t miss it from late night until dawn on the nights of June 6 to 8, 2020. On June 8, the waning gibbous moon sweeps 1.3 degrees south of Pluto, and then – a few hours later – the moon swings 2.2 degrees south of Jupiter (at 17:19 UTC on June 8, 2020). Both Jupiter and Pluto are traveling in retrograde (westward) all month long, though Jupiter at a faster pace. Jupiter will catch up with Pluto on June 30, 2020, to stage the second of this year’s three Jupiter/Pluto conjunctions.

Of course, although Jupiter and Pluto nearly align along the same line of sight throughout 2020, these two worlds aren’t close together in space. Jupiter is a bit more than 5 astronomical units (AU) from the sun, while Pluto lodges way beyond Jupiter, in the Kuiper Belt, at about 34 AU from the sun. One astronomical unit (AU) = one sun/Earth distance.

Jupiter’s and Pluto’s present distance in AU via Heavens-Above

Here’s some observational data about Pluto for 2020, from In-the-Sky.org

In a star field, one tiny dot jumps from one position to another.

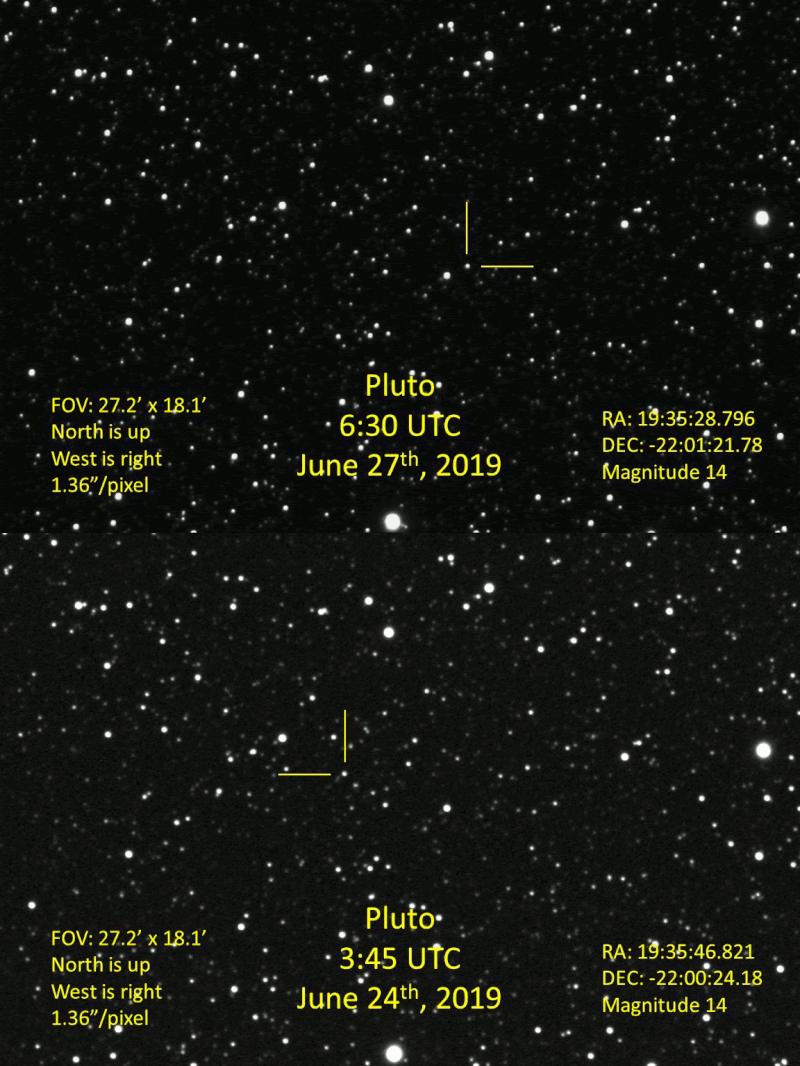
Steven Bellavia in Mattituck, New York, captured Pluto on 2 separate nights, June 24 and June 27, 2019. In this animated gif, you can see that Pluto moved in front of the stars between those 2 nights. Steven wrote: “Most of the motion you see is actually from the Earth, not Pluto, since our motion changes our perspective of the much-closer Pluto against the backdrop of the much-farther stars.” Thanks, Steven!

Two planets are said to be in conjunction whenever they reside north and south of one another on the sky’s dome. Conjunctions of Jupiter and Pluto recur in periods of 12 to 13 years. The previous Jupiter-Pluto conjunction happened on December 11, 2007, and the one before that on December 2, 1994. After 2020, the next Jupiter-Pluto conjunction will occur on February 4, 2033, and the one following that on April 12, 2045. But the gap between Jupiter and Pluto at each one of these conjunctions is quite far apart, and the conjunctions of 1994, 2007, and 2033 happen so close to the sun that even Jupiter is lost in the sun’s glare.

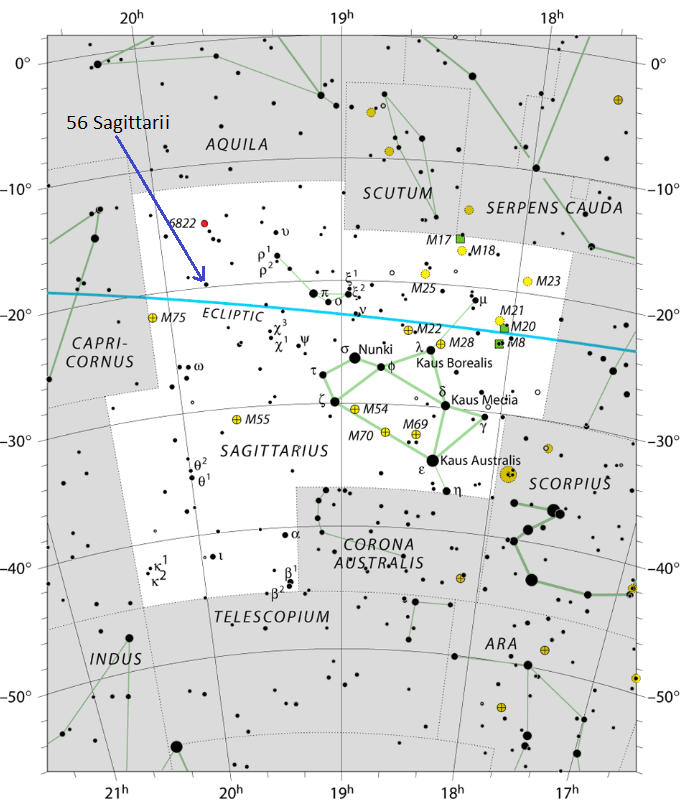
Far and away, 2020 presents the best alignment of Jupiter and Pluto in the 21st century (2001 to 2100). What’s more, Jupiter and Pluto stage three conjunctions this year, as Jupiter passes less than one degree north of Pluto at each conjunction on April 5, June 30 and November 12, 2020. (For reference, the moon’s angular diameter spans about 1/2 degree of sky.) All of these conjunctions in 2020 take place in front of the constellation Sagittarius, with Jupiter first passing Pluto on April 5 in prograde (going eastward in front of the backdrop stars), then sweeping past Pluto on June 30 in retrograde (going westward relative to the background stars), and then for the final Jupiter-Pluto conjunction on November 12 in prograde (eastward).

Sky chart of constellation Sagittarius, looking like a teapot, with the ecliptic running across the chart.

All three Jupiter-Saturn conjunctions on April 5, June 30 and November 12, 2020 take pace place in front of the constellation Sagittarius, not far from the 5th-magnitude star 56 Sagittarii. Constellation chart via International Astronomical Union (IAU).

Most of the time, a Jupiter-Pluto conjunction in any year is a solitary event, as Jupiter laps Pluto going eastward, and never looks back. Triple conjunctions of Jupiter and Pluto – which occur over a period of about 7.4 months – are rare because Jupiter has to first catch Pluto going prograde (eastward), then in retrograde (westward) and then in prograde (eastward) again. The three-peat performance last happened in 1955-56 (November 2, 1955; February 8 and June 16, 1956), and will next occur in 2106-07 (July 13 and November 2, 2106; February 19, 2107). Yet, all three conjunctions in 1955-56 were widely spaced, and all three conjunctions in 2106-07 will be widely spaced, too.

Diagram of planetary orbits projected onto a vertical screen.

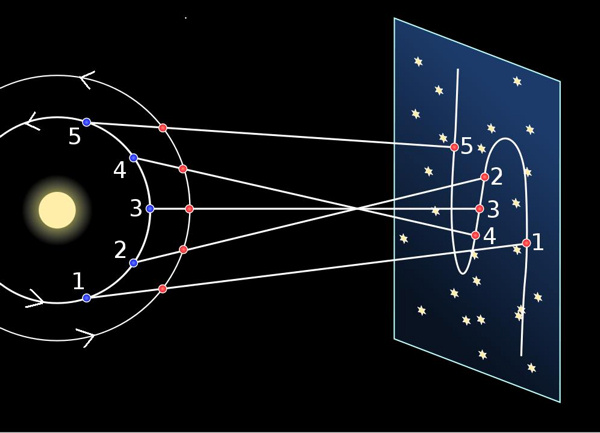
Illustration showing why a superior planet appears to go in retrograde (westward in front of the backdrop stars of the zodiac). As seen from the north side of the solar system, all the planets orbit counter-clockwise. When the faster-moving Earth goes by a slower-moving superior planet, that planet appears to go backward (in retrograde). In 2020, Mars is in retrograde from September 9 to November 15, Jupiter from May 14 to September 13, and Saturn from May 11 to September 29. Image via Wikimedia Commons.

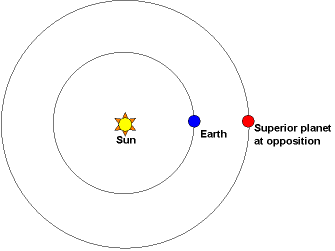
In other words, as we said above, 2020 may well showcase the best Jupiter-Pluto alignment for centuries to come. Most excitingly, both Jupiter and Pluto will reach opposition in mid-July 2020. At opposition, a superior planet – any planet revolving around the sun outside of Earth’s orbit – resides opposite the sun in Earth’s sky.

Diagram showing Earth between an outer planet and the sun.

Opposition happens when Earth flies between a superior planet, like Mars, and the sun. This happens yearly for most of the outer planets (and every other year for Mars). Illustration via Heavens-Above.

At opposition, a superior planet (or superior dwarf planet) rises at sunset and sets at sunrise, and is out all night long. It’s at opposition that a planet shines at its brightest best in Earth’s sky, and it’s at or near opposition that a planet comes closest to Earth for the year.

Jupiter reaches opposition on July 14, 2020, at about 8:00 UTC, and comes closest to Earth on July 15, 2020, at about 10:00 UTC.

Pluto reaches opposition on July 15, 2020, at about 19:00 UTC, and comes closest to Earth on July 13, 2020, at about 9:00 UTC.

In an uncanny bit of timing, the oppositions of Jupiter and Pluto happen almost concurrently in mid-July 2020. A planet reaches opposition midway through a retrograde. However, since Pluto resides so much farther from the sun than Jupiter does, Pluto’s retrograde lasts nearly 1 1/2 months (six weeks) longer than Jupiter’s four-month retrograde. So for near-unison oppositions, Pluto’s retrograde has to start – and end – approximately three weeks before – and after – Jupiter’s retrograde.

Jupiter and Pluto retrograde/opposition in 2020

Jupiter begins retrograde: May 14, 2020, in front of the constellation Sagittarius
Jupiter at opposition: July 14, 2020, in front of the constellation Sagittarius
Jupiter ends retrograde: September 13, 2020, in front of the constellation Sagittarius

Pluto begins retrograde: April 25, 2020, in front of the constellation Sagittarius
Pluto at opposition: July 15, 2020, in front of the constellation Sagittarius
Pluto ends retrograde: October 4, 2020, in front of the constellation Sagittarius

Jupiter-Pluto conjunction tables via Richard Nolle

Call it serendipity or synergy – or whatever – but the spectacular alignment of the king planet Jupiter with the dwarf planet Pluto doesn’t get much better than in 2020. A similarly good Jupiter-Pluto rendezvous might not happen again for a number of centuries to come.

Scattered bright dots of stars with one smaller one marked, the planet Pluto.

Pluto as seen with a 12″ S/C telescope (14.3 mag.) on July 10, 2015. Photo by Efrain Morales of Sociedad de Astronomia del Caribe. More information about Pluto’s current location.

Bottom line: Jupiter is as easy to find as the dwarf planet Pluto is difficult. Jupiter is bright! It ranks as the fourth-brightest celestial object to light up the heavens, after the sun, moon and Venus. Pluto, on the other hand, is 1,600 times dimmer than the faintest star visible to the unaided eye. But Jupiter can help you find – or at least envision – Pluto this year. That’s because these two worlds are having a triple conjunction this year; they’re near each other on the sky’s dome all year and will come exceptionally close 3 times in 2020.


from EarthSky https://ift.tt/2XkisVG