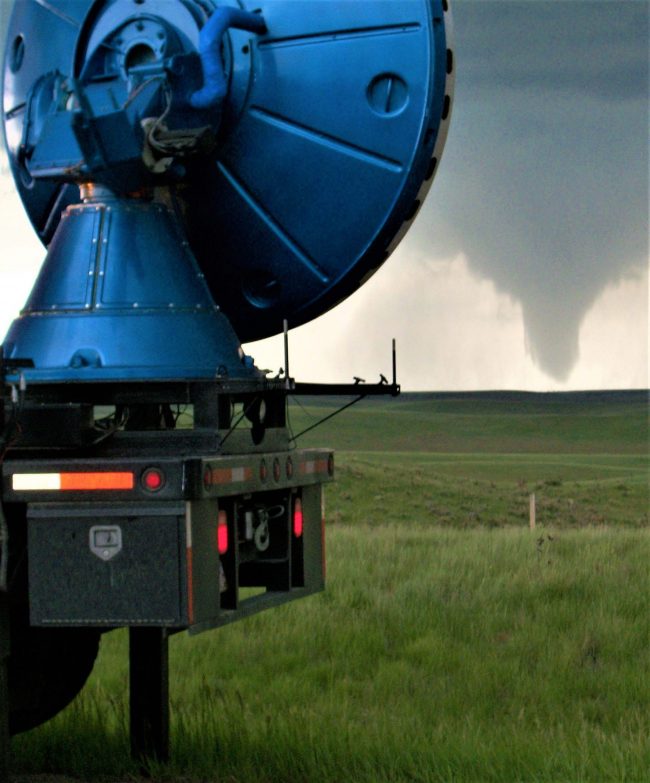

The Doppler on Wheels gathers information from a tornado in Wyoming on June 5, 2010. Image via Center for Severe Weather Research.
Researchers said on March 22, 2021, that their new study – which documents supercell-tornado wind intensities and sizes – reveals that these tornados both have stronger winds and are wider than previously recognized. They said that upwards of 20% of tornadoes have the potential to cause catastrophic EF-4/EF-5 damage. In other words, estimates of tornado size and intensity exceeds classification levels assigned by the National Weather Service. The National Weather Service rates tornadoes based on the damage they leave behind on the ground, using the Enhanced Fujita (EF) scale. But scientists in the field, using mobile Doppler radar to peer into these same tornadoes, are finding they should be 1.2 to 1.5 categories more severe than the ratings they’re receiving.
Tornado scientist Ted Fujita created a scale for measuring the strength of tornadoes. His scale has been improved on over the years, with the category name changing from an F scale (F for Fujita) to the EF scale for Enhanced Fujita. Tornadoes can be rated as low as 0, the weakest, all the way to 5, the strongest.

The Enhanced Fujita scale rates tornadoes based on the survey of damage on the ground and then assigns a category with associated wind speed. A new study shows the wind speeds directly measured don’t always correlate to the damage seen on the ground. Image via Wikipedia.
In a study published March 22, 2021, in the peer-reviewed journal Proceedings of the National Academy of Sciences, Joshua Wurman of the University of Illinois Urbana-Champaign and a team of scientists explained how their in-the-field measurements conflict with ratings that are based on damage seen on the ground. In one tornado that struck outside Orleans, Nebraska, on May 22, 2004, the National Weather Service rated the tornado an EF-0, which equates to 65–85 mph winds and only light damage. The team’s mobile radar unit, known as Doppler on Wheels, measured winds of 72 meters a second, or 161 miles per hour, which would classify the tornado as an EF-3 (136–165 mph, or displaying severe damage). Why the discrepancy?
The May 22, 2004, Nebraska tornado passed over a rural location, where nothing much on the ground was affected. When ratings are based on what is destroyed, and there is either not much in the tornado’s vicinity to destroy or a particularly sturdy building, the true intensity of the tornado can’t be gauged. The study finds that tornado ratings are biased toward less severe categories because many tornadoes either pass over rural locations such as fields, while some hit well-engineered buildings, causing less damage than expected.
The team analyzed wind speed measurements of 120 tornadoes with the help of the Doppler on Wheels and compared them to ratings given to the same tornadoes by the National Weather Service. These direct measurements of the tornadoes had a median peak wind speed at around 60 meters a second, or 134 miles per hour, which would have earned scores of EF-2 or EF-3. The team found that the strongest tornadoes, those that would earn a rating of EF-4 or EF-5, can occur in about 20 percent of observed tornadoes.

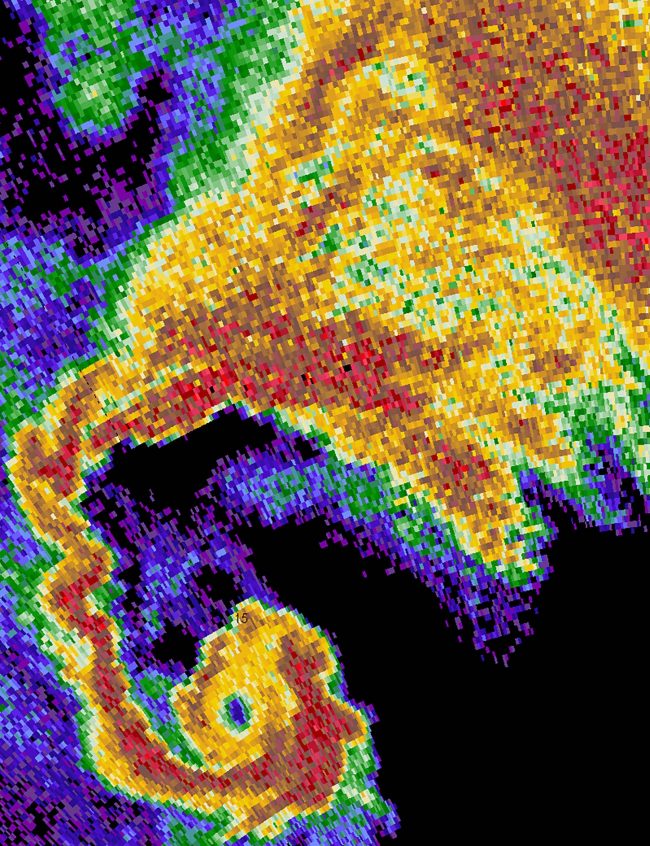
Doppler radar images from the Doppler on Wheels let researchers get an up close and personal look at what’s going on inside the tornados. The hook echo and tornado in this radar image shows fine-scale resolution. Image via Center for Severe Weather Research.
It was not only the wind speeds that the team of researchers found differed from the National Weather Service ratings, but the physical size of the tornadoes. The study showed the median tornado diameter at around 820-1640 feet (250-500 meters), which is wider than that indicated by damage-based surveys alone.
Overall, the scientists found that tornadoes are being classified as weaker and smaller than the reality revealed by radar. The team suggests that tornado risk assessments, as well as wind-resistance standards for buildings, may need to be upgraded to reflect the observed strength and size of tornadoes.
Bottom line: According to actual measurements of tornadoes conducted in the field by mobile Doppler radars, tornadoes are typically much stronger and wider than damage surveys indicate.
Source: Supercell tornadoes are much stronger and wider than damage-based ratings indicate
from EarthSky https://ift.tt/3sywW4A


The Doppler on Wheels gathers information from a tornado in Wyoming on June 5, 2010. Image via Center for Severe Weather Research.
Researchers said on March 22, 2021, that their new study – which documents supercell-tornado wind intensities and sizes – reveals that these tornados both have stronger winds and are wider than previously recognized. They said that upwards of 20% of tornadoes have the potential to cause catastrophic EF-4/EF-5 damage. In other words, estimates of tornado size and intensity exceeds classification levels assigned by the National Weather Service. The National Weather Service rates tornadoes based on the damage they leave behind on the ground, using the Enhanced Fujita (EF) scale. But scientists in the field, using mobile Doppler radar to peer into these same tornadoes, are finding they should be 1.2 to 1.5 categories more severe than the ratings they’re receiving.
Tornado scientist Ted Fujita created a scale for measuring the strength of tornadoes. His scale has been improved on over the years, with the category name changing from an F scale (F for Fujita) to the EF scale for Enhanced Fujita. Tornadoes can be rated as low as 0, the weakest, all the way to 5, the strongest.

The Enhanced Fujita scale rates tornadoes based on the survey of damage on the ground and then assigns a category with associated wind speed. A new study shows the wind speeds directly measured don’t always correlate to the damage seen on the ground. Image via Wikipedia.
In a study published March 22, 2021, in the peer-reviewed journal Proceedings of the National Academy of Sciences, Joshua Wurman of the University of Illinois Urbana-Champaign and a team of scientists explained how their in-the-field measurements conflict with ratings that are based on damage seen on the ground. In one tornado that struck outside Orleans, Nebraska, on May 22, 2004, the National Weather Service rated the tornado an EF-0, which equates to 65–85 mph winds and only light damage. The team’s mobile radar unit, known as Doppler on Wheels, measured winds of 72 meters a second, or 161 miles per hour, which would classify the tornado as an EF-3 (136–165 mph, or displaying severe damage). Why the discrepancy?
The May 22, 2004, Nebraska tornado passed over a rural location, where nothing much on the ground was affected. When ratings are based on what is destroyed, and there is either not much in the tornado’s vicinity to destroy or a particularly sturdy building, the true intensity of the tornado can’t be gauged. The study finds that tornado ratings are biased toward less severe categories because many tornadoes either pass over rural locations such as fields, while some hit well-engineered buildings, causing less damage than expected.
The team analyzed wind speed measurements of 120 tornadoes with the help of the Doppler on Wheels and compared them to ratings given to the same tornadoes by the National Weather Service. These direct measurements of the tornadoes had a median peak wind speed at around 60 meters a second, or 134 miles per hour, which would have earned scores of EF-2 or EF-3. The team found that the strongest tornadoes, those that would earn a rating of EF-4 or EF-5, can occur in about 20 percent of observed tornadoes.

Doppler radar images from the Doppler on Wheels let researchers get an up close and personal look at what’s going on inside the tornados. The hook echo and tornado in this radar image shows fine-scale resolution. Image via Center for Severe Weather Research.
It was not only the wind speeds that the team of researchers found differed from the National Weather Service ratings, but the physical size of the tornadoes. The study showed the median tornado diameter at around 820-1640 feet (250-500 meters), which is wider than that indicated by damage-based surveys alone.
Overall, the scientists found that tornadoes are being classified as weaker and smaller than the reality revealed by radar. The team suggests that tornado risk assessments, as well as wind-resistance standards for buildings, may need to be upgraded to reflect the observed strength and size of tornadoes.
Bottom line: According to actual measurements of tornadoes conducted in the field by mobile Doppler radars, tornadoes are typically much stronger and wider than damage surveys indicate.
Source: Supercell tornadoes are much stronger and wider than damage-based ratings indicate
from EarthSky https://ift.tt/3sywW4A

Aucun commentaire:
Enregistrer un commentaire