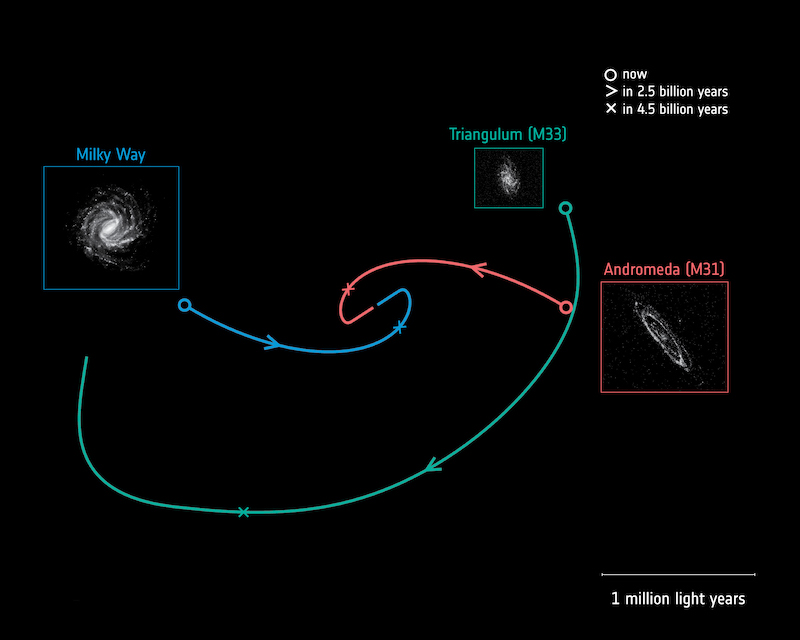

Boom! Future motions of the Milky Way and Andromeda galaxies show them on a collision course. Meanwhile, the 3rd major galaxy in our Local Group – the Triangulum galaxy – is likely to give the collision a wide berth. Image via ESA/Gaia/DPAC.
Astronomers have said for some time that the nearby Andromeda galaxy – also known as M31, nearest large spiral galaxy to our home Milky Way – will one day collide with the Milky Way. On February 7, 2019, the European Space Agency (ESA) provided an update on the newest insights about this impending collision, based on data from its Gaia satellite. Across the course of 2018, astronomers announced multiple, very interesting discoveries about our galaxy, based on Gaia’s second data release last April. Now Gaia has looked beyond the Milky Way, at the motions of stars within both the Andromeda galaxy and the Triangulum galaxy (aka M33), which is the third large galaxy in our Local Group. The data reveal some surprises about the Andromeda galaxy’s collision course with the Milky Way.
The first surprise is a new estimate for when the collision will occur. Astronomers thought it would happen some 3.9 billion years from now. But the astronomers who studied Gaia’s data said they now believe it’ll happen 600 million years later than previously estimated, perhaps 4.5 billion years from now. What’s more, they said, the Andromeda galaxy is:
… likely to deliver more of a glancing blow to the Milky Way than a head-on collision.
These results were published February 7 in the peer-reviewed Astrophysical Journal. Astronomer Roeland van der Marel of the Space Telescope Science Institute in Baltimore – who led the study – commented:
We needed to explore the galaxies’ motions in 3D to uncover how they have grown and evolved, and what creates and influences their features and behavior.
We were able to do this using the second package of high-quality data released by Gaia.

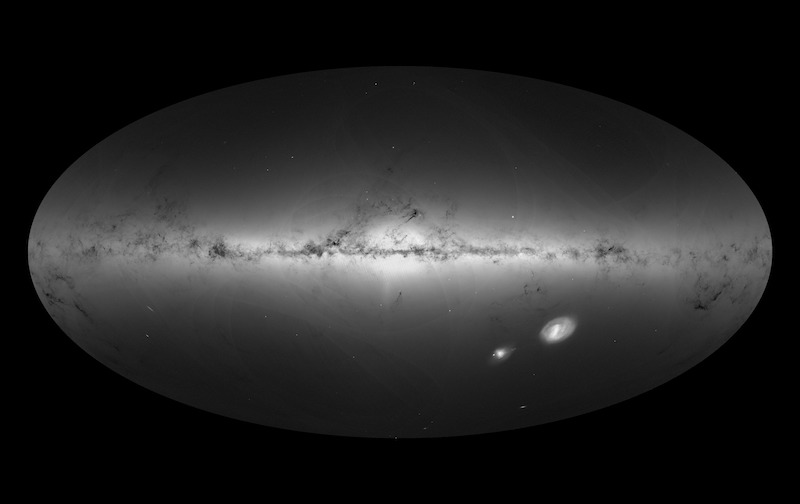
An all-sky view of our Milky Way galaxy and neighboring galaxies, based on measurements of nearly 1.7 billion stars in Gaia’s 2nd data release. The map shows the density of stars observed by Gaia in each portion of the sky from July 2014 to May 2016. Image via ESA/Gaia/DPAC. Read more about this image.
Gaia does what is called astrometry. Its job is to scan the sky repeatedly, observing each of its targeted billion-plus stars an average of 70 times over its five-year mission. Again and again and again, Gaia will acquire data points on the positions of stars in the Milky Way, and now in the Andromeda and Triangulum galaxies, too. We know that stars move through space. Gaia will tell us, exactly, how they moved during that five-year period.
It may not sound very dramatic. But it is. That much knowledge about star motions – actual data on the motions of more than a billion stars – is unprecedented in the history of astronomy. That is why there have been so many astounding discoveries from Gaia already, like this one and this one and this one.
Ultimately, Gaia’s data will be used to build the most precise 3D map of the stars in the nearby universe, ever. A statement from ESA explained:
Previous studies of the Local Group have combined observations from telescopes including the NASA/ESA Hubble Space Telescope and the ground-based Very Long Baseline Array to figure out how the orbits of Andromeda and Triangulum have changed over time. The two disk-shaped spiral galaxies are located between 2.5 and 3 million light-years from us, and are close enough to one another that they may be interacting.
Two possibilities emerged: either Triangulum is on an incredibly long six-billion-year orbit around Andromeda but has already fallen into it in the past, or it is currently on its very first infall.
Each scenario reflects a different orbital path, and thus a different formation history and future for each galaxy.
That was where things stood until Gaia came along.

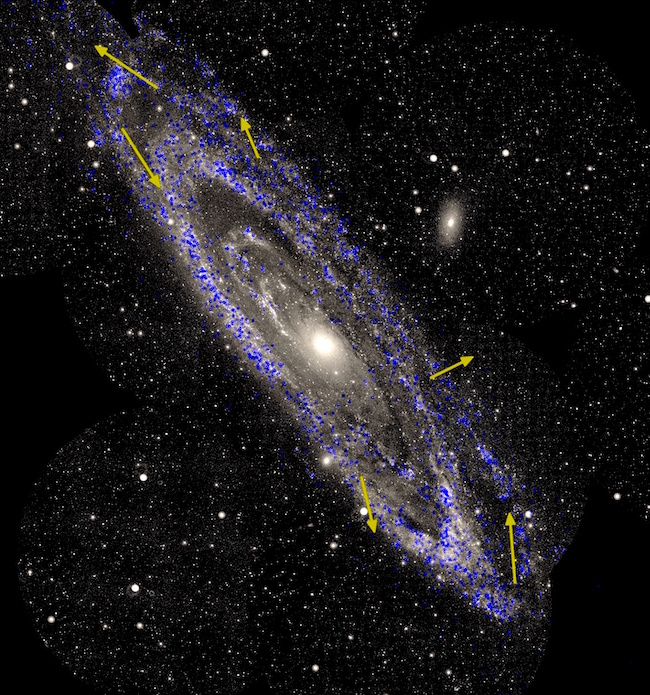
Stellar motions in the Andromeda galaxy. Image via NASA/ Gaia/ Galex/ ESA. Read more about this image.
Mark Fardal, also of Space Telescope Science Institute, is second author on the new paper. He explained:
We combed through the Gaia data to identify thousands of individual stars in both galaxies, and studied how these stars moved within their galactic homes
While Gaia primarily aims to study the Milky Way, it’s powerful enough to spot especially massive and bright stars within nearby star-forming regions – even in galaxies beyond our own.
The stellar motions measured by Gaia not only reveal how each of the galaxies moves through space, but also how each rotates around its own spin axis, ESA said, adding:
A century ago, when astronomers were first trying to understand the nature of galaxies, these spin measurements were much sought-after, but could not be successfully completed with the telescopes available at the time.

The sharpest-ever view of the Triangulum galaxy – aka M33 – via the Hubble Space Telescope. This image is a composite of about 54 different pointings with Hubble’s Advanced Camera for Surveys. It’s the second-largest image ever released by Hubble. Read more about this image. Want to see Hubble’s largest image ever? Look at the image below this one.
Roeland said:
It took an observatory as advanced as Gaia to finally do so. For the first time, we’ve measured how M31 and M33 rotate on the sky. Astronomers used to see galaxies as clustered worlds that couldn’t possibly be separate ‘islands’, but we now know otherwise.
It has taken 100 years and Gaia to finally measure the true, tiny, rotation rate of our nearest large galactic neighbor, M31. This will help us to understand more about the nature of galaxies.

Sharpest-ever view of the Andromeda galaxy, via the Hubble Space Telescope. You’d need more than 600 HD TV screens to display the whole image, which is best appreciated using this zoom tool. The Hubble Telescope has provided sharp views of the Andromeda and Triangulum galaxies. But Gaia was needed to understand the motions of stars within them. Read more about this image.
Bottom line: An analysis of data from Gaia’s second data release revealed an longer-than-expected timeline for the impending collision between our Milky Way galaxy and the neighboring Andromeda galaxy. The data also show that the collision is likely to be a glancing blow, rather than the head-on crash that had been expected previously.
Find the Andromeda galaxy by star-hopping from Pegasus
EarthSky lunar calendars are cool! They make great gifts. Order now.
from EarthSky http://bit.ly/2Sx7H48


Boom! Future motions of the Milky Way and Andromeda galaxies show them on a collision course. Meanwhile, the 3rd major galaxy in our Local Group – the Triangulum galaxy – is likely to give the collision a wide berth. Image via ESA/Gaia/DPAC.
Astronomers have said for some time that the nearby Andromeda galaxy – also known as M31, nearest large spiral galaxy to our home Milky Way – will one day collide with the Milky Way. On February 7, 2019, the European Space Agency (ESA) provided an update on the newest insights about this impending collision, based on data from its Gaia satellite. Across the course of 2018, astronomers announced multiple, very interesting discoveries about our galaxy, based on Gaia’s second data release last April. Now Gaia has looked beyond the Milky Way, at the motions of stars within both the Andromeda galaxy and the Triangulum galaxy (aka M33), which is the third large galaxy in our Local Group. The data reveal some surprises about the Andromeda galaxy’s collision course with the Milky Way.
The first surprise is a new estimate for when the collision will occur. Astronomers thought it would happen some 3.9 billion years from now. But the astronomers who studied Gaia’s data said they now believe it’ll happen 600 million years later than previously estimated, perhaps 4.5 billion years from now. What’s more, they said, the Andromeda galaxy is:
… likely to deliver more of a glancing blow to the Milky Way than a head-on collision.
These results were published February 7 in the peer-reviewed Astrophysical Journal. Astronomer Roeland van der Marel of the Space Telescope Science Institute in Baltimore – who led the study – commented:
We needed to explore the galaxies’ motions in 3D to uncover how they have grown and evolved, and what creates and influences their features and behavior.
We were able to do this using the second package of high-quality data released by Gaia.

An all-sky view of our Milky Way galaxy and neighboring galaxies, based on measurements of nearly 1.7 billion stars in Gaia’s 2nd data release. The map shows the density of stars observed by Gaia in each portion of the sky from July 2014 to May 2016. Image via ESA/Gaia/DPAC. Read more about this image.
Gaia does what is called astrometry. Its job is to scan the sky repeatedly, observing each of its targeted billion-plus stars an average of 70 times over its five-year mission. Again and again and again, Gaia will acquire data points on the positions of stars in the Milky Way, and now in the Andromeda and Triangulum galaxies, too. We know that stars move through space. Gaia will tell us, exactly, how they moved during that five-year period.
It may not sound very dramatic. But it is. That much knowledge about star motions – actual data on the motions of more than a billion stars – is unprecedented in the history of astronomy. That is why there have been so many astounding discoveries from Gaia already, like this one and this one and this one.
Ultimately, Gaia’s data will be used to build the most precise 3D map of the stars in the nearby universe, ever. A statement from ESA explained:
Previous studies of the Local Group have combined observations from telescopes including the NASA/ESA Hubble Space Telescope and the ground-based Very Long Baseline Array to figure out how the orbits of Andromeda and Triangulum have changed over time. The two disk-shaped spiral galaxies are located between 2.5 and 3 million light-years from us, and are close enough to one another that they may be interacting.
Two possibilities emerged: either Triangulum is on an incredibly long six-billion-year orbit around Andromeda but has already fallen into it in the past, or it is currently on its very first infall.
Each scenario reflects a different orbital path, and thus a different formation history and future for each galaxy.
That was where things stood until Gaia came along.

Stellar motions in the Andromeda galaxy. Image via NASA/ Gaia/ Galex/ ESA. Read more about this image.
Mark Fardal, also of Space Telescope Science Institute, is second author on the new paper. He explained:
We combed through the Gaia data to identify thousands of individual stars in both galaxies, and studied how these stars moved within their galactic homes
While Gaia primarily aims to study the Milky Way, it’s powerful enough to spot especially massive and bright stars within nearby star-forming regions – even in galaxies beyond our own.
The stellar motions measured by Gaia not only reveal how each of the galaxies moves through space, but also how each rotates around its own spin axis, ESA said, adding:
A century ago, when astronomers were first trying to understand the nature of galaxies, these spin measurements were much sought-after, but could not be successfully completed with the telescopes available at the time.

The sharpest-ever view of the Triangulum galaxy – aka M33 – via the Hubble Space Telescope. This image is a composite of about 54 different pointings with Hubble’s Advanced Camera for Surveys. It’s the second-largest image ever released by Hubble. Read more about this image. Want to see Hubble’s largest image ever? Look at the image below this one.
Roeland said:
It took an observatory as advanced as Gaia to finally do so. For the first time, we’ve measured how M31 and M33 rotate on the sky. Astronomers used to see galaxies as clustered worlds that couldn’t possibly be separate ‘islands’, but we now know otherwise.
It has taken 100 years and Gaia to finally measure the true, tiny, rotation rate of our nearest large galactic neighbor, M31. This will help us to understand more about the nature of galaxies.

Sharpest-ever view of the Andromeda galaxy, via the Hubble Space Telescope. You’d need more than 600 HD TV screens to display the whole image, which is best appreciated using this zoom tool. The Hubble Telescope has provided sharp views of the Andromeda and Triangulum galaxies. But Gaia was needed to understand the motions of stars within them. Read more about this image.
Bottom line: An analysis of data from Gaia’s second data release revealed an longer-than-expected timeline for the impending collision between our Milky Way galaxy and the neighboring Andromeda galaxy. The data also show that the collision is likely to be a glancing blow, rather than the head-on crash that had been expected previously.
Find the Andromeda galaxy by star-hopping from Pegasus
EarthSky lunar calendars are cool! They make great gifts. Order now.
from EarthSky http://bit.ly/2Sx7H48

Aucun commentaire:
Enregistrer un commentaire