Kilauea’s Fissure 8 has been particularly dramatic, regularly generating large fountains of lava that soared tens to hundreds of feet into the air. Fissure 8 also produced a large, channelized lava flow that acted like a river, eating through the landscape as it flowed toward the sea. USGS image taken June 12, 2018. The ongoing event is now said to be one of Kilauea’s most destructive eruptions in modern times. View the latest images and videos via USGS.

Laze – consisting of steam, volcanic gases, and shards of glass – billows into the air as lava pours into the sea in this June 27, 2018, image. Pierre Markuse created this image using data from Sentinel-2, a satellite managed by the European Space Agency. He regularly downloads and processes Sentinel and Landsat satellite data and has posted dozens of Kilauea images on Flickr. Image via ESA/Sentinel-2/Markuse/NASA.

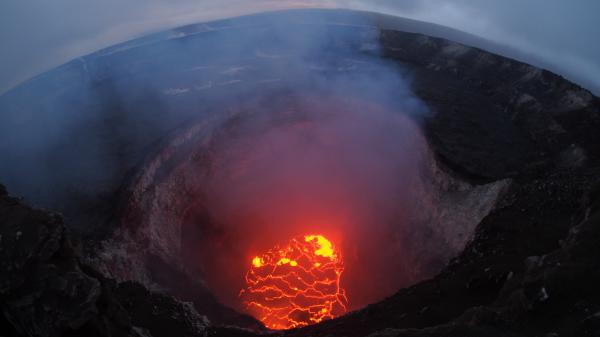
The lava lake at the summit of Kilauea, via @USGSVolcanoes on Twitter.

NASA Astronaut Ricky Arnold tweeted this nighttime photograph of lava from Kilauea volcano on June 20, 2018. Image via NASA.

Notice the stark differences in landscapes on the northern and southern sides of the lava channel in this July 10, 2018, image. With trade winds blowing heat and volcanic gases to the southwest, the north side remained green. Vegetation on the south side, yellowed and brown, took a battering. Image via USGS.

Look at this image, and then the one just below. As lava flows from some parts of Kilauea, other parts of the volcano have been sinking. In the case of the summit caldera, the rate of subsidence has been dramatic. This is an InSAR (interferometric synthetic aperature radar) image – called an interferogram – showing surface movement at the summit caldera between June 9 and June 23, 2018. Each cycle of yellow-blue-purple indicates approximately 5 inches (13 cm) of movement. Areas where the colorful lines are the closest have shifted the most. Read more about this image and type of data from NASA’s Disasters Program. Image via NASA/ JAXA.
This sequence of images shows same caldera collapse as that in the image above, seen from the ground. The images show rapid subsidence of the caldera floor, along with the development of scarps. You’re seeing 1 photograph per day between June 13 and 24, 2018. USGS captured these photos from the southern caldera rim, near Keanakako’i Crater.
The European Space Agency’s Copernicus Sentinel-2 captured these images of the Kilauea volcano on Hawaii’s Big Island. One is from May 23, 2018, and the other is from June 7, 2018. Image via ESA.
Bottom line: A compilation of photos and videos showing the 2018 Kilauea volcano eruption.
from EarthSky https://ift.tt/2NBbyHi
Kilauea’s Fissure 8 has been particularly dramatic, regularly generating large fountains of lava that soared tens to hundreds of feet into the air. Fissure 8 also produced a large, channelized lava flow that acted like a river, eating through the landscape as it flowed toward the sea. USGS image taken June 12, 2018. The ongoing event is now said to be one of Kilauea’s most destructive eruptions in modern times. View the latest images and videos via USGS.

Laze – consisting of steam, volcanic gases, and shards of glass – billows into the air as lava pours into the sea in this June 27, 2018, image. Pierre Markuse created this image using data from Sentinel-2, a satellite managed by the European Space Agency. He regularly downloads and processes Sentinel and Landsat satellite data and has posted dozens of Kilauea images on Flickr. Image via ESA/Sentinel-2/Markuse/NASA.

The lava lake at the summit of Kilauea, via @USGSVolcanoes on Twitter.

NASA Astronaut Ricky Arnold tweeted this nighttime photograph of lava from Kilauea volcano on June 20, 2018. Image via NASA.

Notice the stark differences in landscapes on the northern and southern sides of the lava channel in this July 10, 2018, image. With trade winds blowing heat and volcanic gases to the southwest, the north side remained green. Vegetation on the south side, yellowed and brown, took a battering. Image via USGS.

Look at this image, and then the one just below. As lava flows from some parts of Kilauea, other parts of the volcano have been sinking. In the case of the summit caldera, the rate of subsidence has been dramatic. This is an InSAR (interferometric synthetic aperature radar) image – called an interferogram – showing surface movement at the summit caldera between June 9 and June 23, 2018. Each cycle of yellow-blue-purple indicates approximately 5 inches (13 cm) of movement. Areas where the colorful lines are the closest have shifted the most. Read more about this image and type of data from NASA’s Disasters Program. Image via NASA/ JAXA.
This sequence of images shows same caldera collapse as that in the image above, seen from the ground. The images show rapid subsidence of the caldera floor, along with the development of scarps. You’re seeing 1 photograph per day between June 13 and 24, 2018. USGS captured these photos from the southern caldera rim, near Keanakako’i Crater.
The European Space Agency’s Copernicus Sentinel-2 captured these images of the Kilauea volcano on Hawaii’s Big Island. One is from May 23, 2018, and the other is from June 7, 2018. Image via ESA.
Bottom line: A compilation of photos and videos showing the 2018 Kilauea volcano eruption.
from EarthSky https://ift.tt/2NBbyHi

Aucun commentaire:
Enregistrer un commentaire