New research, June 25 - July 1, 2018

A selection of new climate related research articles is shown below.

Climate change impacts

Mankind

Quantifying transnational climate impact exposure: New perspectives on the global distribution of climate risk

The effects of increasing surface reflectivity on heat-related mortality in Greater Montreal Area, Canada

Synthesis and Review: an inter-method comparison of climate change impacts on agriculture (open access)

Future warming increases probability of globally synchronized maize production shocks

Satellite sun‐induced chlorophyll fluorescence detects early response of winter wheat to heat stress in the Indian Indo‐Gangetic Plains

Statistical modelling of crop yield in Central Europe using climate data and remote sensing vegetation indices

Comparison of climatic impacts transmission from temperature to grain harvests and economies between the Han (206 BC–AD 220) and Tang (AD 618–907) dynasties

The effects of tactical message inserts on risk communication with fish farmers in Northern Thailand

Spatial assessment of maize physical drought vulnerability in sub-Saharan Africa: Linking drought exposure with crop failure (open access)

Rescaling drought mitigation in rural Sri Lanka

A stakeholder-based assessment of barriers to climate change adaptation in a water-scarce basin in Spain (open access)

Climate change adaptation: Linking indigenous knowledge with western science for effective adaptation

Biosphere

Population-specific responses in physiological rates of Emiliania huxleyi to a broad CO2 range (open access)

Shifts in phenological distributions reshape interaction potential in natural communities

Warming and oligotrophication cause shifts in freshwater phytoplankton communities

Biogeophysical controls on soil-atmosphere thermal differences: implications on warming Arctic ecosystems (open access)

Climate change increases ecogeographic isolation between closely related plants

Spatial relationship between climatic diversity and biodiversity conservation value

Rapid thermal adaptation in a marine diatom reveals constraints and tradeoffs

Traits drive global wood decomposition rates more than climate

Limited prospects for future alpine treeline advance in the Canadian Rocky Mountains

Temperature change along elevation and its effect on the Alpine timberline tree growth in the southeast of the Tibetan Plateau (open access)

Warming‐induced earlier greenup leads to reduced stream discharge in a temperate mixed forest catchment

A Meta‐Analysis of Temperature Sensitivity as a Microbial Trait

Forest drought resistance distinguished by canopy height (open access)

Diverse responses of vegetation growth to meteorological drought across climate zones and land biomes in northern China from 1981 to 2014

Climate change mitigation

Climate change communication

The climate change dilemma: big science, the globalizing of climate and the loss of the human scale

Emission savings

Chinese Provinces' CO2 Emissions Embodied in Imports and Exports (open access)

China's energy consumption in the new normal (open access)

Policies to enhance the drivers of green housing development in China

Energy production

Low carbon scenarios and policies for the power sector in Botswana

Climate Policy

Carbon pricing and deep decarbonisation (open access)

Geoengineering

Increasing Arctic Sea Ice Albedo Using Localized Reversible Geoengineering (open access)

Climate change

On the Relative Robustness of the Climate Response to High‐Latitude and Low‐Latitude Warming (open access)

Towards a European Climate Prediction System

Temperature, precipitation, wind

Strengthened Indonesian Throughflow Drives Decadal Warming in the Southern Indian Ocean

Comparison of missing value estimation techniques in rainfall data of Bangladesh

Projected timing of perceivable changes in climate extremes for terrestrial and marine ecosystems

Changes in climatic elements in the Pan-Hexi region during 1960–2014 and responses to global climatic changes

Changes of heating and cooling degree days over China in response to global warming of 1.5°C, 2°C, 3°C and 4°C (open access)

The Interannual Variability of Sea Surface Temperature in the Red Sea from 35 Years of Satellite and In Situ Observations

Seasonal and regional patterns of future temperature extremes: High‐resolution dynamic downscaling over a complex terrain

Ultralow Surface Temperatures in East Antarctica From Satellite Thermal Infrared Mapping: The Coldest Places on Earth (open access)

Rain-on-snow events in Alaska, their frequency and distribution from satellite observations (open access)

Extreme events

Changes of Tropical Cyclone Tracks in the Western North Pacific over the past 38 years (open access)

The Dark Side of Hurricane Matthew: Unique Perspectives from the VIIRS Day/Night Band (open access)

Projection of Landfalling Tropical Cyclone Rainfall in the Eastern United States under Anthropogenic Warming

Projection of drought hazards in China during twenty-first century

Changes in record-breaking temperature events in China and projections for the future

Additional Intensification of Seasonal Heat and Flooding Extreme over China in a 2°C Warmer World Compared to 1.5°C (open access)

How far in advance can we predict changes in large‐scale flow leading to severe cold conditions over Europe?

Future changes in precipitation extremes over China projected by a regional climate model ensemble

How uneven are changes to impact‐relevant climate hazards in a 1.5°C world and beyond?

Forcings and feedbacks

Sunlight, clouds, sea ice, albedo, and the radiative budget: the umbrella versus the blanket (open access)

Lakes on the Tibetan Plateau as conduits of greenhouse gases to the atmosphere

Assessment of satellite-retrieved surface UVA and UVB radiation by comparison with ground-measurements and trends over Mega-city Delhi

Cryosphere

Regional trends in weather systems help explain Antarctic sea ice trends

Observations and modelling of algal growth on a snowpack in north-western Greenland (open access)

Greenland Ice Sheet – Higher non‐linearity of ice flow significantly reduces estimated basal motion

Improving Greenland surface mass balance estimates through the assimilation of MODIS albedo: a case study along the K‐transect

Autonomous ice sheet surface mass balance measurements from cosmic rays (open access)

Anthropogenic Warming Impacts on Today's Sierra Nevada Snowpack and Flood Risk

Developing a composite daily snow cover extent record over the Tibetan Plateau from 1981 to 2016 using multisource data

Anomalous glacier changes in the southeast of Tuomuer‐Khan Tengri Mountain Ranges, Central Tianshan

Thermal Characteristics and Recent Changes of Permafrost in the Upper Reaches of the Heihe River Basin, Western China

Changing river ice seasonality and impacts on interior Alaskan communities

Atmospheric response to kilometer‐scale changes in sea‐ice concentration within the Marginal Ice Zone

Hydrosphere 

Adding new evidence to the attribution puzzle of the recent water shortage over São Paulo (Brazil)

Enhanced Rates of Regional Warming and Ocean Acidification after Termination of Large‐scale Ocean Alkalinization

Interdecadal sea level variations in the Pacific: Distinctions between the tropics and extratropics

Atmospheric and oceanic circulation

The Influence of Arctic Amplification on Mid-latitude Weather and Climate

Carbon cycle

Large‐Scale Droughts Responsible for Dramatic Reductions of Terrestrial Net Carbon Uptake over North America in 2011 and 2012

A Biogeochemical Compromise: The High Methane Cost of Sequestering Carbon in Restored Wetlands

Carbon stocks, sequestration, and emissions of wetlands in south eastern Australia

Utilizing the Drake Passage Time-series to understand variability and change in subpolar Southern Ocean pCO2 (open access)

Carbon emissions from Southeast Asian peatlands will increase despite emission‐reduction schemes

Temperature response of respiration across the heterogeneous landscape of the Alaskan Arctic tundra

Temporal variability in surface water pCO2 in Adventfjorden (West Spitsbergen) with emphasis on physical and biogeochemical drivers

Enhanced response of global wetland methane emissions to the 2015–2016 El Niño-Southern Oscillation event (open access)

Soil moisture stress as a major driver of carbon cycle uncertainty

Other papers

Palaeoclimatology

The effect of obliquity‐driven changes on paleoclimate sensitivity during the late Pleistocene

Increasing Temperature Sensitivity caused by Climate Warming, Evidence from Northeastern China

Candidate sites of 1.5 Myr old ice 37 km southwest of the Dome C summit, East Antarctica (open access)


from Skeptical Science https://ift.tt/2m0qsLw

Computer simulation suggests risk-based breast screening could have benefits

Mammogram

When it comes to breast cancer screening, there’s a delicate balance between the benefits and harms.

Breast screening can save lives by picking up breast cancers at an earlier stage, when treatment is more likely to be successful. But it also picks up some cancers that would never have gone on to cause harm. This is called overdiagnosis. At the moment, we can’t tell harmless and harmful cancers apart, so all women will be offered treatment, meaning many women will be treated unnecessarily.

For each woman whose life is saved by breast cancer screening, around three will be diagnosed with a cancer that would have caused any problems.

Scientists are looking for a way to minimise the harms of breast screening, tipping the balance towards the benefits. And adapting the NHS breast screening programme based on a woman’s risk of breast cancer could do just that, according to new predictions.

Results from a study using computer simulations, published in the journal JAMA Oncology, suggests that only screening women deemed at a ‘high risk’ of breast cancer could help to reduce unnecessary diagnoses, and would be more affordable for the NHS.

While this is a promising start, the study was run entirely on computer programmes. Researchers used NHS figures to predict the impact of adapting the NHS screening programme to only screen women who meet certain genetic risk criteria.

Professor Fiona Gilbert, a co-author of the study from the University of Cambridge, said: “We need to change the model of delivery of breast screening and recognise that women are individuals with different risks and lifestyles. They should be offered screening tailored to their own profile.”

What did the study show?

The current NHS breast screening programme invites all women aged 50-69 for a mammogram every three years.

Researchers ran computer simulations on a hypothetical group of women. They compared three different approaches to screening:

  • no screening programme
  • the current age-based NHS screening programme
  • a programme that calculated each woman’s risk before screening began. Only those deemed to be a ‘higher risk’ of breast cancer were screened.

The researchers gave each woman a risk score based on their genes as well as their lifestyles. They then tried to predict what might happen if woman at different risks of breast cancer were screened.

Once the numbers were crunched, the team looked for a ‘sweet spot’ – the scenario that gave the best balance of benefits to harms. They found that not screening around a third of women with the lowest risk of breast cancer was that ‘sweet spot’.

Not offering screening to these women could save the NHS money compared to the current screening programme. And there could be 27% fewer overdiagnosed cancers. In this hypothetical situation, screening still saved lives from breast cancer. But the trade-off for less overdiagnosis was that there were 3% more breast cancer deaths.

A long way to go

Factoring risk into breast screening could help to minimise the harms, while maintaining benefits and making screening more cost-effective. But it’s early days and there’s a lot we still don’t know.

Because researchers were modelling a hypothetical situation, they had to make a fair few assumptions. Studies like this are an excellent kicking off point when it comes to improving screening, but the results are merely predictions, and should be taken with a pinch of salt.

The big challenge is how to accurately identify women with a lower risk of breast cancer who might benefit from fewer breast screens in the real world.

Dr Nora Pashayan, lead author from University College London says that there are over 300 gene variants that increase a woman’s risk of breast cancer, so it may be feasible to create a more targeted screening programme in the future.

“However, we recognise implementing an initiative of this nature raises challenges – not least defining those women deemed low risk and making any screening based on risk acceptable to the public, health professionals and regulators.”

For now, its important women who are offered breast screening understand both the benefits and harms when deciding if they want to take up the offer.

Katie 

Reference

Pashayan N, et al. (2018) Cost-effectiveness and Benefit-to-Harm Ratio of Risk-Stratified Screening for Breast Cancer. JAMA Oncologydoi:10.1001/jamaoncol.2018.1901


from Cancer Research UK – Science blog https://ift.tt/2lZeWjy

Declare energy independence with carbon dividends

Taking action on climate is about a lot more than our energy economy. Climate disruption is the leading threat to our built environment, an accelerant of armed conflict, and a leading cause of mass migration. Its effects intensify and prolong storms, droughts, wildfires, and floods — resulting in the US spending as much on disaster management in 2017 as in the three decades from 1980 to 2010.

fire

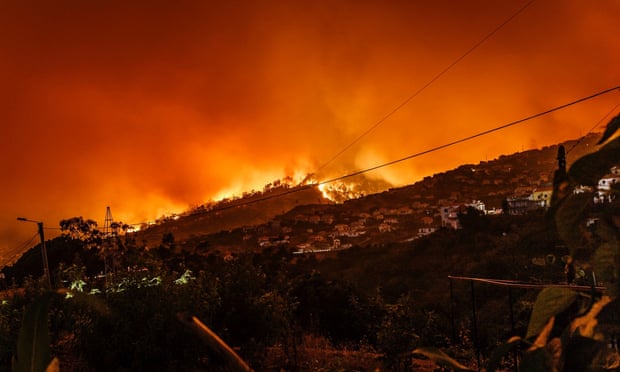
 Out of control wildfire approaching Estreito da Calheta, Portugal. September 2017. Photograph: Michael Held

Fiscal conservatism and national security require a smart, focused, effective solution that protects our economy and our values.

Political division between the major parties in Washington has left the burden of achieving that solution largely on Democratic administrations using regulatory measures that — for all their smart design and ambition — cannot be transformational enough to carry us through to a livable future.

Conservatives say the nation needs an insurance policy. Business leaders want to future-proof their operations and investments. Young people are demanding intervention on the scale of the Allies’ efforts to rebuild Europe after World War II. 

The International Monetary Fund — whose mission is to ensure national dysfunction doesn’t undermine the solvency of public budgets and lead to failed states — warns that nations that depend heavily on publicly subsidized fossil fuels are endangering their future solvency by investing in a way that destroys future economic resilience. Resilience intelligence requires diversification and innovation on a massive scale. 

The rapid expansion of green bonds is making clear the deep need for clean economy holdings among major banks and institutional investors. Climate-smart finance, still a new concept, is expected to be the standard for both public and private-sector actors at all levels within 10 to 20 years. 

Republican former Secretaries of the Treasury James Baker and George Shultz have called for a carbon dividends strategy, because: 

  1. it avoids new regulation,
  2. it abides by conservative principles of market efficiency, and
  3. it leverages improvements to the Main Street economy to ensure a future of real energy freedom.
main street

 Main Street economies suffer when too much of the money in circulation flows to finance, without clear incentives to lend to small businesses. The steadily rising monthly carbon dividend makes sure more of the money in circulation flows through small businesses, locking in that incentive and making the whole economy more efficient at creating wealth for the average household. Photograph: Joseph Robertson

Unpaid-for pollution and climate disruption limit our personal freedom and then, by adding cost and risk to the whole economy, undermine our collective ability to defend our freedom and secure future prosperity. Even with record oil and gas production, the US still depends heavily on foreign regimes hostile to democracy that manipulate supply and undermine the efficiency of our everyday economy. 

Energy freedom means reliable, everywhere-active low-cost clean energy, answering the call of expanded Main Street economic activity.

REMI

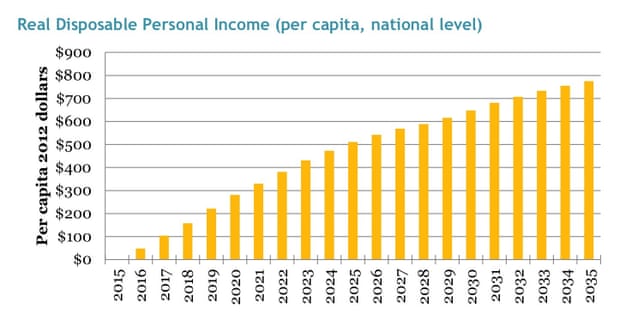
 A study by Regional Economic Models, Inc., which modeled the interacting economy-wide impacts of monthly household carbon dividends found real disposable personal income rising for at least 20 years after the first dividends show up in the mail. Details at https://ift.tt/2lUxIs1 Illustration: Regional Economic Models, Inc.

Ask any small business owner if they would rather have higher or lower hidden business costs built into everything they buy from their suppliers. Of course, they would prefer lower hidden costs and risks, and for consumers to have more money in their pockets. 

That is how carbon dividends work. 

  • A simple, upstream fee, paid at the source by any entity that wants to sell polluting fuels that carry such hidden costs and risk. This is administratively simple, light-touch, economy-wide, and fair to all. 
  • 100% of the revenues from that fee are returned to households in equal shares, every month. This ensures the Main Street economy keeps humming along. 
  • Because both the fee and the dividend steadily rise, pollution-dependent businesses — and the banks that finance them — can see the optimal rate of innovation and diversification to liberate themselves from the subsidized pollution trap. The whole economy becomes more competitive and more efficient at delivering real-world value to Main Street. 
  • To ensure energy intensive trade-exposed industries are not drawn away by other nations keeping carbon fuels artificially cheap, a simple border carbon adjustment ensures a level playing field, while adding negotiating power to US diplomatic efforts, on every issue everywhere.

Click here to read the rest


from Skeptical Science https://ift.tt/2zdfBat

Future projections of Antarctic ice shelf melting

This is a re-post from ClimateSight

Climate change will increase ice shelf melt rates around Antarctica. That’s the not-very-surprising conclusion of my latest modelling study, done in collaboration with both Australian and German researchers, which was just published in Journal of Climate. Here’s the less intuitive result: much of the projected increase in melt rates is actually linked to a decrease in sea ice formation.

That’s a lot of different kinds of ice, so let’s back up a bit. Sea ice is just frozen seawater. But ice shelves (as well as ice sheets and icebergs) are originally formed of snow. Snow falls on the Antarctic continent, and over many years compacts into a system of interconnected glaciers that we call an ice sheet. These glaciers flow downhill towards the coast. If they hit the coast and keep going, floating on the ocean surface, the floating bits are called ice shelves. Sometimes the edges of ice shelves will break off and form icebergs, but they don’t really come into this story.

Climate models don’t typically include ice sheets, or ice shelves, or icebergs. This is one reason why projections of sea level rise are so uncertain. But some standalone ocean models do include ice shelves. At least, they include the little pockets of ocean beneath the ice shelves – we call them ice shelf cavities – and can simulate the melting and refreezing that happens on the ice shelf base.

We took one of these ocean/ice-shelf models and forced it with the atmospheric output of regular climate models, which periodically make projections of climate change from now until the end of the century. We completed four different simulations, consisting of two different greenhouse gas emissions scenarios (“Representative Concentration Pathways” or RCPs) and two different choices of climate model (“ACCESS 1.0”, or “MMM” for the multi-model mean). Each simulation required 896 processors on the supercomputer in Canberra. By comparison, your laptop or desktop computer probably has about 4 processors. These are pretty sizable models!

In every simulation, and in every region of Antarctica, ice shelf melting increased over the 21st century. The total increase ranged from 41% to 129% depending on the scenario. The largest increases occurred in the Amundsen Sea region, marked with red circles in the maps below, which happens to be the region exhibiting the most severe melting in recent observations. In the most extreme scenario, ice shelf melting in this region nearly quadrupled.

Percent change in ice shelf melting, caused by the ocean, during the four future projections. The values are shown for all of Antarctica (written on the centre of the continent) as well as split up into eight sectors (colour-coded, written inside the circles). Figure 3 of Naughten et al., 2018, © American Meteorological Society.

So what processes were causing this melting? This is where the sea ice comes in. When sea ice forms, it spits out most of the salt from the seawater (brine rejection), leaving the remaining water saltier than before. Salty water is denser than fresh water, so it sinks. This drives a lot of vertical mixing, and the heat from warmer, deeper water is lost to the atmosphere. The ocean surrounding Antarctica is unusual in that the deep water is generally warmer than the surface water. We call this warm, deep water Circumpolar Deep Water, and it’s currently the biggest threat to the Antarctic Ice Sheet. (I say “warm” – it’s only about 1°C, so you wouldn’t want to go swimming in it, but it’s plenty warm enough to melt ice.)

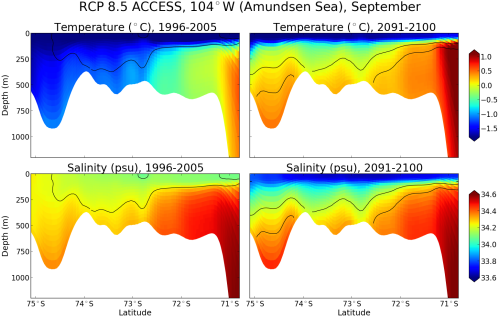
In our simulations, warming winters caused a decrease in sea ice formation. So there was less brine rejection, causing fresher surface waters, causing less vertical mixing, and the warmth of Circumpolar Deep Water was no longer lost to the atmosphere. As a result, ocean temperatures near the bottom of the Amundsen Sea increased. This better-preserved Circumpolar Deep Water found its way into ice shelf cavities, causing large increases in melting.

Slices through the Amundsen Sea – you’re looking at the ocean sideways, like a slice of birthday cake, so you can see the vertical structure. Temperature is shown on the top row (blue is cold, red is warm); salinity is shown on the bottom row (blue is fresh, red is salty). Conditions at the beginning of the simulation are shown in the left 2 panels, and conditions at the end of the simulation are shown in the right 2 panels. At the beginning of the simulation, notice how the warm, salty Circumpolar Deep Water rises onto the continental shelf from the north (right side of each panel), but it gets cooler and fresher as it travels south (towards the left) due to vertical mixing. At the end of the simulation, the surface water has freshened and the vertical mixing has weakened, so the warmth of the Circumpolar Deep Water is preserved. Figure 8 of Naughten et al., 2018, © American Meteorological Society.

This link between weakened sea ice formation and increased ice shelf melting has troubling implications for sea level rise. Unfortunately, models like the one we used for this study can’t actually be used to simulate sea level rise, as they have to assume that ice shelf geometry stays constant. No matter how much ice shelf melting the model simulates, the ice shelves aren’t allowed to thin or collapse. Basically, this design assumes that any ocean-driven melting is exactly compensated by the flow of the upstream glacier such that ice shelf geometry remains constant.

Of course this is not a good assumption, because we’re observing ice shelves thinning all over the place, and a few have even collapsed. But removing this assumption would necessitate coupling with an ice sheet model, which presents major engineering challenges. We’re working on it – at least ten different research groups around the world – and over the next few years, fully coupled ice-sheet/ocean models should be ready to use for the most reliable sea level rise projections yet.


from Skeptical Science https://ift.tt/2lZDUPr

Republicans try to save their deteriorating party with another push for a carbon tax


The Republican Party is rotting away
. The problem is that GOP policies just aren’t popular. Most Americans unsurprisingly oppose climate denial, tax cuts for the wealthy, and putting children (including toddlers) in concentration camps, for example.

The Republican Party has thus far managed to continue winning elections by creating “a coalition between racists and plutocrats,” as Paul Krugman put it. The party’s economic policies are aimed at benefitting wealthy individuals and corporations, but that’s a slim segment of the American electorate. The plutocrats can fund political campaigns, but to capture enough votes to win elections, the GOP has resorted to identity politics. Research has consistently shown that Trump won because of racial resentment among white voters.

While that strategy has worked in the short-term, some Republicans recognize that it can’t work in the long-term, and they’re fighting to save their party from extinction.

Can a carbon tax save the GOP?

Climate change is one of many issues that divides the Republican Party. Like racial resentment, climate denial is a position held mostly by old, white, male conservatives. There’s a climate change generational, ethnic, and gender gap. 61% of Republicans under the age of 50 support government climate policies, compared to just 44% of Republicans over 50. Similarly, a majority of Hispanic- and African-Americans accept human-caused global warming and 70% express concern about it, as compared to just 41% of whites who accept the scientific reality and 50% who worry about it.

But the plutocratic wing of the GOP loves fossil fuels. Republican politicians rely on campaign donations from the fossil fuel industry, and quid pro quo requires them to do the industry’s bidding. It might as well be called the Grand Oil Party.

There is no other reason why the GOP should not unify behind a revenue-neutral carbon tax. This free market, small government climate policy – which taxes carbon pollution and returns all the revenue to American households – is indeed supported by many conservatives. A group of Republican elder statesmen created a coalition called the Climate Leadership Council to build conservative support for a revenue-neutral carbon tax. They’re now backed by Americans for Carbon Dividends (AfCD), led in part by former Republican Senate Majority Leader Trent Lott with a renewed effort to build support for this policy.

AfCD recently released polling results showing that 55% of Americans believe US environmental policy is headed in the wrong direction (29% say it’s on the right track), 81% of likely voters including 58% of Strong Republicans agree the government should take action to limit carbon emissions, and by a 56% to 26% margin (including a 55% to 32% margin among Strong Republicans), Americans support a revenue-neutral carbon tax.

It’s not a wildly popular policy proposal, but it does have broad bipartisan support. It’s also a smart way to curb climate change with minimal economic impact, and in fact with a massive net economic benefit compared to unchecked climate change. That’s why economists overwhelmingly support a carbon tax.

The GOP was on the wrong side of history on civil rights and gay marriage and has paid the price, having largely become the party of old, straight, white men. Climate change is a similarly critical historical issue, but one that will directly impact every single American. Some smart Republicans recognize that the party can’t afford to be on the wrong side of history again on this issue.

Racial politics slapped a band-aid on the GOP’s gaping wound

Donald Trump managed to win the presidency in 2016 by stoking racial resentment among white Americans, but still lost the popular vote by a margin of nearly 3 million, and Republicans have only won the presidential popular vote once in the past two decades. They’re winning elections by relying on structural advantages (gerrymandering and weighting of rural votes), voter suppression, and mobilizing older white voters.

Trump seems to be doubling down on the latter strategy ahead of the 2018 midterm elections, for example by claiming that illegal immigrants are “infesting” America and by putting immigrant children in concentration camps. While only 25% of Americans support separating immigrant children from their parents, 49% of Republicans favor the policy. It’s a recipe for turning out the racist base (who also tend to be climate deniers), but not for winning a general election. Especially over the long-term as America becomes less white and as younger, more tolerant Americans become a larger proportion of the electorate.

When asked about the child concentration camps at a press conference, Senator David Perdue (R-GA) made the connection between the GOP coalition of plutocrats and racists, telling reporters:

Click here to read the rest


from Skeptical Science https://ift.tt/2zd9NNV

First contact

Salma Fahmy, team member on the Solar Orbiter Project Office at ESTEC Credit: ESA/D. Lakey

Salma Fahmy, team member on the Solar Orbiter Project Office at ESTEC Credit: ESA/D. Lakey

ESA’s Solar Orbiter team have been busy for the last few months preparing for the first ‘Spacecraft Validation Test’ – referred to in engineering-speak as ‘SVT-0’ – which is the first opportunity the mission control team to establish a data link to the actual flight hardware and send commands to the spacecraft.

The mission controllers are working at ESA’s ESOC control centre in Darmstadt this week, joined by representatives from the mission’s two instrument teams, the ESA Project Team based at ESTEC in the Netherlands and the AirbusDS-UK industrial team. The spacecraft itself is located in Stevenage, UK.

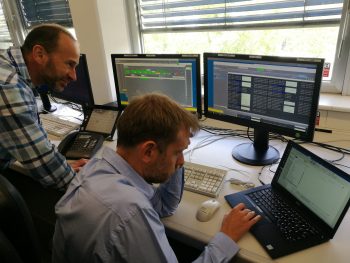
Jose-Luis Pellon-Bailon & Matthias Eiblmaier Credit: ESA/D. Lakey

Jose-Luis Pellon-Bailon & Matthias Eiblmaier Credit: ESA/D. Lakey

Yesterday and today, the team will validate flight control procedures and the database that describes the commands and telemetry of the spacecraft. It’s a lot of work but at the end of it, a real milestone will have been passed.

Spacecraft Operations Engineer Daniel Lakey explains, “This is the culmination of months of work by us, our colleagues across ESA and, of course, the teams at AirbusDS-UK, who are leading the build of the spacecraft and are supporting these test connections from the cleanroom in Stevenage.”

“We have a list of over 250 procedures that we will methodically go through, to ensure they are ready for flight. This first contact with the real spacecraft is an exciting step after having spent years working on paper!”

More tests are planned over the coming months, and next year.

#Solo

#ESOC


from Rocket Science https://ift.tt/2NrqlVJ
v
Salma Fahmy, team member on the Solar Orbiter Project Office at ESTEC Credit: ESA/D. Lakey

Salma Fahmy, team member on the Solar Orbiter Project Office at ESTEC Credit: ESA/D. Lakey

ESA’s Solar Orbiter team have been busy for the last few months preparing for the first ‘Spacecraft Validation Test’ – referred to in engineering-speak as ‘SVT-0’ – which is the first opportunity the mission control team to establish a data link to the actual flight hardware and send commands to the spacecraft.

The mission controllers are working at ESA’s ESOC control centre in Darmstadt this week, joined by representatives from the mission’s two instrument teams, the ESA Project Team based at ESTEC in the Netherlands and the AirbusDS-UK industrial team. The spacecraft itself is located in Stevenage, UK.

Jose-Luis Pellon-Bailon & Matthias Eiblmaier Credit: ESA/D. Lakey

Jose-Luis Pellon-Bailon & Matthias Eiblmaier Credit: ESA/D. Lakey

Yesterday and today, the team will validate flight control procedures and the database that describes the commands and telemetry of the spacecraft. It’s a lot of work but at the end of it, a real milestone will have been passed.

Spacecraft Operations Engineer Daniel Lakey explains, “This is the culmination of months of work by us, our colleagues across ESA and, of course, the teams at AirbusDS-UK, who are leading the build of the spacecraft and are supporting these test connections from the cleanroom in Stevenage.”

“We have a list of over 250 procedures that we will methodically go through, to ensure they are ready for flight. This first contact with the real spacecraft is an exciting step after having spent years working on paper!”

More tests are planned over the coming months, and next year.

#Solo

#ESOC


from Rocket Science https://ift.tt/2NrqlVJ
v

A grave tale: The case of the corpse-eating flies


Dozens of ceramic vessels from West Mexico, part of the collection of Emory's Michael C. Carlos Museum, were believed to be "grave goods," traditionally placed near bodies in underground burial chambers almost 1,500 years before the Aztecs. The compact figures depict humans and animals engaged in everyday activities, vividly capturing a place and time. Residue and wear patterns suggested that the vessels had once been filled with food and drink, perhaps to accompany the departed along their journey.

But were the figures authentic?

Seeking answers, the museum invited forensic anthropologist Robert Pickering — who uses entomology, among other techniques – to examine the vessels with the help of Emory scholars.

His quest? Locate telltale insect casings likely left by coffin flies, corpse-eating insects that fed on decomposing bodies interred in the ancient underground shaft tombs of Western Mexico.

"Not to be impolite, but where you have dead people, you have bugs," Pickering explains.

Read more about the project here.

from eScienceCommons https://ift.tt/2KFnoCp