This update was written by Eleni Ravanis, an ESA Young Graduate Trainee working on the Mars Express Visual Monitoring Camera.
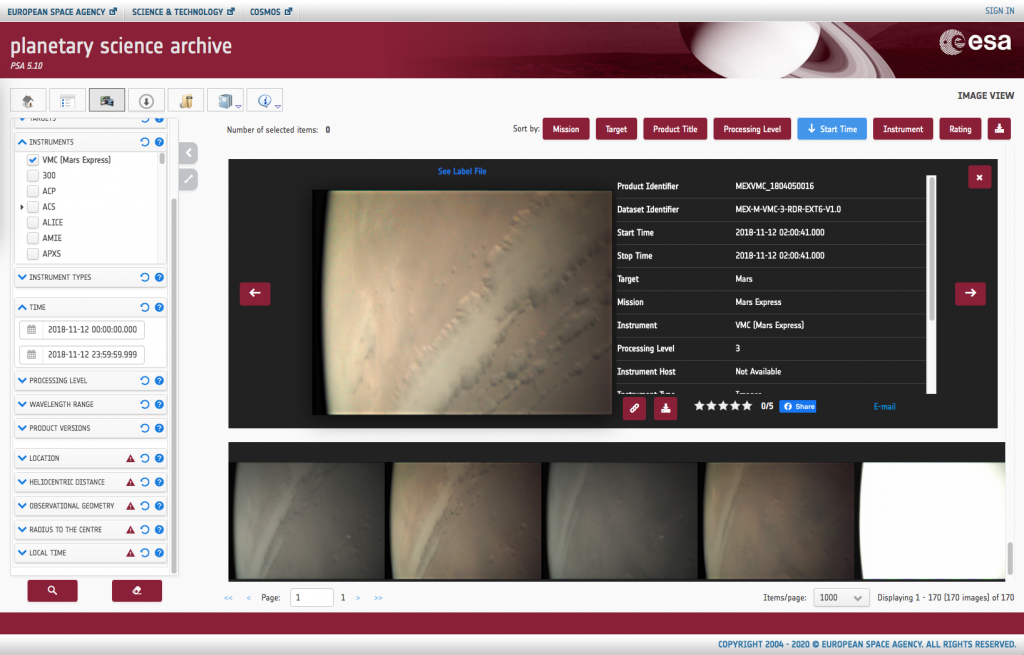
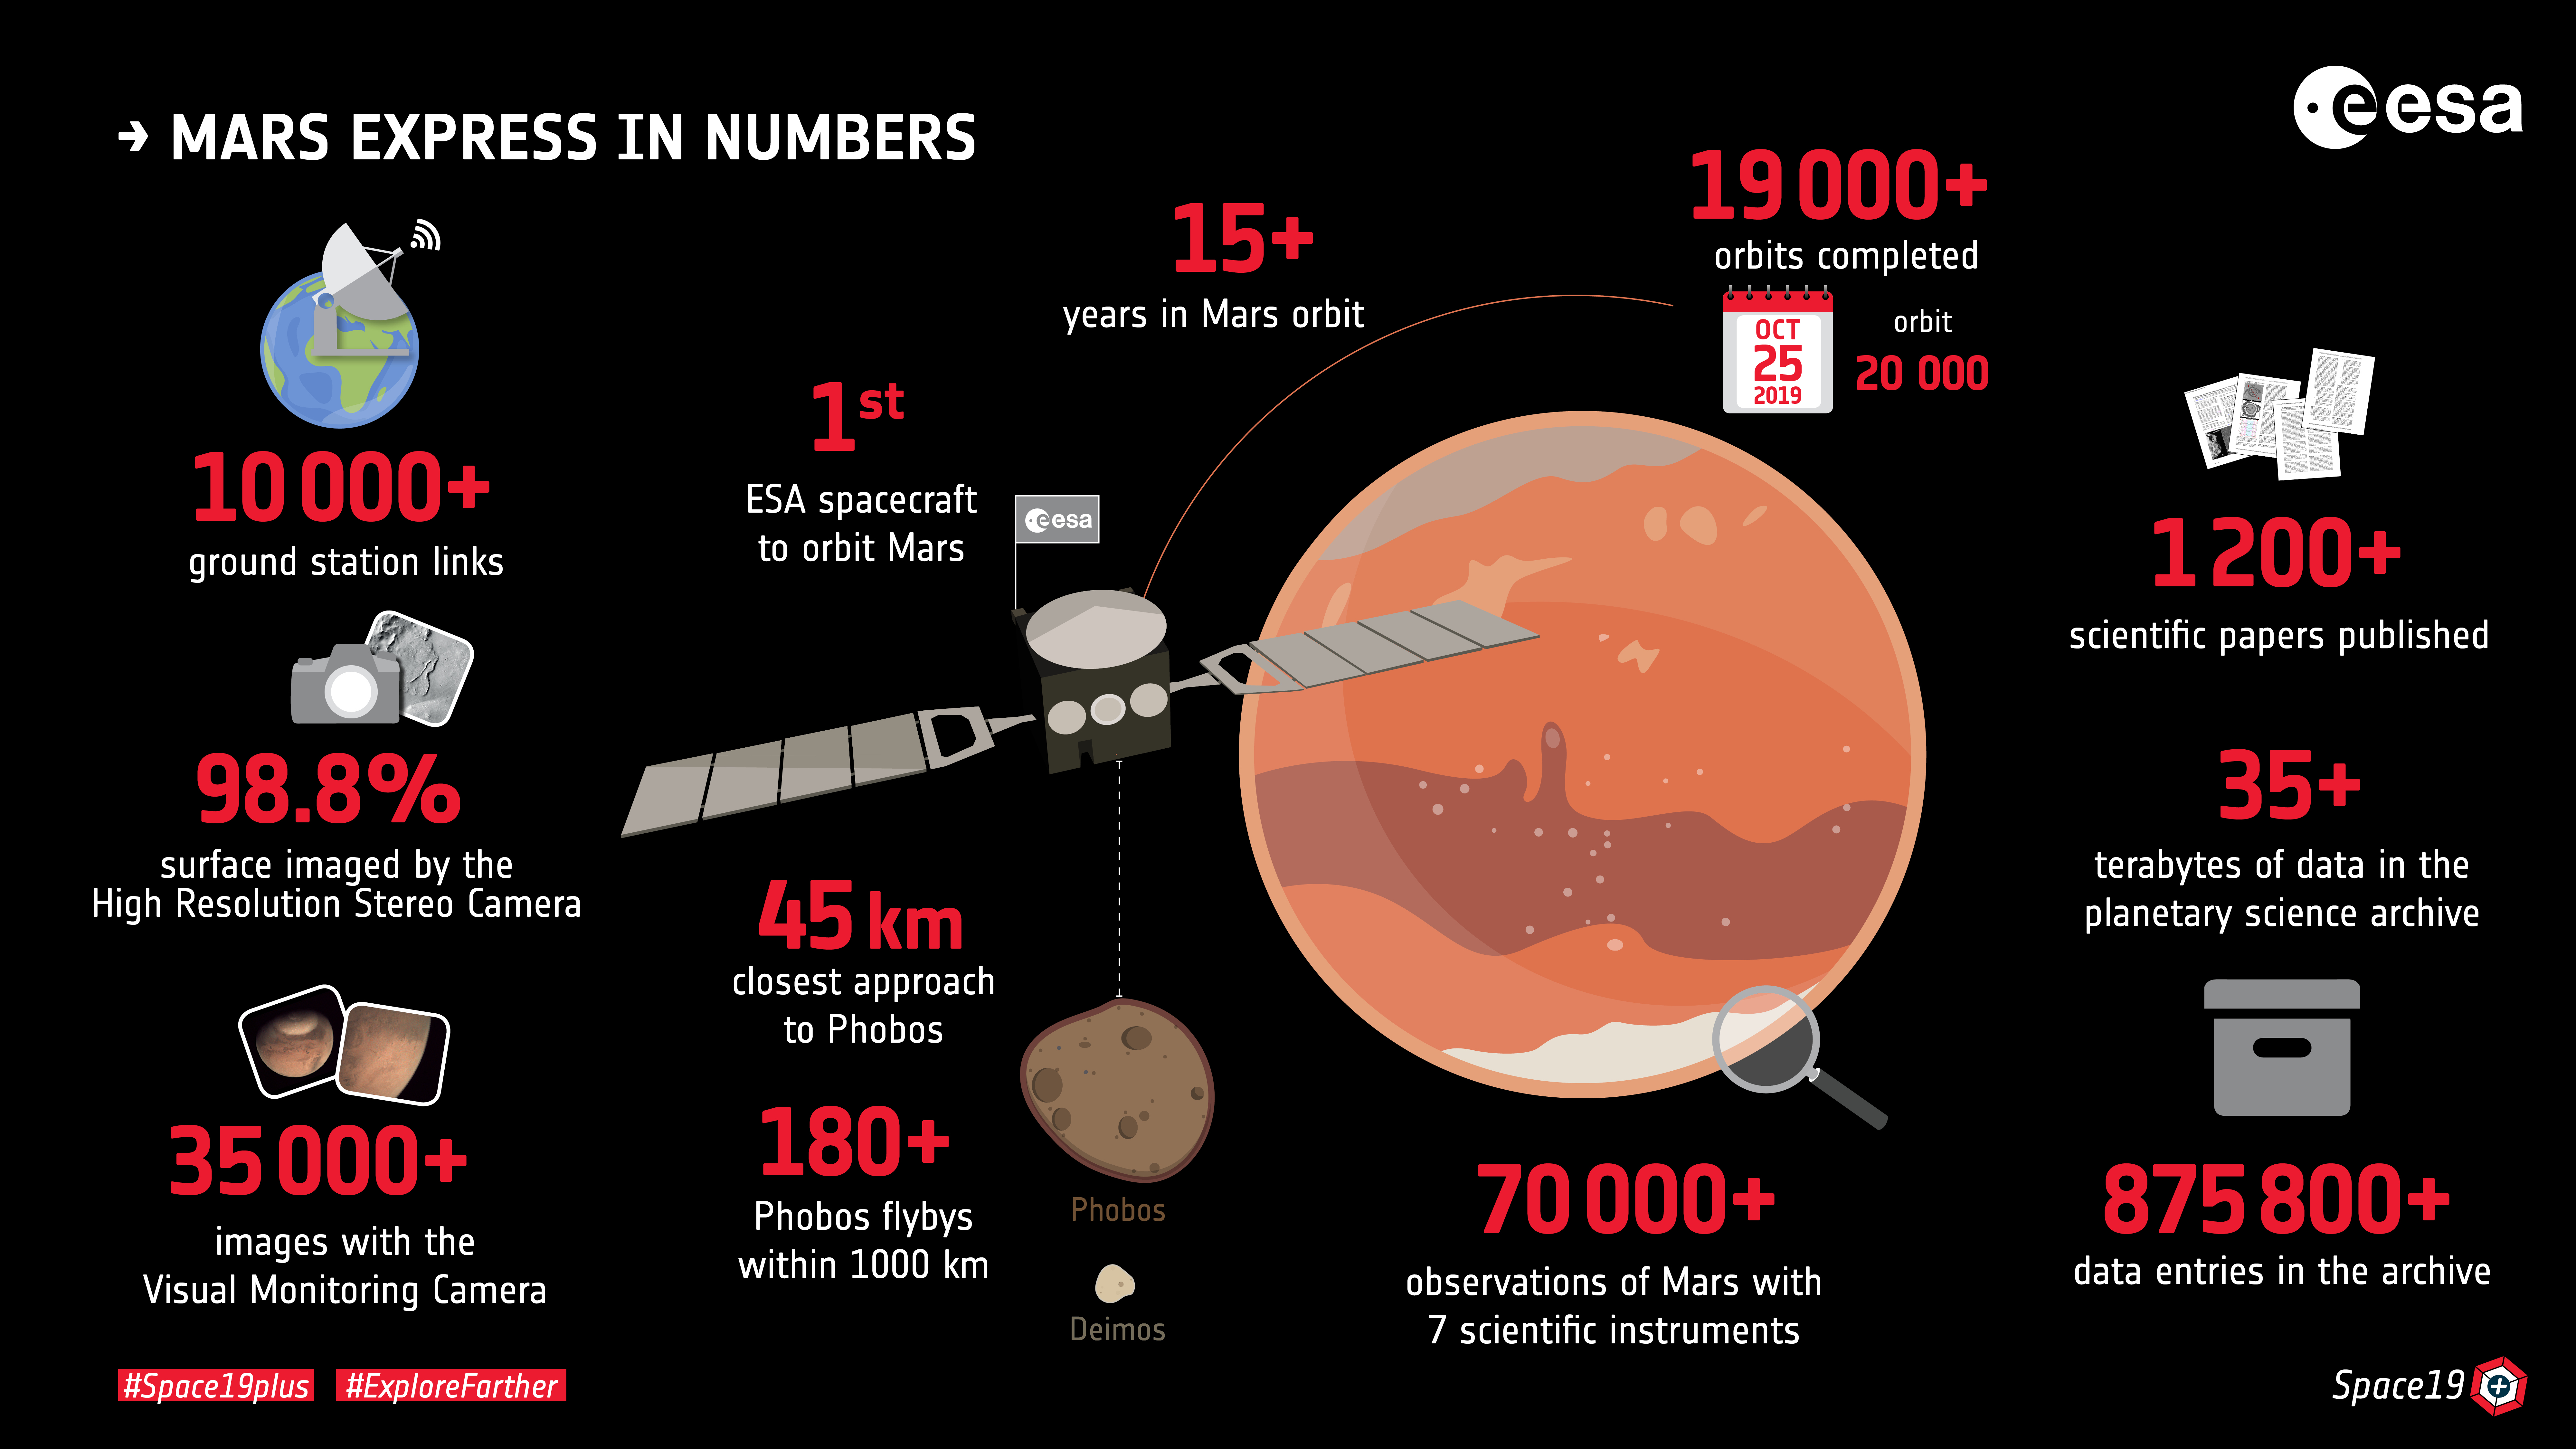
It’s official – data from the Visual Monitoring Camera (VMC) instrument onboard our Mars Express mission is now in the Planetary Science Archives (PSA)! The data comes from observations taken of the Red Planet between 2007 to mid-2020, as well as observations of the release of the Beagle 2 lander in 2003, calibrated for scientific use.
The PSA
The Planetary Science Archive (PSA) is the central repository for all scientific data returned by ESA’s Solar System missions. Originally, the VMC was an engineering instrument (you can read more about the history of VMC here).
Previously, VMC data was only available via a Flickr page, but the dataset released today is the first ‘science data’ release for the instrument, and is the culmination of several years of hard work by the VMC team!
What’s new?
How is the data on the PSA different to that already on Flickr? The newly released data is processed using a new ‘processing pipeline’ developed by the VMC team, which includes colleagues from the UPV-EHU Planetary Sciences Group in Bilbao. This data is now calibrated (more in the next paragraph) and is also available in different formats: raw data is available as RAW and PNGs, and calibrated data is available in FITS and PNG format.
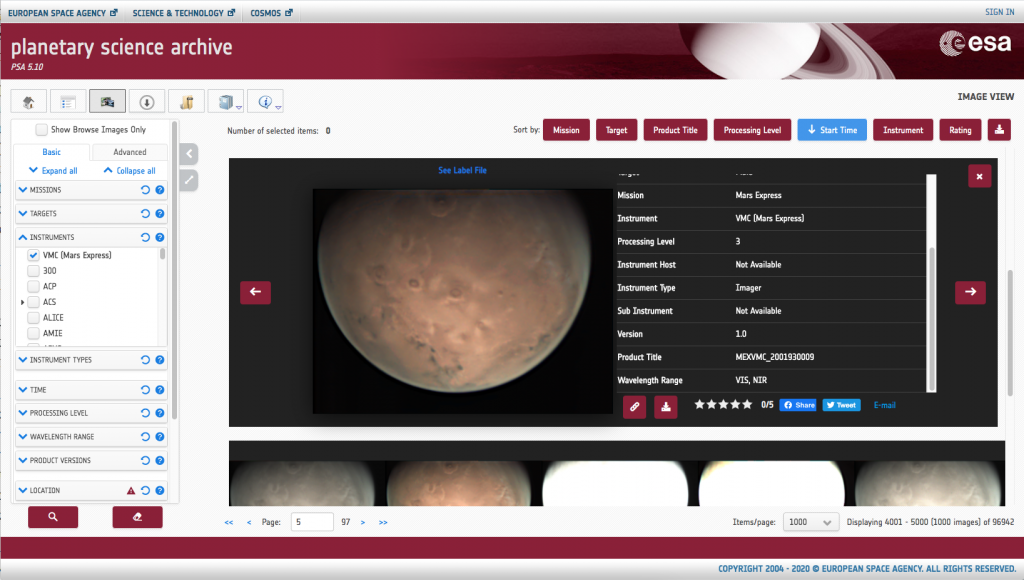
The dataset release also has labels associated with each individual VMC image that contain further metadata, such as the Martian year and solar longitude (Ls), and an indication of the image resolution. Finally, there are a number of documents which explain the instrument and processing procedure in further detail.
Calibration
No on-ground calibration exists for the VMC instrument as is the case for other science instruments, so the VMC team had to be creative in their efforts!
There are two standard image calibration techniques applied to VMC images: ‘dark-current correction’ (which accounts for noise produced by the sensor) and ‘flat-fielding’ (which accounts for variations in pixel sensitivity). Normally, images for dark current correction are taken in controlled conditions so that as little light hits the detector as possible, for example by keeping the lens cap on. A flat-field image is made by taking a picture of a uniformly-lit screen, for example amateur photographers might take a picture of a piece of white paper at a short distance from their camera. Since the VMC is already at Mars, this wasn’t possible for us! Instead, the Monitoring Camera took observations of a dark part of sky to create the dark-current image, and then took images of flat portions of Mars that were well and uniformly illuminated to create the file for flat-field correction.
If you want to know more about this calibration, check out the VMC ‘Experiment to Archive Interface Control Document’ (EAICD) which has been released with this new VMC dataset.
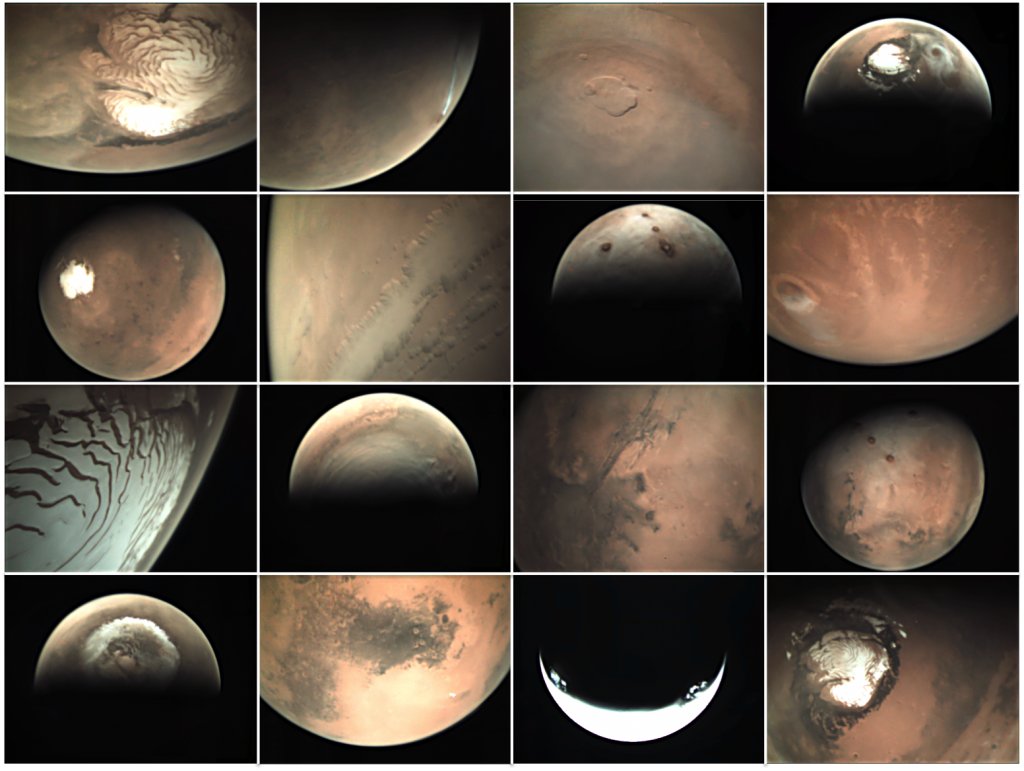
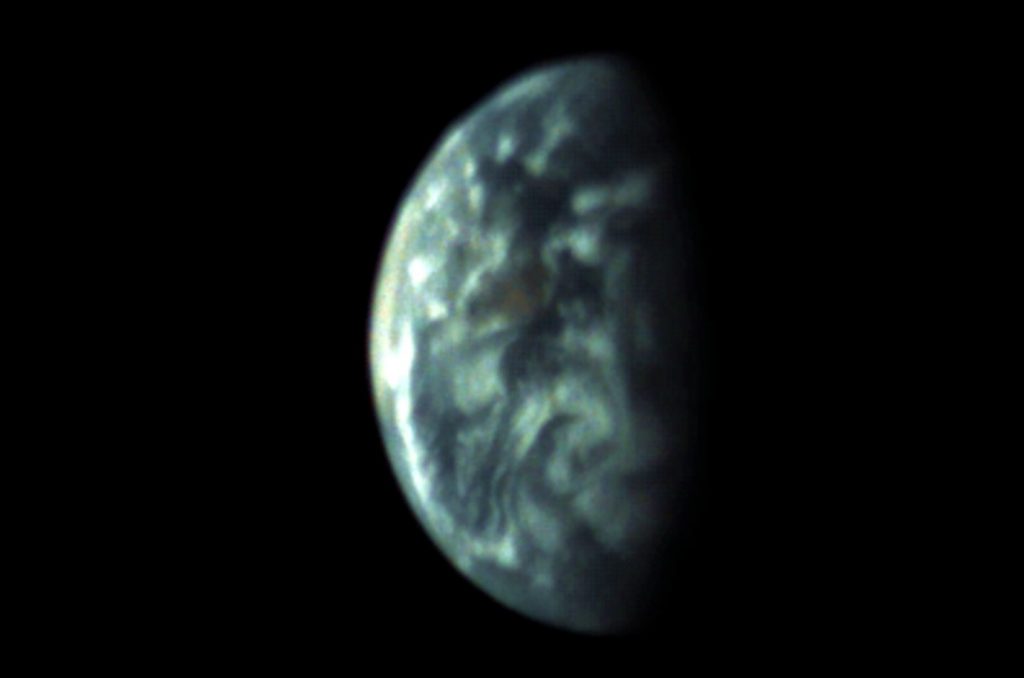
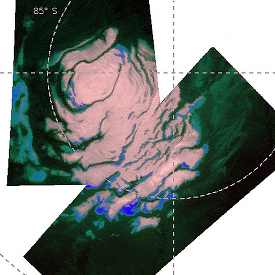
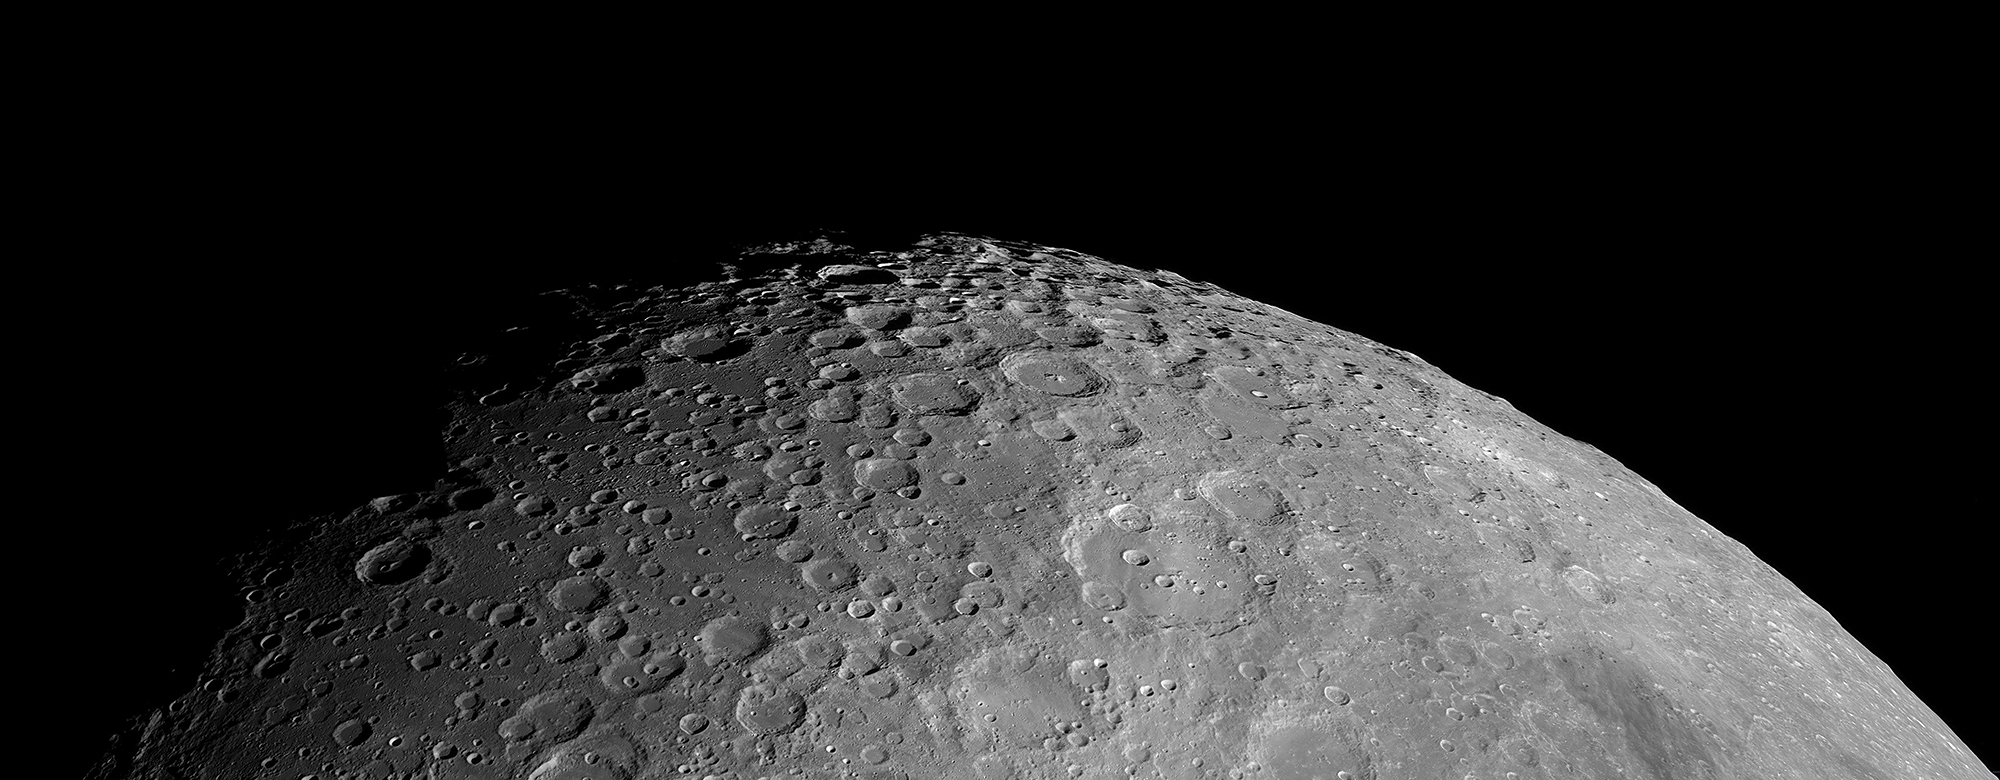
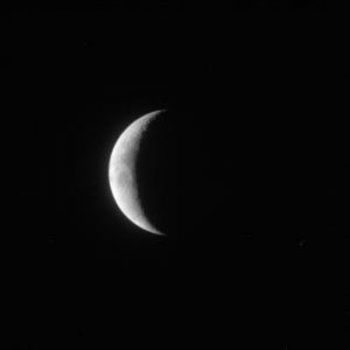
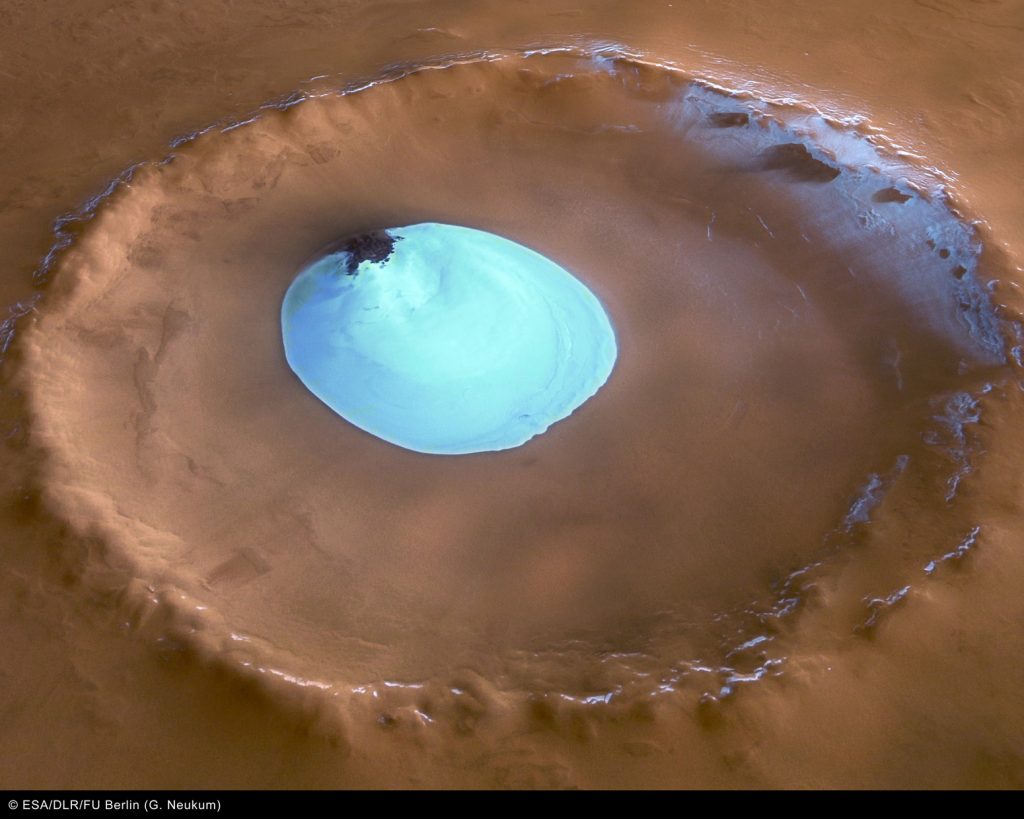
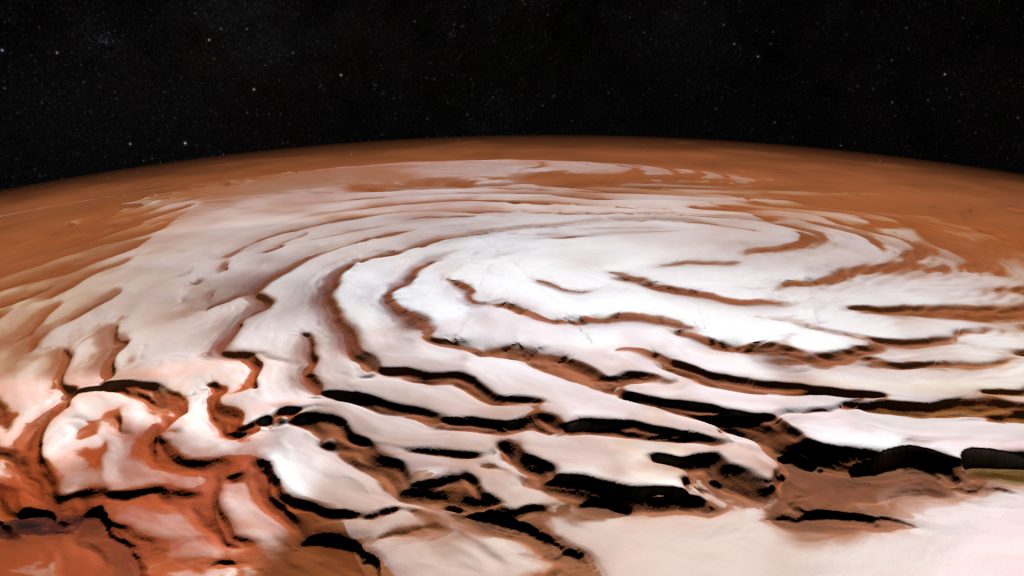
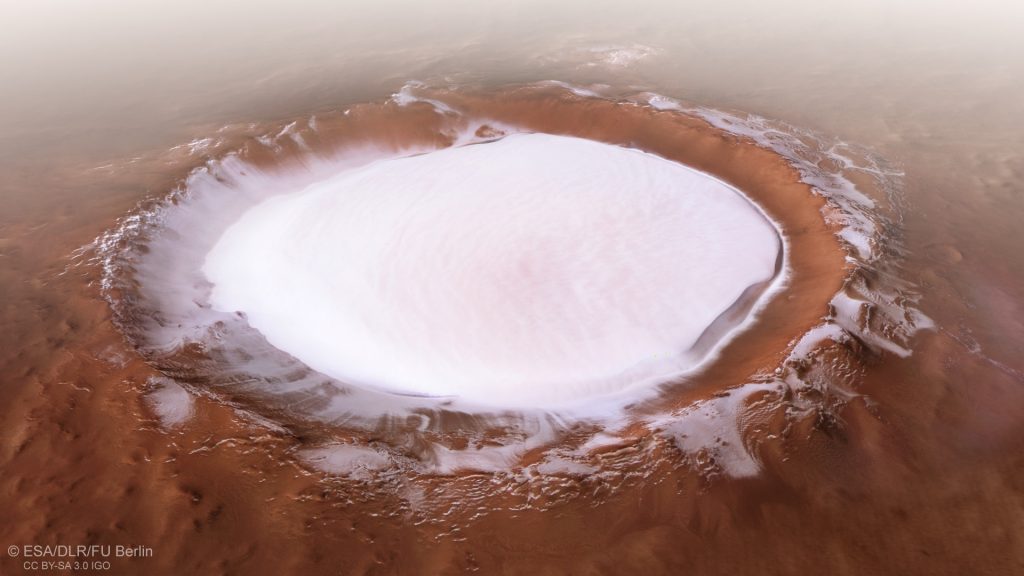
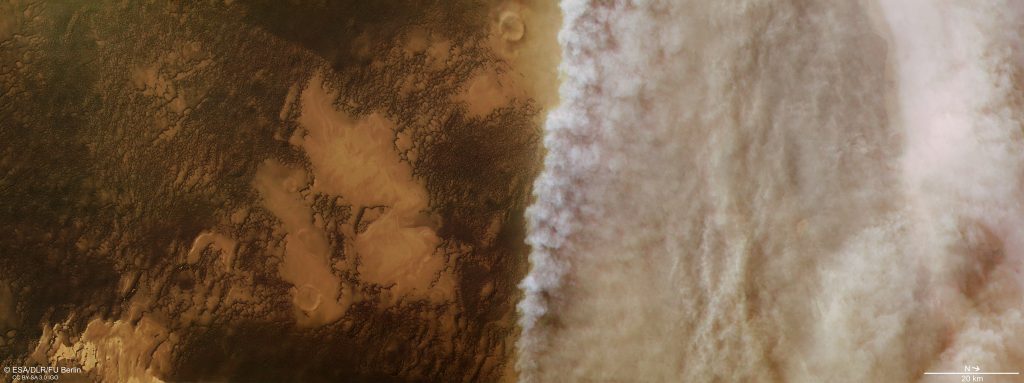
Image 1: Dust/water ice over the north pole, 4th October 2019, Image 2: The Arsia Mons Elongated Cloud (AMEC), 12th November 2008, Image 3: View of the Olympus Mons caldera,19th October 2019, Image 4: A double cyclone at the edge of the north pole, 16th June 2012, Image 5: Full disk of Mars with the south pole visible, 17th November 2016, Image 6: A close-up view of part of Valles Marineris with hazes present, 12th November 2018, Image 7: The Tharsis Volcanoes and Olympus Mons, 9th June 2010, Image 8: Cloud over Olympus Mons, 9th January 2019, Image 9: Textured patterns in the north polar cap, 1st January 2020, Image 10: Polar hoods (water ice clouds) over the north polar cap, 28th December 2010, Image 11: Valles Marineris canyon system, 1st July 2008, Image 12: Full disk of Mars with the Tharsis volcanos visible, 22nd October 2017, Image 13: Local dust storm over the north polar cap, 6th September 2016, Image 14: Syrtis Major, 9th March 2020, Image 15: Twilight clouds on Mars, 25th November 2019, Image 16: Close up of the south pole of Mars, 8th August 2010.
What can we do with the data? Science!
Why is this dataset release of interest? We’re hoping that scientists will be able to use this data to study Mars, and if you’d like to get a flavour of the work done so far, take a look at these presentations on Martian Twilight clouds and this VMC science dataset release from the recent EPSC conference. As for the general public, the backlog of images is much easier to navigate in the PSA than on Flickr. Therefore, we’re hoping this will help you peruse images of Mars to your heart’s content!
VMC images will continue to be available in Flickr, and these calibrated datasets will become available on the PSA at the same timescale as for other instruments (no earlier than 6 months after they are taken). We hope you’re as excited about seeing them as we are!
from Rocket Science https://ift.tt/31fSGqt
v
This update was written by Eleni Ravanis, an ESA Young Graduate Trainee working on the Mars Express Visual Monitoring Camera.
It’s official – data from the Visual Monitoring Camera (VMC) instrument onboard our Mars Express mission is now in the Planetary Science Archives (PSA)! The data comes from observations taken of the Red Planet between 2007 to mid-2020, as well as observations of the release of the Beagle 2 lander in 2003, calibrated for scientific use.
The PSA
The Planetary Science Archive (PSA) is the central repository for all scientific data returned by ESA’s Solar System missions. Originally, the VMC was an engineering instrument (you can read more about the history of VMC here).
Previously, VMC data was only available via a Flickr page, but the dataset released today is the first ‘science data’ release for the instrument, and is the culmination of several years of hard work by the VMC team!
What’s new?
How is the data on the PSA different to that already on Flickr? The newly released data is processed using a new ‘processing pipeline’ developed by the VMC team, which includes colleagues from the UPV-EHU Planetary Sciences Group in Bilbao. This data is now calibrated (more in the next paragraph) and is also available in different formats: raw data is available as RAW and PNGs, and calibrated data is available in FITS and PNG format.
The dataset release also has labels associated with each individual VMC image that contain further metadata, such as the Martian year and solar longitude (Ls), and an indication of the image resolution. Finally, there are a number of documents which explain the instrument and processing procedure in further detail.
Calibration
No on-ground calibration exists for the VMC instrument as is the case for other science instruments, so the VMC team had to be creative in their efforts!
There are two standard image calibration techniques applied to VMC images: ‘dark-current correction’ (which accounts for noise produced by the sensor) and ‘flat-fielding’ (which accounts for variations in pixel sensitivity). Normally, images for dark current correction are taken in controlled conditions so that as little light hits the detector as possible, for example by keeping the lens cap on. A flat-field image is made by taking a picture of a uniformly-lit screen, for example amateur photographers might take a picture of a piece of white paper at a short distance from their camera. Since the VMC is already at Mars, this wasn’t possible for us! Instead, the Monitoring Camera took observations of a dark part of sky to create the dark-current image, and then took images of flat portions of Mars that were well and uniformly illuminated to create the file for flat-field correction.
If you want to know more about this calibration, check out the VMC ‘Experiment to Archive Interface Control Document’ (EAICD) which has been released with this new VMC dataset.
Image 1: Dust/water ice over the north pole, 4th October 2019, Image 2: The Arsia Mons Elongated Cloud (AMEC), 12th November 2008, Image 3: View of the Olympus Mons caldera,19th October 2019, Image 4: A double cyclone at the edge of the north pole, 16th June 2012, Image 5: Full disk of Mars with the south pole visible, 17th November 2016, Image 6: A close-up view of part of Valles Marineris with hazes present, 12th November 2018, Image 7: The Tharsis Volcanoes and Olympus Mons, 9th June 2010, Image 8: Cloud over Olympus Mons, 9th January 2019, Image 9: Textured patterns in the north polar cap, 1st January 2020, Image 10: Polar hoods (water ice clouds) over the north polar cap, 28th December 2010, Image 11: Valles Marineris canyon system, 1st July 2008, Image 12: Full disk of Mars with the Tharsis volcanos visible, 22nd October 2017, Image 13: Local dust storm over the north polar cap, 6th September 2016, Image 14: Syrtis Major, 9th March 2020, Image 15: Twilight clouds on Mars, 25th November 2019, Image 16: Close up of the south pole of Mars, 8th August 2010.
What can we do with the data? Science!
Why is this dataset release of interest? We’re hoping that scientists will be able to use this data to study Mars, and if you’d like to get a flavour of the work done so far, take a look at these presentations on Martian Twilight clouds and this VMC science dataset release from the recent EPSC conference. As for the general public, the backlog of images is much easier to navigate in the PSA than on Flickr. Therefore, we’re hoping this will help you peruse images of Mars to your heart’s content!
VMC images will continue to be available in Flickr, and these calibrated datasets will become available on the PSA at the same timescale as for other instruments (no earlier than 6 months after they are taken). We hope you’re as excited about seeing them as we are!
from Rocket Science https://ift.tt/31fSGqt
v

 :
: 
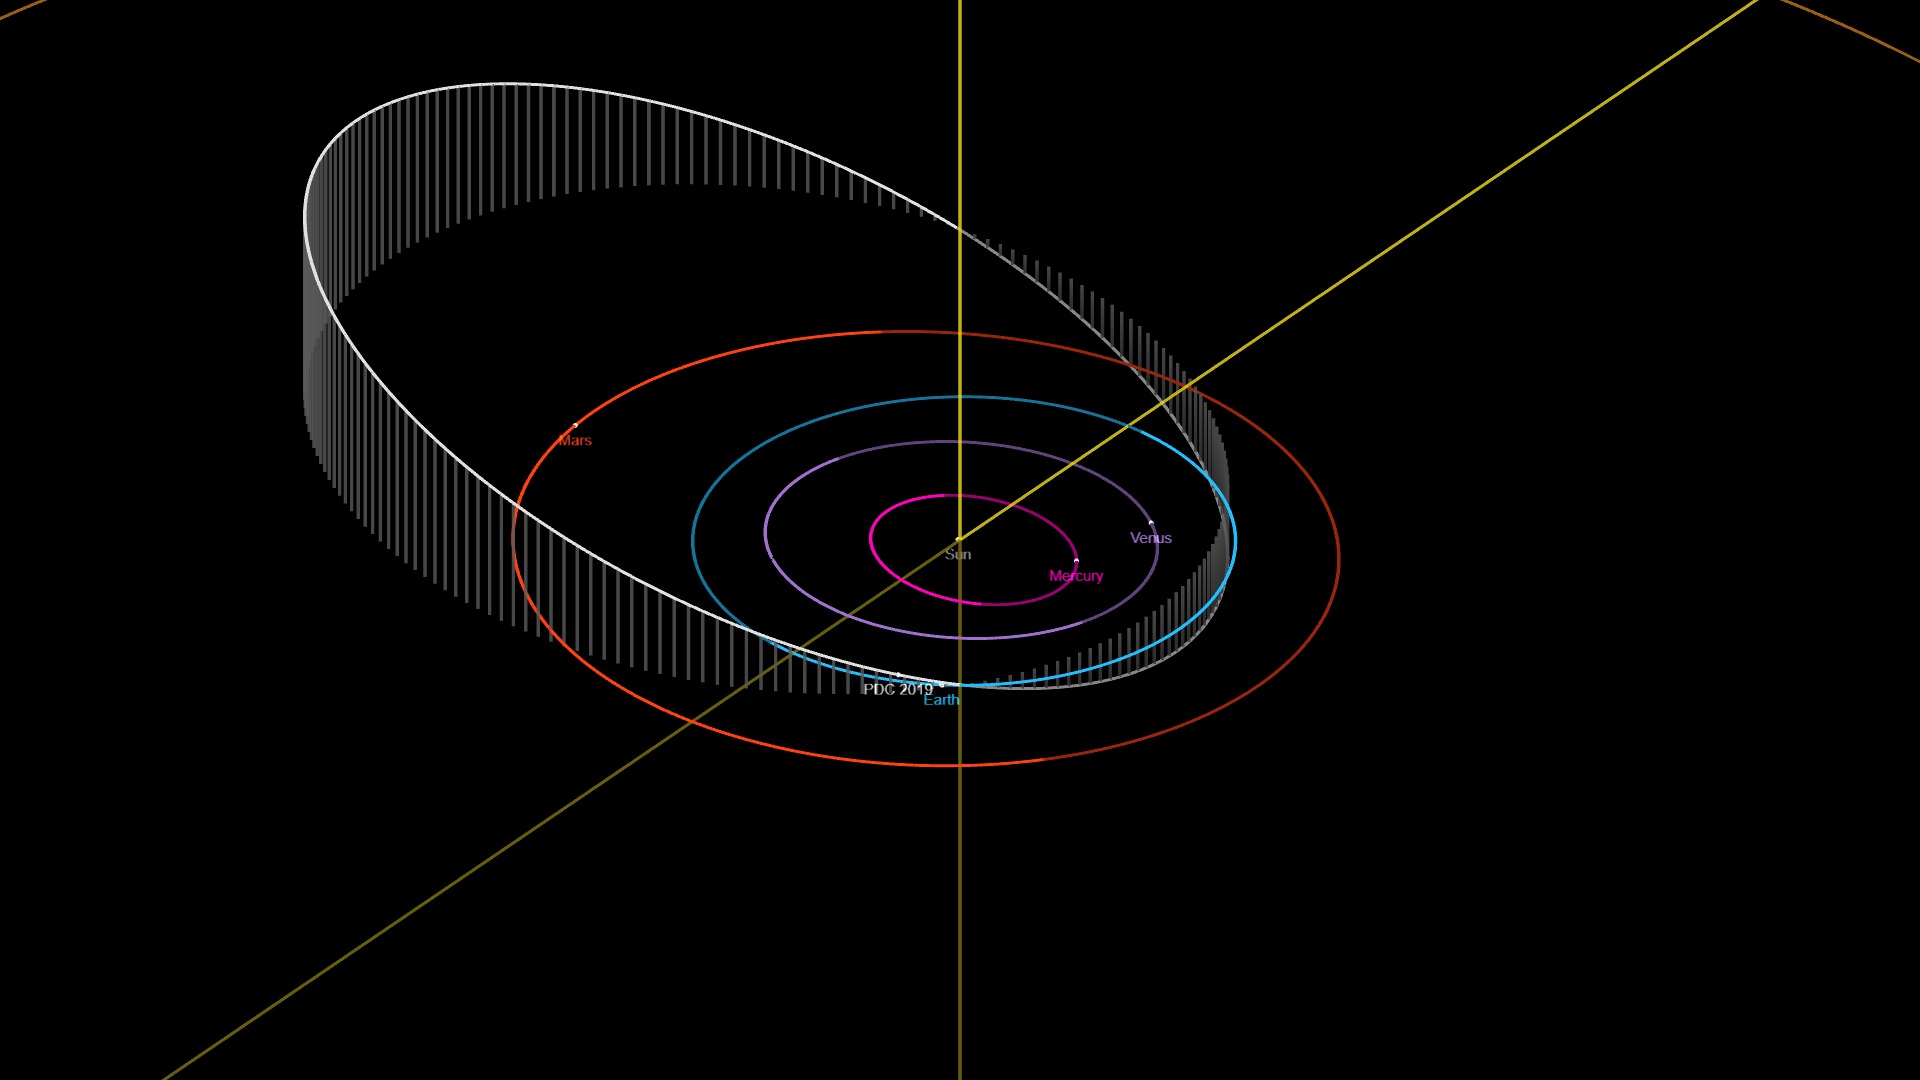
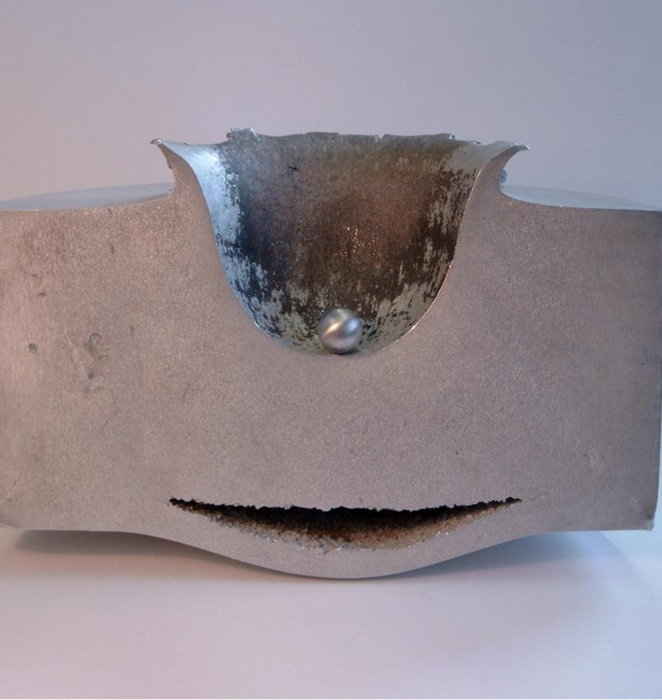
 — Very little is known about the asteroid’s physical properties. From its brightness, experts determine that the asteroid’s mean size could be anywhere from 100-300 meters.