New names for 112 exoplanets and their stars

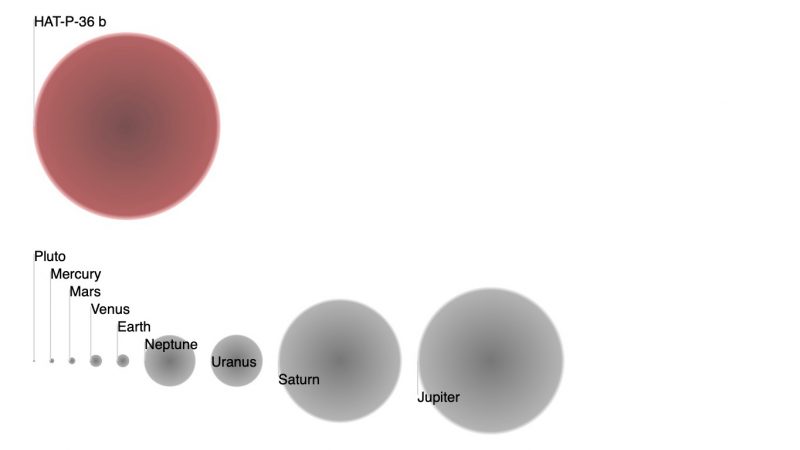
A giant exoplanet - larger than Jupiter - compared to planets in our solar system.

Simulated size of newly named exoplanet HAT-P-36b, now named Bran. Its star has a new name, too: Tuiren. Both Bran and Tuiren are names from an Irish legend. Here, you see Bran’s estimated size in comparison to planets in our own solar system. Image via Open Exoplanet Catalogue.

The International Astronomical Union (IAU) said this week it has formalized new names for 112 sets of exoplanets and their host stars. The names come from the IAU’s NameExoWorlds campaigns. They were announced at a press conference in Paris, France, on December 17, 2019. IAU said:

Within the framework of the IAU’s 100th anniversary commemorations (IAU100) in 2019, 112 countries organized national campaigns that stimulated the direct participation of over 780,000 people worldwide who proposed and selected names for each exoplanet and its host star.

The complete list of names approved by the IAU can be explored here.

Some examples of the new IAU names for exoplanets and their stars include:

Ireland: The names of mythological dogs (Bran, Tuiren) from the Irish legend The Birth of Bran, for the planet HAT-P-36b (Bran) orbiting the star HAT-P-36 (Tuiren) in the constellation of Canes Venatici the Hunting Dogs.

Jordan: The names of ancient cities and protected areas in southern Jordan, for the exoplanet WASP-80b (Wadirum) orbiting the star WASP-80 (Petra) in the constellation of Aquila the Eagle.

Malaysia: The names of gemstones in the Malay language, for the exoplanet HD 20868 b (Baiduri) orbiting the star HD 20868 (Intan) in the constellation of Fornax the Furnace.

Burkina Faso: The new names for the planet HD 30856 b (Nakambé) and its star HD 30856 (Mouhoun) refer to the local names for prominent rivers in Burkina Faso. Fittingly, the system lies in the river constellation of Eridanus the River.

Eric Mamajek is co-chair of the NameExoWorlds Steering Committee. He said in a statement:

Astronomical observations over the past generation have now discovered over 4,000 planets orbiting other stars – called exoplanets. The number of discoveries continues to double about every 2½ years, revealing remarkable new planet populations and putting our own Earth and solar system in perspective. Statistically, most of the stars in the sky are likely to be orbited by their own planets – they are everywhere.

While astronomers catalogue their new discoveries using telephone-number-like designations, there has been growing interest amongst astronomers and the public alike in also assigning proper names, as is done for solar system bodies.

Overall, 360,000 proposals for names were received by the IAU. An IAU National Committee in each country reduced their proposals to a shortlist of national candidates, which were presented to the public for their votes. A total of 420,000 people voted for their preferred candidates.

Read more: 100,000s of people from 112 countries select names for exoplanet systems in celebration of IAU’s 100th anniversary

Glowing pinking half-circle on a black background with long list of names.

View larger. | The 112 participating countries in the IAU100 NameExoWorlds campaign. Image via IAU.

Bottom line: On December 17, 2019, at a press conference in Paris, the IAU said it has formalized new names for 112 sets of exoplanets and their host stars.

EarthSky 2020 lunar calendars are available! They make great gifts. Order now. Going fast!

Wikipedia has an interesting post on exoplanet naming conventions

Via IAU


from EarthSky https://ift.tt/2r0KoDU

Why are whales big, but not bigger?

Big oblong gray shape at the surface of the water.

Minke whale. Image via Jeremy Goldbogen.

By Matthew Savoca, Stanford University; Jeremy Goldbogen, Stanford University, and Nicholas Pyenson, Smithsonian Institution

Both toothed and baleen (filter-feeding) whales are among the largest animals ever to exist. Blue whales, which measure up to 100 feet (30 meters) long and can weigh over 150 tons, are the largest animals in the history of life on Earth.

Although whales have existed on this planet for some 50 million years, they only evolved to be truly gigantic in the past five million years or so. Researchers have little idea what limits their enormous size. What is the pace of life at this scale, and what are the consequences of being so big?

As scientists who study ecology, physiology and evolution, we are interested in this question because we want to know the limits to life on Earth, and what allows these animals to live at such extremes. In a newly published study, we show that whale size is limited by the largest whales’ very efficient feeding strategies, which enable them to take in a lot of calories compared to the energy they burn while foraging.

EarthSky 2020 lunar calendars are available! They make great gifts. Order now. Going fast!

A whale on its side looks huge compared to a little orange boat.

A humpback whale approaches scientists in the Antarctic. Image via Goldbogen Laboratory, Stanford University/ Duke University Marine Robotics and Remote Sensing, taken under permit ACA/ NMFS #14809.

Ways to be a whale

The first whales on Earth had four limbs, looked something like large dogs and lived at least part of their lives on land. It took about 10 million years for their descendants to evolve a completely aquatic lifestyle, and roughly 35 million years longer for whales to become the giants of the sea.

Once whales became completely aquatic some 40 million years ago, the types that succeeded in the ocean were either baleen whales, which fed by straining seaweater through baleen filters in their mouths, or toothed whales that hunted their prey using echolocation.

As whales evolved along these two paths, a process called oceanic upwelling was intensifying in the waters around them. Upwelling occurs when strong winds running parallel to the coast push surface waters away from the shore, drawing up cold, nutrient-rich waters from the deep ocean. This stimulates plankton blooms.

Cutaway diagram of coast with waves moving outward and arrows pointing from deep part to shallower water.

Upwelling occurs when winds displace surface waters, which are replaced by cold, nutrient-rich water that wells up from below. Image via NOAA.

Stronger upwelling created the right conditions for baleen whale prey, such as krill and forage fish, to become concentrated in dense patches along coastlines. Whales that fed on these prey resources could forage efficiently and predictably, allowing them to grow larger. Fossil records showing that baleen whale lineages separately became gigantic all at the same time support this view.

Really big gulps

Is there a limit to how big whales can become? We tackled this question by drawing on animal energetics – the study of how efficiently organisms ingest prey and turn the energy it contains into body mass.

Getting large is based on simple math: If a creature can gain more calories than it spends, it gets bigger. This may seem intuitive, but demonstrating it with data collected from free-living whales was a gargantuan challenge.

To get the information, our international team of scientists attached high-resolution tags with suction cups to whales so that we could track their orientation and movement. The tags recorded hundreds of data points per second, then detached for recovery after about 10 hours.

Like a Fitbit that uses movement to record behavior, our tags measured how often whales fed below the ocean’s surface, how deep they dove and how long they remained at depth. We wanted to determine each species’ energetic efficiency – the total amount of energy that it gained from foraging, relative to the energy it expended in finding and consuming prey.

Top view of whole long gray fish-shaped whale, with inset of closeup of tag on its back.

Tagged blue whale off the coast of Big Sur, California. Image via Duke Marine Robotics & Remote Sensing under NMFS permit 16111.

Data in this study was provided by collaborators representing six countries. Their contributions represent tens of thousands of hours of fieldwork at sea collecting data on living whales from pole to pole.

In total, this meant tagging 300 toothed and baleen whales from 11 species, ranging from five-foot-long harbor porpoises to blue whales, and recording more than 50,000 feeding events. Taken together, they showed that whale gigantism is driven by the animals’ ability to increase their net energy gain using specialized foraging mechanisms.

Our key finding was that lunge-feeding baleen whales, which engulf swarms of krill or forage fish with enormous gulps, get the most bang for their buck. As these whales increase in size, they use more energy lunging – but their gulp size increases even more dramatically. This means that the larger baleen whales get, the greater their energetic efficiency becomes. We suspect the upper limit on baleen whales’ size is probably set by the extent, density and seasonal persistence of their prey.

Large toothed whales, such as sperm whales, feed on large prey occasionally including the fabled giant squid. But there are only so many giant squid in the ocean, and they are hard to find and capture. More frequently, large toothed whales feed on medium-sized squid, which are much more abundant in the deep ocean.

Because of a lack of large enough prey, we found that toothed whales’ energetic efficiency decreases with body size – the opposite of the pattern we documented for baleen whales. Therefore, we think the ecological limits imposed by a lack of giant squid prey prevented toothed whales from evolving body sizes greater than sperm whales.

Diagram of four whales to scale, two chasing prey and other two with mouths wide open.

Scaling of energetic efficiency in toothed whales and baleen whales. Image via Alex Boersma.

One piece of a larger puzzle

This work builds on previous research about the evolution of body size in whales. Many questions remain. For example, since whales developed gigantism relatively recently in their evolutionary history, could they evolve to be even larger in the future? It’s possible, although there may be other physiological or biomechanical constraints that limit their fitness.

For example, a recent study that measured blue whale heart rates demonstrated that heart rates were near their maximum even during routine foraging behavior, thereby suggesting a physiological limit. However, this was the first measurement and much more study is needed.

We would also like to know whether these size limits apply to other big animals at sea, such as sharks and rays, and how baleen whales’ consumption of immense quantities of prey affect ocean ecosystems. Conversely, as human actions alter the oceans, could they affect whales’ food supplies? Our research is a sobering reminder that relationships in nature have evolved over millions of years – but could be disrupted far more quickly in the Anthropocene.

Matthew Savoca, Postdoctoral researcher, Stanford University; Jeremy Goldbogen, Assistant Professor of Biology, Stanford University, and Nicholas Pyenson, Research Geologist and Curator of Fossil Marine Mammals, Smithsonian Institution

This article is republished from The Conversation under a Creative Commons license. Read the original article.

Bottom line: Explanation of why whales are so big, but not even bigger.

The Conversation


from EarthSky https://ift.tt/2M9wrLj
Big oblong gray shape at the surface of the water.

Minke whale. Image via Jeremy Goldbogen.

By Matthew Savoca, Stanford University; Jeremy Goldbogen, Stanford University, and Nicholas Pyenson, Smithsonian Institution

Both toothed and baleen (filter-feeding) whales are among the largest animals ever to exist. Blue whales, which measure up to 100 feet (30 meters) long and can weigh over 150 tons, are the largest animals in the history of life on Earth.

Although whales have existed on this planet for some 50 million years, they only evolved to be truly gigantic in the past five million years or so. Researchers have little idea what limits their enormous size. What is the pace of life at this scale, and what are the consequences of being so big?

As scientists who study ecology, physiology and evolution, we are interested in this question because we want to know the limits to life on Earth, and what allows these animals to live at such extremes. In a newly published study, we show that whale size is limited by the largest whales’ very efficient feeding strategies, which enable them to take in a lot of calories compared to the energy they burn while foraging.

EarthSky 2020 lunar calendars are available! They make great gifts. Order now. Going fast!

A whale on its side looks huge compared to a little orange boat.

A humpback whale approaches scientists in the Antarctic. Image via Goldbogen Laboratory, Stanford University/ Duke University Marine Robotics and Remote Sensing, taken under permit ACA/ NMFS #14809.

Ways to be a whale

The first whales on Earth had four limbs, looked something like large dogs and lived at least part of their lives on land. It took about 10 million years for their descendants to evolve a completely aquatic lifestyle, and roughly 35 million years longer for whales to become the giants of the sea.

Once whales became completely aquatic some 40 million years ago, the types that succeeded in the ocean were either baleen whales, which fed by straining seaweater through baleen filters in their mouths, or toothed whales that hunted their prey using echolocation.

As whales evolved along these two paths, a process called oceanic upwelling was intensifying in the waters around them. Upwelling occurs when strong winds running parallel to the coast push surface waters away from the shore, drawing up cold, nutrient-rich waters from the deep ocean. This stimulates plankton blooms.

Cutaway diagram of coast with waves moving outward and arrows pointing from deep part to shallower water.

Upwelling occurs when winds displace surface waters, which are replaced by cold, nutrient-rich water that wells up from below. Image via NOAA.

Stronger upwelling created the right conditions for baleen whale prey, such as krill and forage fish, to become concentrated in dense patches along coastlines. Whales that fed on these prey resources could forage efficiently and predictably, allowing them to grow larger. Fossil records showing that baleen whale lineages separately became gigantic all at the same time support this view.

Really big gulps

Is there a limit to how big whales can become? We tackled this question by drawing on animal energetics – the study of how efficiently organisms ingest prey and turn the energy it contains into body mass.

Getting large is based on simple math: If a creature can gain more calories than it spends, it gets bigger. This may seem intuitive, but demonstrating it with data collected from free-living whales was a gargantuan challenge.

To get the information, our international team of scientists attached high-resolution tags with suction cups to whales so that we could track their orientation and movement. The tags recorded hundreds of data points per second, then detached for recovery after about 10 hours.

Like a Fitbit that uses movement to record behavior, our tags measured how often whales fed below the ocean’s surface, how deep they dove and how long they remained at depth. We wanted to determine each species’ energetic efficiency – the total amount of energy that it gained from foraging, relative to the energy it expended in finding and consuming prey.

Top view of whole long gray fish-shaped whale, with inset of closeup of tag on its back.

Tagged blue whale off the coast of Big Sur, California. Image via Duke Marine Robotics & Remote Sensing under NMFS permit 16111.

Data in this study was provided by collaborators representing six countries. Their contributions represent tens of thousands of hours of fieldwork at sea collecting data on living whales from pole to pole.

In total, this meant tagging 300 toothed and baleen whales from 11 species, ranging from five-foot-long harbor porpoises to blue whales, and recording more than 50,000 feeding events. Taken together, they showed that whale gigantism is driven by the animals’ ability to increase their net energy gain using specialized foraging mechanisms.

Our key finding was that lunge-feeding baleen whales, which engulf swarms of krill or forage fish with enormous gulps, get the most bang for their buck. As these whales increase in size, they use more energy lunging – but their gulp size increases even more dramatically. This means that the larger baleen whales get, the greater their energetic efficiency becomes. We suspect the upper limit on baleen whales’ size is probably set by the extent, density and seasonal persistence of their prey.

Large toothed whales, such as sperm whales, feed on large prey occasionally including the fabled giant squid. But there are only so many giant squid in the ocean, and they are hard to find and capture. More frequently, large toothed whales feed on medium-sized squid, which are much more abundant in the deep ocean.

Because of a lack of large enough prey, we found that toothed whales’ energetic efficiency decreases with body size – the opposite of the pattern we documented for baleen whales. Therefore, we think the ecological limits imposed by a lack of giant squid prey prevented toothed whales from evolving body sizes greater than sperm whales.

Diagram of four whales to scale, two chasing prey and other two with mouths wide open.

Scaling of energetic efficiency in toothed whales and baleen whales. Image via Alex Boersma.

One piece of a larger puzzle

This work builds on previous research about the evolution of body size in whales. Many questions remain. For example, since whales developed gigantism relatively recently in their evolutionary history, could they evolve to be even larger in the future? It’s possible, although there may be other physiological or biomechanical constraints that limit their fitness.

For example, a recent study that measured blue whale heart rates demonstrated that heart rates were near their maximum even during routine foraging behavior, thereby suggesting a physiological limit. However, this was the first measurement and much more study is needed.

We would also like to know whether these size limits apply to other big animals at sea, such as sharks and rays, and how baleen whales’ consumption of immense quantities of prey affect ocean ecosystems. Conversely, as human actions alter the oceans, could they affect whales’ food supplies? Our research is a sobering reminder that relationships in nature have evolved over millions of years – but could be disrupted far more quickly in the Anthropocene.

Matthew Savoca, Postdoctoral researcher, Stanford University; Jeremy Goldbogen, Assistant Professor of Biology, Stanford University, and Nicholas Pyenson, Research Geologist and Curator of Fossil Marine Mammals, Smithsonian Institution

This article is republished from The Conversation under a Creative Commons license. Read the original article.

Bottom line: Explanation of why whales are so big, but not even bigger.

The Conversation


from EarthSky https://ift.tt/2M9wrLj
Sun in zodiac constellations, 2020

Fanciful antique-looking picture of man carrying a long snake scattered with the stars of the Ophiuchus constellation, as published in Urania’s Mirror, a set of 32 constellation cards from 1824.

Ophiuchus the Serpent Bearer isn’t an astrological sign, but it is one of the constellations of the zodiac. In other words, many people are born when the sun appears in front of this constellation. In 2019, the sun will cross into Ophiuchus on November 30. Image via IanRidpath.com.

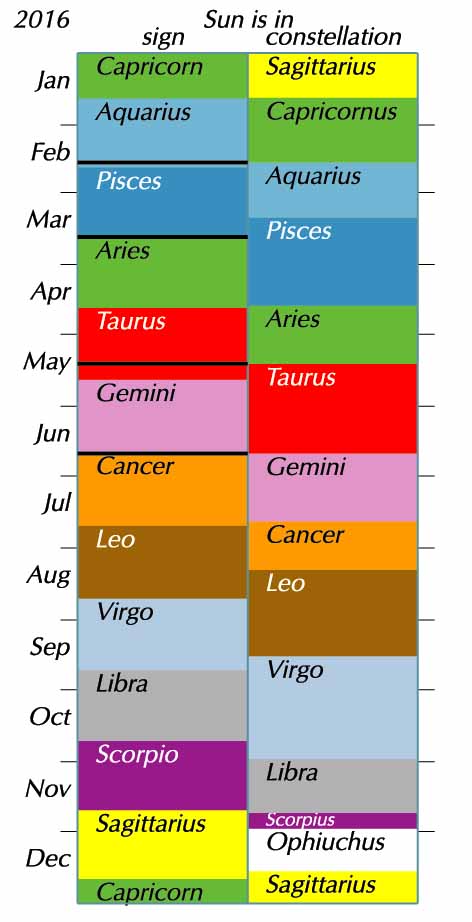
You might know that the real sun in the real sky does not appear in front of a constellation of the zodiac within the same range of dates you’ll see listed in astrological horoscopes. That’s because astrology and astronomy are different systems. Astrologers typically indicate the sun’s position with signs while astronomers use constellations. We were asked for:

… a list of the constellations that fall on the ecliptic with the exact degrees.

And we’ve located this information in Guy Ottewell’s Astronomical Calendar 2020. Below, you’ll find the dates for the sun’s entry into each zodiacal constellation during the year 2020, plus the sun’s ecliptic longitude – its position east of the March equinox point on the ecliptic – for each given date.

We are using the boundaries for the zodiacal constellations established by the International Astronomical Union in the 1930s.

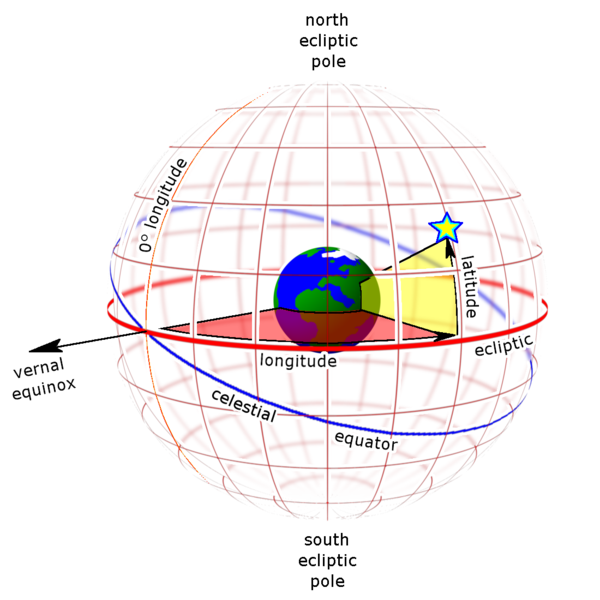
Sun-centered celestial globe

The sun resides at a longitude of 0o on the ecliptic at the March equinox. The sun is at 90o ecliptic longitude at the June solstice, 180o ecliptic longitude at the September equinox and 270o ecliptic longitude on the December solstice. Image via Wikipedia

Date of sun’s entry into each zodiacal constellation (and corresponding ecliptic longitude):

Dec 18, 2019: Sun enters constellation Sagittarius (266.61 degrees)

Jan 20, 2020: Sun enters constellation Capricornus (299.73 degrees)

Feb 17, 2020: Sun enters constellation Aquarius (327.90 degrees)

Mar 11, 2020: Sun enters constellation Pisces (351.59 degrees)

Apr 18, 2020: Sun enters constellation Aries (29.10 degrees)

May 13, 2020: Sun enters constellation Taurus (53.48 degrees)

Jun 21, 2020: Sun enters constellation Gemini (90.44 degrees)

Jul 20, 2020: Sun enters constellation Cancer (118.27 degrees)

Aug 10, 2020: Sun enters constellation Leo (138.20 degrees)

Sep 16, 2020: Sun enters constellation Virgo (174.17 degrees)

Oct 30, 2020: Sun enters constellation Libra (217.82 degrees)

Nov 23, 2020: Sun enters constellation Scorpius (241.15 degrees)

Nov 30, 2020: Sun enters constellation Ophiuchus (248.05 degrees)

Dec 18, 2020: Sun enters constellation Sagittarius (266.62 degrees)

Source: Timetable of astronomical events

Click here to know which constellation of the zodiac presently backdrops the sun.

Earth-centered celestial sphere

Earth-centered ecliptic coordinates as seen from outside the celestial sphere. Ecliptic longitude (red) is measured along the ecliptic from the vernal equinox at 0o longitude. Ecliptic latitude (yellow) is measured perpendicular to the ecliptic. Image via Wikimedia Commons.

Constellations of the zodiac:

Taurus? Here’s your constellation
Gemini? Here’s your constellation
Cancer? Here’s your constellation
Leo? Here’s your constellation
Virgo? Here’s your constellation
Libra? Here’s your constellation
Scorpius? Here’s your constellation
Sagittarius? Here’s your constellation
Capricornus? Here’s your constellation
Aquarius? Here’s your constellation
Pisces? Here’s your constellation
Aries? Here’s your constellation
Birthday late November to early December? Here’s your constellation

Moon lovers! Order this year’s EarthSky lunar calendar here

Dates of sun's entry into astrological signs versus astronomical constellations. Chart and more explanation at Guy's Ottewell's blog. Used with permission.

Dates of sun’s entry into astrological signs versus astronomical constellations. Chart and more explanation at Guy’s Ottewell’s blog. Used with permission.

Bottom line: Sun-entry dates to zodiac constellations in 2020, using boundaries for constellations set by the International Astronomical Union in the 1930s.

Click here to learn dates the sun enters each sign of the zodiac.

What is the zodiac?


from EarthSky https://ift.tt/2S3RLFV

Scientists map a pulsar for the 1st time

Light-colored disks with bright white spots, on a dark blue background.

New “map” of hotspots on pulsar J0030, from observations from July 2017 to December 2018. Image via Goddard Space Flight Center/ NASA.

Pulsars – the extremely dense but tiny remnants of exploded stars – have been known for decades, but remain one of the most enigmatic phenomena in the known universe. They’re not easy to study, in part due to their immense distances. Now, using a special X-ray telescope launched to the International Space Station (ISS) in 2017, scientists have been able to map a pulsar and take precise measurements of its size and mass, for the first time. These momentous findings also include odd hot spots on the pulsar’s surface.

NASA announced the findings on December 12, 2019, and these results have been published in a series of new peer-reviewed papers in a special issue of The Astrophysical Journal Letters.

The study focuses on a pulsar called J0030+0451 (J0030), in an isolated region of space 1,100 light-years away in the direction of the constellation Pisces.

Astrophysicist Paul Hertz, at NASA Headquarters, said in a statement that, from its perch above Earth aboard ISS, NASA’s NICER telescope – which stands for Neutron star Interior Composition Explorer – is revolutionizing our understanding of pulsars:

Pulsars were discovered more than 50 years ago as beacons of stars that have collapsed into dense cores, behaving unlike anything we see on Earth. With NICER we can probe the nature of these dense remnants in ways that seemed impossible until now.

The researchers – two groups of scientists – used NICER observations from July 2017 to December 2018, and came up with similar results for the size and mass of the pulsar, as well as hot spots on its surface.

With the help of computer simulations, NICER found three million-degree hot spots on the pulsar, all in its southern hemisphere, but the spots didn’t look like what textbooks had predicted. One spot was small and circular, while another was longer and crescent-shaped. The third, a bit cooler, spot was slightly askew of the pulsar’s south rotational pole. Previous models had suggested that the locations and shapes of the spots would vary more.

This is the first time that such surface features have been positively identified on a pulsar. The findings indicate that pulsar magnetic fields are more complicated than the traditional two-pole model had inferred.

EarthSky 2020 lunar calendars are available! They make great gifts. Order now. Going fast!

Rotating sphere with many arc-shaped lines attached to it, and blue streams coming out of points on it.

View larger. | Simulation of a possible quadrupole magnetic field configuration – 2 pairs of oppositely charged poles – for a pulsar with hot spots only in its southern hemisphere. The new pulsar map suggests that pulsar magnetic fields are more complicated than anyone knew. Image via Goddard Space Flight Center/ NASA.

NICER was also able to determine a pulsar’s size and mass much more accurately than ever before.

One of the research teams, led by Thomas Riley, a doctoral student in computational astrophysics, and his supervisor Anna Watts, a professor of astrophysics at the University of Amsterdam, found that the pulsar is about 1.3 times the sun’s mass and 15.8 miles (25.4 km) across.

The second team, led by Cole Miller, an astronomy professor at the University of Maryland, came up with very similar results: 1.4 times the sun’s mass and about 16.2 miles (26 km) wide. Riley said:

When we first started working on J0030, our understanding of how to simulate pulsars was incomplete, and it still is. But thanks to NICER’s detailed data, open-source tools, high-performance computers and great teamwork, we now have a framework for developing more realistic models of these objects.

Miller said:

NICER’s unparalleled X-ray measurements allowed us to make the most precise and reliable calculations of a pulsar’s size to date, with an uncertainty of less than 10%. The whole NICER team has made an important contribution to fundamental physics that is impossible to probe in terrestrial laboratories.

Bright round spot with two bright beams on either side with stars in background.

Artist’s concept of a pulsar, with 2 jets: narrow, sweeping beams of radiation. Image via Goddard Space Flight Center/ Phys.org.

NICER is so accurate it can measure the arrival of each X-ray from a pulsar to better than a hundred nanoseconds (one nanosecond is a billionth of a second). That precision is about 20 times greater than any previously available.

Pulsars are the rapidly spinning, dense and tiny remnants of stars that exploded in a supernova. They are one type of neutron star and can spin up to hundreds of times per second, sweeping beams of radiation energy toward us with every rotation. J0030 revolves 205 times per second.

Pulsars are unimaginably dense; their gravity actually warps nearby space-time, the “fabric” of the universe as described by Einstein’s general theory of relativity. Their rotations are so regular, that it was first thought that they might be evidence of extraterrestrial intelligence, until it was determined they were a natural phenomenon.

Scientists now want to determine the masses and sizes of several more pulsars besides J0030. By doing so, they can better understand the state of matter in the cores of such neutron stars. The pressures and densities are well beyond anything that can be replicated in laboratories on Earth. According to Zaven Arzoumanian, NICER science lead at NASA’s Goddard Space Flight Center:

It’s remarkable, and also very reassuring, that the two teams achieved such similar sizes, masses and hot spot patterns for J0030 using different modeling approaches. It tells us NICER is on the right path to help us answer an enduring question in astrophysics: What form does matter take in the ultra-dense cores of neutron stars?

Two smiling young men, one with eyeglasses.

Thomas Riley from the University of Amsterdam (left) and Cole Miller from the University of Maryland (right) who led the two research teams. Images via University of Amsterdam/ Joint Space-Science Institute.

The new findings are a breakthrough in pulsar and neutron star research, and will help scientists learn more about these very mysterious objects. For more, check out the video below.

Bottom line: For the first time ever, scientists have created a “map” of the surface of a pulsar, showing odd hot spots, and have obtained the most accurate measurements of the size and mass of one of these objects.

Source: Focus on NICER Constraints on the Dense Matter Equation of State

Via NASA


from EarthSky https://ift.tt/2Z4qqoC

2019’s farthest perigee on December 18

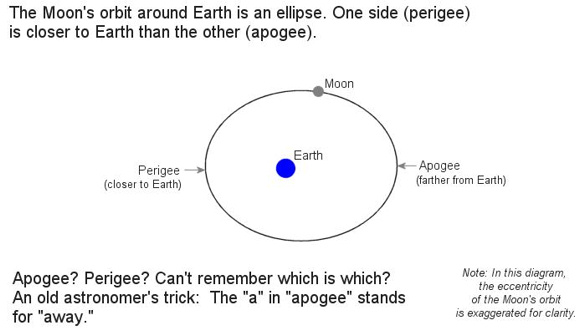
Image above: The moon’s orbit around Earth isn’t a perfect circle. But it’s very nearly circular, as the above diagram shows. Diagram by Brian Koberlein.

The moon sweeps to perigee – its closest point to Earth in its orbit – on December 18, 2019. This perigee counts as the most distant of this year’s 13 perigees. So you might say today’s moon is the farthest close moon. Notice … this most distant perigee comes when the moon is near last quarter phase. That is not an accident. More below.

How far away is the moon today? It’s 230,072 miles (370,265 km) distant. That’s in contrast to 2019’s closest perigee of 221,681 miles (356,761 km) on February 19.

If you’re game, we’ll share a secret with you about why a quarter moon at perigee is farther than the mean perigee distance of 225,804 miles or 363,396 km, and why a quarter moon at apogee is closer than the mean apogee distance of 251,969 miles or 405,504 km. We’ll also explain why a full moon or new moon at perigee is closer than the mean perigee, yet why a full moon or new moon at apogee is farther than the mean apogee. It all has to do with the varying eccentricity of the moon’s orbit.

Lunar perigees and apogees in 2019.

The 13 lunar perigees and 13 lunar apogees in 2019. M = most distant perigee and apogee; m = closest perigee and apogee. Table via Astropixels

The moon’s eccentric orbit

The moon’s orbit around Earth, like Earth’s orbit around the sun, isn’t a perfect circle. It’s a slightly oblong ellipse. That’s why, every month, the moon reaches a nearest point to Earth at perigee and a farthest point at apogee.

However, the moon’s orbit isn’t highly eccentric (oblong), but nearly circular, as shown on the illustration above.

What’s more, like everything else in nature, the moon’s orbit is always in flux. Its shape, and its orientation relative to the Earth and sun, change all the time.

So we have a moon at perigee – closest to Earth for the month – and also a moon at its last quarter phase only 1/3rd day later.

Lunar perigee: December 18, 2019, at 20:30 UTC

Last quarter moon: December 19, 2019, at 4:57 UTC

Image credit: NASA. The moon's orbit is closer to being a circle than the diagram suggests, but the exaggeration helps to clarify. The moon is closest to Earth in its orbit at perigee and farthest away at apogee.

Image credit: NASA. The moon’s orbit is closer to being a circle than the diagram suggests, but the exaggeration helps to clarify. The moon is closest to Earth in its orbit at perigee and farthest away at apogee.

The illustrations above label perigee (moon’s closest point to Earth) and apogee (moon’s farthest point from Earth). A line drawn from perigee to apogee defines the major axis, or the longest diameter, of the moon’s elliptical orbit. In the parlance of astronomers, the perigee-to-apogee line is called the line of apsides. The center of the line of apsides to either the perigee point or apogee point is called the semi-major axis.

Earth does not lie at the center of the line of apsides. Instead, the Earth is offset from the center of the major axis, or line of apsides, toward the lunar perigee point. To be more precise, the Earth resides at one of the two foci of the ellipse.

Keep in mind, also, that the moon’s major axis (longest diameter of an ellipse) always makes a right angle to the moon’s minor axis (shortest diameter of an ellipse).

Varying eccentricity of the moon’s orbit

When the moon’s major axis, or line of apsides, makes a right angle to the sun-Earth line (B in below diagram), the moon’s eccentricity decreases to a minimum. In other words, the moon’s orbit is closest to being circular when the moon’s minor axis points toward the sun. Although the moon still swings closest to Earth at perigee and farthest from Earth at apogee, the perigee distance increases and the apogee distance decreases whenever the moon’s eccentricity lessens, or more closely approaches a circle in shape.

In short, when the major axis makes a right angle with the sun-Earth line (B in below diagram), the quarter moons closely align with perigee and apogee.

Close and far moons in 2019

Some 103 days before and after the minor axis points sunward (B in above diagram), it’s then the moon’s major axis that points in the sun’s direction (A and C in above diagram). When the major axis, or line of apsides, aligns with the sun-Earth line, the eccentricity of the moon’s orbit increases to a maximum, and its orbit becomes maximally oblong. That causes the moon to swing extra-far from Earth at lunar apogee – yet extra-close to Earth at lunar perigee.

And that brings us to the full moon. It’s also no accident that 2019’s closest perigee closely aligned with the full moon.

Lunar perigee: February 19, 2019, at 9:06 UTC
Full Moon: February 19, 2019, at 15:53 UTC

When the major axis points sunward (A and C in above diagram), it’s the new moon or full moon that closely aligns with perigee/apogee. In diagram A, it’s a new moon perigee and full moon apogee; and in diagram C, it’s a full moon perigee and new moon apogee.

Farthest perigees often recur in cycles of 14 lunar months (14 returns to the same lunar phase), a period of about 413 days (1 year, 1 month and 18 days). For instance, 14 lunar months ago (from December 18, 2019), the close coincidence of last quarter moon with perigee presented last year’s farthest perigee on October 31, 2018 (230,072 miles or 370,265 km). Moreover, 14 lunar months from today (December 18, 2019), the last quarter moon will again closely align with perigee, to stage the following farthest lunar perigee of the cycle on February 3, 2021 (229,986 miles or 370,127 km).

Want to know more? Eclipses and the moon’s orbit

Resources:

Lunar perigee and apogee calculator

Moon at perigee and apogee: 2001 to 2100

Phases of the moon: 2001 to 2100

Bottom line: In 2019, the moon swings to its most distant perigee of the year on December 18, 2019.


from EarthSky https://ift.tt/2PZKMef

Water on giant exoplanets both common and scarce

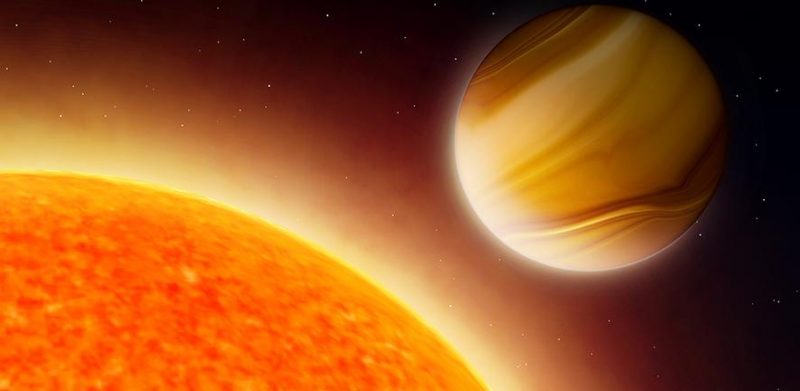
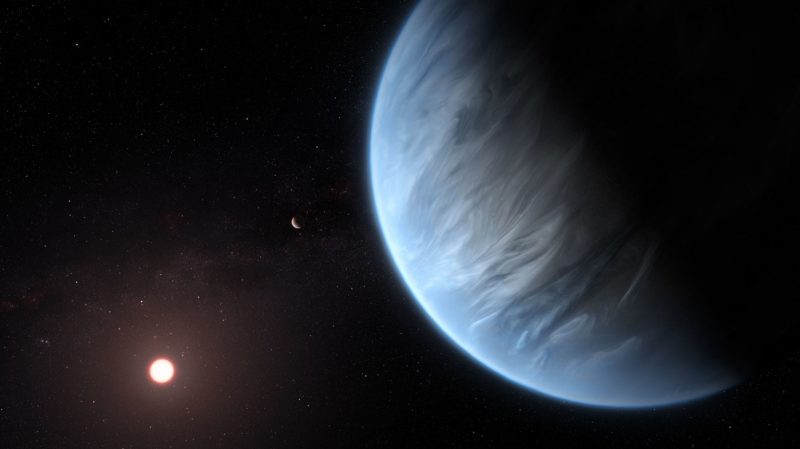
Banded giant planet close to large yellow-orange star.

Artist’s concept of a gas giant exoplanet orbiting close to its star. The new study suggests water vapor is common on such worlds, but maybe in lesser amounts than thought. Image via Amanda Smith/ University of Cambridge.

Water – needed for life as we know it – has turned out to be common in our solar system. Besides Earth, of course, there are moons in the outer solar system with oceans beneath their icy surfaces. Ice can be found almost everywhere in our neighborhood of space, even on the moon and Mercury! But what about in other solar systems? A new study, led by researchers from the University of Cambridge, suggests that water may be at the same time both plentiful and scarce, depending on the type of planets involved.

The new findings were announced by Cambridge on December 11, 2019, and the peer-reviewed paper was published in The Astrophysical Journal Letters on the same day.

The researchers studied atmospheric data from 19 known exoplanets to learn more about their chemical and thermal properties. These planets ranged from mini-Neptunes (nearly 10 Earth masses) to super-Jupiters (over 600 Earth masses). Temperatures on these worlds range from 20 degrees Celsius (about 70 degrees Fahrenheit) to over 2,000 degrees Celsius (3,600 F). These planets are similar to the gas and ice giants in our solar system, but they orbit a variety of different types of stars. Study leader Nikku Madhusudhan, of the Institute of Astronomy at Cambridge, said:

We are seeing the first signs of chemical patterns in extra-terrestrial worlds, and we’re seeing just how diverse they can be in terms of their chemical compositions.

EarthSky 2020 lunar calendars are available! They make great gifts. Order now. Going fast!

Bluish planet with clouds near star.

Artist’s concept of a mini-Neptune exoplanet. Water vapor was recently detected in the atmosphere of a world such as this. Image via ESA/ Hubble/ M. Kornmesser/ Bad Astronomy.

The findings are challenging current theories on planetary formation.

Both ground and space-based telescopes were used to gather spectrographic data from the planets, including the Hubble Space Telescope, the Spitzer Space Telescope, the Very Large Telescope in Chile and the Gran Telescopio Canarias in Spain. The researchers were able to estimate the chemical abundances of the atmospheres of all the planets.

Based on what we know about the giant planets in our own solar system, these kinds of exoplanets were predicted to have similar high abundances of certain elements such as hydrogen, oxygen and water. So what did they find?

The results showed that 14 of the planets had an abundance of water vapor, as well as an abundance of sodium and potassium in six planets each. This suggests that there is a depletion of oxygen relative to the other elements and that the planets may have evolved with little accretion of ice. As Madhusudhan noted:

It is incredible to see such low water abundances in the atmospheres of a broad range of planets orbiting a variety of stars.

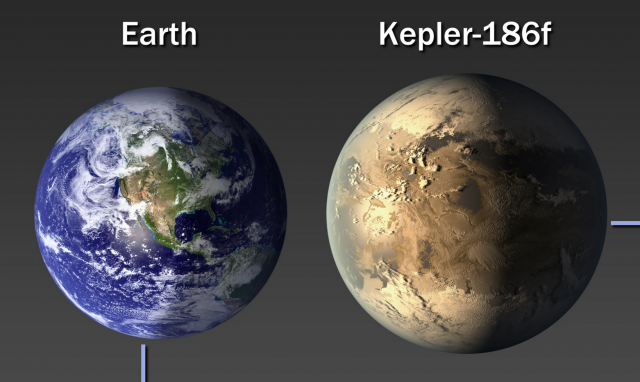
Size comparison of Earth with a slightly larger rocky planet side by side.

Comparison of exoplanet Kepler-186f with Earth (artist’s concept). Some of these Earth-sized rocky worlds should also be able to have liquid water on their surfaces, although that research was not part of this particular study, which focused on giant gas and ice planets. Image via NASA Ames/ SETI Institute/ JPL-Caltech/ Ars Technica.

This means that exoplanets can be more diverse than previously thought in terms of atmospheric composition and water content, which challenges several theoretical models of planet formation. Different chemical elements can no longer just be assumed to be equally abundant in planetary atmospheres.

It’s not easy measuring how much water there is in the atmospheres of planets so far away, but it can even be challenging for planets much closer to home. Jupiter is a prime example of this. According to Luis Welbanks, lead author of the study:

Measuring the abundances of these chemicals in exoplanetary atmospheres is something extraordinary, considering that we have not been able to do the same for giant planets in our solar system yet, including Jupiter, our nearest gas giant neighbor.

Since Jupiter is so cold, any water vapor in its atmosphere would be condensed, making it difficult to measure. If the water abundance in Jupiter were found to be plentiful as predicted, it would imply that it formed in a different way to the exoplanets we looked at in the current study.

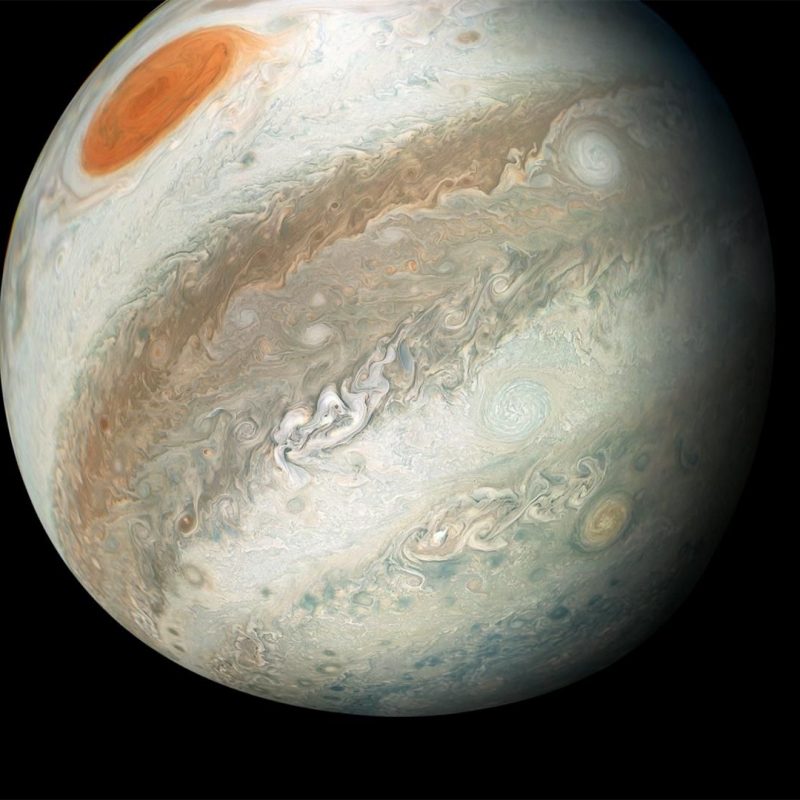
Colorful bands and swirls, with large oval red feature, in atmosphere of giant planet.

Determining the amount of water vapor in the atmospheres of the giant planets even in our own solar system can be challenging. This is Jupiter as seen by the Juno spacecraft on April 1, 2018. Image via NASA/ JPL-Caltech/ SwRI/ MSSS/ Gerald Eichstad/ Sean Doran/ Newsweek.

As already mentioned, the sample size of planets in the study is quite small, so researchers want to expand on it in the future. Madhusudhan commented:

We look forward to increasing the size of our planet sample in future studies. Inevitably, we expect to find outliers to the current trends as well as measurements of other chemicals.

It should also be noted that this current study did not include smaller rocky super-Earth or Earth-sized planets, which are now known to be quite common in our galaxy. Those are the kinds of worlds where the amount of water would have the most consequence in terms of the potential habitability of a planet.

As Madhusudhan said:

Given that water is a key ingredient to our notion of habitability on Earth, it is important to know how much water can be found in planetary systems beyond our own.

Smiling man in front of chalkboard.

Luis Welbanks, lead author of the new study. Image via University of Cambridge.

While this study may be limited regarding the types of exoplanets known to exist, it provides an important insight into how much water could be expected to be discovered among a large population of such worlds. This will help scientists better understand how these planets formed, and perhaps provide clues as to how many potentially habitable planets there may be as well, when combined with additional future studies of rocky worlds more similar to Earth.

Bottom line: A new study from the University of Cambridge shows that water vapor is common in the atmospheres of at least some larger exoplanets, but in lesser amounts than expected.

Source: Mass-Metallicity Trends in Transiting Exoplanets from Atmospheric Abundances of H2O, Na, and K

Via University of Cambridge


from EarthSky https://ift.tt/2EpVHsn

Our biggest cancer news stories 2019

2019 was a year jam packed with brilliant progress and new challenges for cancer research. Here are our top stories of the year, from the first trial of a new cancer breath test to understanding lung cancer evolution. 

Re-writing the breast cancer rulebook

In 2012, scientists at the Cancer Research UK Cambridge Institute discovered that they could separate breast cancer into 10 distinct categories by studying faults in their DNA, creating a new set of rules for defining breast cancer. And this year they’ve shown these rules stand the test of time with cancers in the different categories behaving very differently 20 years after they were initially diagnosed.  

Caldas and his team won’t stop there they hope to turn what they’ve learnt into a test that could help give women diagnosed with breast cancer more certainty about their future, as well as treatment options that are right for them. Read more about their amazing research in our blog post.

We also visited the team’s breast cancer avatars, which could help to tailor treatments for hard-to-treat cancers. 

 A cancer breath test enters trials 

This year, Cancer Research UK-funded scientists were the first to trial a non-invasive breath test thats hoping to detect multiple cancers by picking up distinctive molecules, or ‘signatures’, in people’s breath 

Three new teams take on some of the biggest challenges in cancer research 

Our ambitious Grand Challenge research award was set up 5 years ago to help revolutionise our understanding of cancer. This year, Grand Challenge has selected 3 international groups of determined scientists to confront some of the biggest questions in cancer research.  

To embark on a virtual trip into the gut – check out the video below 

 Tracking cancer evolution with the TRACERx lung study  

Survival of the fittest doesn’t just apply to animals in the wild cancers are constantly evolving and adapting in order to survive. Our TRACERx study is tracking lung cancers in nearly 850 patients, scrutinising the precise evolution of the cancer, in order to develop new, more tailored treatment combinations 

The team, led by Cancer Research UK’s lead clinician Professor Charles Swanton, have analysed the tactics tumours use to respond to and hide from the immune system.  

And new results published this year has found that detecting potential tumour cells in the blood after surgery could help predict the course the disease could take and the likelihood of lung cancer returning. We went to Manchester to catch up with Caroline Dive, who told us how this new information could change lung cancer treatment.
   

Our NHS diaries reveal the impact of staff shortages 

 One in 10 NHS diagnostic staff positions are currently unfilled in England. So we went behind the scenes to hear what it’s for like for the people giving and receiving a diagnosis under the pressures of an NHS in crisis.  

We spoke to Dawn, a consultant radiographer who diagnoses breast cancer and Neil, who was diagnosed with penile cancer 5 years ago and was waiting to hear if his cancer had come back.  

Science Surgery 

As well as speaking with our brilliant researchers, we answered some of your important questions about cancer this year… 

Confessions of a former junk food ad exec 

Last year, the Government revealed its bold ambition to halve childhood obesity by 2030, committing to consult on introducing a 9pm watershed on junk food marketing. It’s a measure we’ve been campaigning for since 2016, but it’s not a done deal yet.  We need to keep the pressure up to ensure the Government turns its proposals into action.

We spoke to Dan Parker, a former food ad exec turned campaigner, about the tricks of the trade used by marketers to influence how people make decisions about what they eat. To find out more about what Dan suggests we can do tackle this continuing problem, read our blog post.

A spotlight on detecting cancer early  

The earlier a cancer is picked up, the more likely a person is to survive. Finding innovative new ways to help detect the very early stages of cancer is one of our top priorities, and this year we announced a new international alliance to help accelerate research in this area. 

We also spoke to some of our scientists about exciting research that is helping to pick up cancer clues in blood, poo and urine.  

Thanks for all your generous donations throughout 2019 that made this amazing work possible. Merry Christmas and a Happy New Year from Cancer Research UK. 

 Lilly 


from Cancer Research UK – Science blog https://ift.tt/2PTDEAd