See moon, Leo, and Mars before daybreak

Before dawn on October 23 and 24, 2019, watch as the moon slides in front of the constellation Leo the Lion. Then, as the morning darkness begins to give way to dawn, watch for the planet Mars to climb above the sunrise point on the horizon. Leo’s starlit figure will be found in the eastern (sunrise) direction, in the predawn sky, at which time Mars will still be beneath the eastern horizon. Mars will only come into view as dawn’s light begins to increase. See the chart at the bottom of this post.

Leo is identifiable for the prominent backwards question mark pattern within it; this pattern is a well-known asterism, called The Sickle. Although the chart at top is especially designed for North America, you’ll see the moon in the vicinity of the star Regulus from around the world. Before dawn on these same dates in the world’s Eastern Hemisphere, you’ll see the moon offset farther westward (upward) relative to the backdrop stars of the zodiac than we do in North America. For your specific view, at your location on the globe, try Stellarium.

EarthSky 2020 lunar calendars are available! They make great gifts. Order now. Going fast!
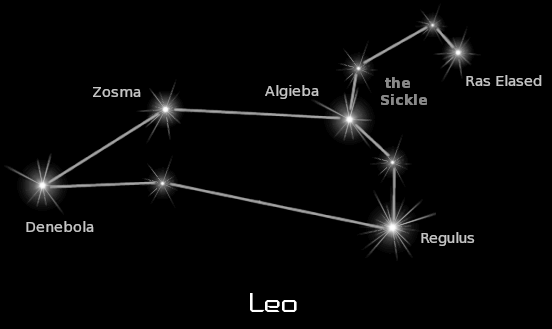
Star chart with lines in vaguely animal-shaped pattern with head to right.

Regulus is part of a backwards question mark pattern known as The Sickle in Leo. That pattern represents Leo’s head and shoulders. Notice the star Denebola, at the rear of Leo. Many stars have deneb in their name. It means tail, in this case the tail of Leo the Lion. Image via Derekscope.

For all of us, the illuminated portion of a waning moon always points eastward, toward the coming sunrise. Eastward is also the moon’s direction of travel in front of the background stars of the zodiac. This motion of the moon in our sky is, of course, due to its movement in orbit around Earth.

In the period of one day – between the mornings of October 23 and 24 – you can easily see the moon’s change of position relative to Regulus, the constellation Leo’s only 1st-magnitude star, located at the bottom of the backwards question mark pattern. Regulus depicts the Lion’s Heart and is sometimes known as Cor Leonis.

On the morning of October 23, note that the lit side of the waning crescent moon points at Regulus. By the the morning of October 24, the moon will have swept past Regulus, moving, as it always does, in its ceaseless orbit around Earth. It’ll be located in Leo’s mid-section.

And then of course the moon will keep moving, morning after morning, until it falls into the sun’s glare. New moon will come on October 27-28, 2019. But before this waning moon drops into the sunrise, use it to glimpse Mars, which is just now returning to the eastern sky at dawn.
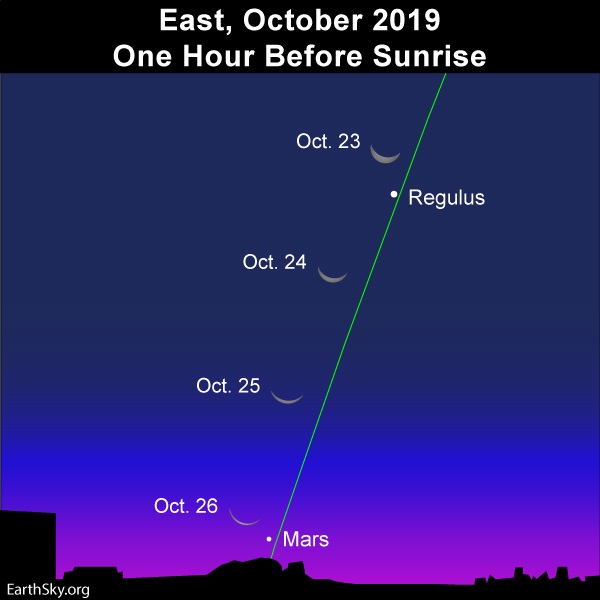
Nearly vertical ecliptic line. Positions of thin crescent moon over several days. Regulus and Mars.

These next several mornings – October 23, 24, 25 and 26, 2019 – you can use the lit side of the waning crescent moon to envision the ecliptic and to locate the planet Mars. The waning crescent moon points to Mars on October 23, 24 and 25. On October 26, look for the moon to swing close to Mars on the sky’s dome.

Look for Mars near the sunrise point on the horizon as the predawn darkness is giving way to morning twilight.

You’ll be looking for Mars along the ecliptic, noticeable in your sky as the sun’s path from east to west each day. In other words, Mars will rise at about the same place that the sun will rise.

Here are the approximate rising times for Mars at various latitudes (presuming a level horizon in the direction of sunrise):

35 degrees north latitude
Mars rises 1 hour and 20 minutes before the sun

Equator (0 degrees latitude)
Mars rises 1 hour before the sun

35 degrees south latitude
Mars rises 40 minutes before the sun

Want more specific information? Click here to find a sky almanac.

Mars has only recently entered into the morning sky, and is only modestly bright right now. So you may need binoculars to view this world from southerly latitudes in the Southern Hemisphere, where Mars sits low in the glare of morning twilight. Day by day, however, Mars rises earlier before sunrise, and is slowly but surely brightening. So keep looking!

By the way, here’s a bit more about the ecliptic. The ecliptic – path of the sun, moon and planets – is always shown in green on EarthSky sky charts. It’s like a center line on the great big celestial highway. It divides the band of stars that we call the zodiac into its northern and southern sides. The star Regulus in Leo is the only 1st-magnitude star to align almost squarely with the ecliptic. Regulus lies a scant 1/2 degree north of the ecliptic. For reference, the moon’s angular diameter equals about 1/2 degree.

Bottom line: Get up before dawn to see the moon and the starry figure of Leo the Lion in the eastern sky. Then, as darkness gives way to dawn, use the lit side of the waning lunar crescent to find the planet Mars near the sunrise horizon.


from EarthSky https://ift.tt/31wNLPe

Before dawn on October 23 and 24, 2019, watch as the moon slides in front of the constellation Leo the Lion. Then, as the morning darkness begins to give way to dawn, watch for the planet Mars to climb above the sunrise point on the horizon. Leo’s starlit figure will be found in the eastern (sunrise) direction, in the predawn sky, at which time Mars will still be beneath the eastern horizon. Mars will only come into view as dawn’s light begins to increase. See the chart at the bottom of this post.

Leo is identifiable for the prominent backwards question mark pattern within it; this pattern is a well-known asterism, called The Sickle. Although the chart at top is especially designed for North America, you’ll see the moon in the vicinity of the star Regulus from around the world. Before dawn on these same dates in the world’s Eastern Hemisphere, you’ll see the moon offset farther westward (upward) relative to the backdrop stars of the zodiac than we do in North America. For your specific view, at your location on the globe, try Stellarium.

EarthSky 2020 lunar calendars are available! They make great gifts. Order now. Going fast!

Star chart with lines in vaguely animal-shaped pattern with head to right.

Regulus is part of a backwards question mark pattern known as The Sickle in Leo. That pattern represents Leo’s head and shoulders. Notice the star Denebola, at the rear of Leo. Many stars have deneb in their name. It means tail, in this case the tail of Leo the Lion. Image via Derekscope.

For all of us, the illuminated portion of a waning moon always points eastward, toward the coming sunrise. Eastward is also the moon’s direction of travel in front of the background stars of the zodiac. This motion of the moon in our sky is, of course, due to its movement in orbit around Earth.

In the period of one day – between the mornings of October 23 and 24 – you can easily see the moon’s change of position relative to Regulus, the constellation Leo’s only 1st-magnitude star, located at the bottom of the backwards question mark pattern. Regulus depicts the Lion’s Heart and is sometimes known as Cor Leonis.

On the morning of October 23, note that the lit side of the waning crescent moon points at Regulus. By the the morning of October 24, the moon will have swept past Regulus, moving, as it always does, in its ceaseless orbit around Earth. It’ll be located in Leo’s mid-section.

And then of course the moon will keep moving, morning after morning, until it falls into the sun’s glare. New moon will come on October 27-28, 2019. But before this waning moon drops into the sunrise, use it to glimpse Mars, which is just now returning to the eastern sky at dawn.

Nearly vertical ecliptic line. Positions of thin crescent moon over several days. Regulus and Mars.

These next several mornings – October 23, 24, 25 and 26, 2019 – you can use the lit side of the waning crescent moon to envision the ecliptic and to locate the planet Mars. The waning crescent moon points to Mars on October 23, 24 and 25. On October 26, look for the moon to swing close to Mars on the sky’s dome.

Look for Mars near the sunrise point on the horizon as the predawn darkness is giving way to morning twilight.

You’ll be looking for Mars along the ecliptic, noticeable in your sky as the sun’s path from east to west each day. In other words, Mars will rise at about the same place that the sun will rise.

Here are the approximate rising times for Mars at various latitudes (presuming a level horizon in the direction of sunrise):

35 degrees north latitude
Mars rises 1 hour and 20 minutes before the sun

Equator (0 degrees latitude)
Mars rises 1 hour before the sun

35 degrees south latitude
Mars rises 40 minutes before the sun

Want more specific information? Click here to find a sky almanac.

Mars has only recently entered into the morning sky, and is only modestly bright right now. So you may need binoculars to view this world from southerly latitudes in the Southern Hemisphere, where Mars sits low in the glare of morning twilight. Day by day, however, Mars rises earlier before sunrise, and is slowly but surely brightening. So keep looking!

By the way, here’s a bit more about the ecliptic. The ecliptic – path of the sun, moon and planets – is always shown in green on EarthSky sky charts. It’s like a center line on the great big celestial highway. It divides the band of stars that we call the zodiac into its northern and southern sides. The star Regulus in Leo is the only 1st-magnitude star to align almost squarely with the ecliptic. Regulus lies a scant 1/2 degree north of the ecliptic. For reference, the moon’s angular diameter equals about 1/2 degree.

Bottom line: Get up before dawn to see the moon and the starry figure of Leo the Lion in the eastern sky. Then, as darkness gives way to dawn, use the lit side of the waning lunar crescent to find the planet Mars near the sunrise horizon.


from EarthSky https://ift.tt/31wNLPe

Did the Viking landers find life on Mars in 1976?

Reddish soil and rocks on white frost-covered ground under pale yellow-pink sky.

Water frost on Mars rocks and soil near the Viking 2 lander, May 18, 1979. Image via NASA/JPL/Ted Stryk/The Planetary Society.

Did NASA find evidence of life on Mars way back in the 1970s? That is a question that has been much debated for the past few decades, regarding the positive-yet-inconclusive results from the biology tests of the two Viking landers in 1976. Both landers reported positive results when the Martian soil was tested for the possible presence of microbes, but now, most scientists have concluded that those results were caused by unusual chemistry in the soil, not life.

But not all scientists. Gilbert Levin, who was the principal investigator for the Labeled Release (LR) life detection experiment for both landers, still maintains that Viking really did discover life in the red sands of Mars after all. He outlined his stance in an opinion piece in Scientific American on October 10, 2019.

As Levin noted, both landers sent back positive results for the detection of microbial respiration:

On July 30, 1976, the LR returned its initial results from Mars. Amazingly, they were positive. As the experiment progressed, a total of four positive results, supported by five varied controls, streamed down from the twin Viking spacecraft landed some 4,000 miles apart. The data curves signaled the detection of microbial respiration on the Red Planet. The curves from Mars were similar to those produced by LR tests of soils on Earth. It seemed we had answered that ultimate question.

The experiments seemed to be saying that there were living, breathing microbes in the Martian soil. But there was one big problem: neither lander had found organics in the soil, which any life would be made of and without which you couldn’t have life at all.

EarthSky 2020 lunar calendars are available! They make great gifts. Order now. Going fast!

Sand drifts, rocks and reddish soil with narrow, deep trenches and robotic lander in foreground.

Viking 1 with its sampling arm in the foreground and deep trenches dug into the soil. Experiments on the lander – as well as on Viking 2 – seemed to indicate the presence of Martian microbes in the soil. Image via NASA/Roel van der Hoorn/Forbes.

There were three experiments on each lander, including LR, that tested for life:

The Gas Chromatograph – Mass Spectrometer (GCMS), which would heat the soil to varying temperatures and measure the molecules that turned into a gaseous form, capable of measuring a huge variety of molecular compounds down to densities of a few parts-per-billion.

The Gas Exchange (GEX) experiment took an incubated sample of Mars soil and replaced the Martian atmosphere with helium, an inert gas. They then applied both nutrients and water, and looked for signatures of biological activity: absorption or emission of oxygen, carbon dioxide, nitrogen, hydrogen and methane.

The Labeled Release (LR) experiment took a sample of Martian soil and applied a drop of nutrient solution to it, where all of the nutrients were tagged with radioactive carbon-14. Radioactive carbon-14 would then be metabolized into radioactive carbon dioxide, which should only be detected if life were present.

The consensus from most scientists in the years since then has been that there was something in the soil mimicking life, but it wasn’t life itself. As a result, none of the following missions over the next few decades carried any life detection experiments like Viking did. Instead, they have focused on past habitability, whether or not Mars could have supported life in the past. That has been an unpopular strategy for many people, as it seemed that NASA was abandoning any actual additional search for life on Mars.

Drafting drawing of very complex scientific apparatus with 27 parts labeled.

The complete biological experiment package, identical for each lander. Image via NASA/Forbes.

The LR experiment had been quite simple: moistening samples of soil with a special nutrient “broth”and seeing if it was consumed by any microbes; it was designed to detect and monitor the metabolism of any microbes present. The nutrients were tagged with radioactive carbon. The LR experiment was sensitive to very low populations of microbes, and each run of the experiment lasted for seven days. Comparison with similar test on Earth seemed to support the biological interpretation of the results, as Levin explained:

The Viking LR sought to detect and monitor ongoing metabolism, a very simple and fail-proof indicator of living microorganisms. Several thousand runs were made, both before and after Viking, with terrestrial soils and microbial cultures, both in the laboratory and in extreme natural environments. No false positive or false negative result was ever obtained. This strongly supports the reliability of the LR Mars data, even though their interpretation is debated.

In the years since Viking, perchlorate salts had been found in the Martian soil, which have been suggested as an explanation for the lack of organics seen by Viking, since they can destroy organics. But more recently, organics have now been found in Martian rocks by the Curiosity rover, both simple ones and others a bit more complex. Some of them also hint at having come from previously more complex organic molecules, but Curiosity isn’t equipped to determine whether these have a biological origin or not.

Textured rocks with red sand.

In 2013, the Curiosity rover found some interesting textured rocks – the Gillespie Lake outcrop – in Gale Crater’s Yellowknife Bay region. The rocks resemble stromatolites or microbial mats on Earth. Image via NASA/JPL-Caltech/MSSS/Astrobiology Magazine.

As Levin summarized:

In summary, we have: positive results from a widely-used microbiological test; supportive responses from strong and varied controls; duplication of the LR results at each of the two Viking sites; replication of the experiment at the two sites; and the failure over 43 years of any experiment or theory to provide a definitive nonbiological explanation of the Viking LR results.

The Viking LR results will probably still be in dispute for years to come, especially if an updated version of the experiment isn’t sent back to Mars in the near future. The lack of any follow-up experiments in the years since has been disappointing, but it seems that NASA is now starting to take the possibility of life on Mars seriously again, even if incrementally. The Mars 2020 rover, due to launch next year and land in 2021, will look for evidence of life as its prime mission, but will focus on past life, not current biology. That may not be as ambitious as many people would like, but it’s a step in the right direction.

Apart from the organics, other, more recent findings on Mars would also seem to support at least the possibility that microbes really were present in the soil samples that Viking analyzed. These include the existence of methane, found and documented by the Curiosity rover, orbiters and telescopes on Earth. We don’t yet know the origin of the Martian methane, but on Earth at least, it comes primarily from microbes (and cows!), as well as other geological processes. Curiosity also came across rock formations in the Yellowknife Bay region of Gale Crater that resemble stromatolites or microbial mats on Earth, which are produced by microorganisms. The finding was the subject of an extensive analysis by Nora Noffke at Old Dominion University. On a similar note, the Spirit rover found silica formations that resemble those created by microorganisms in hot spring environments.

A smiling older man in a seersucker suit and red tie.

Gilbert V. Levin, Ph.D. Image via Gilbert Levin.

None of these have been proven to be evidence of life yet, but they are tantalizing. Plus there are the findings from multiple rovers, landers and orbiters that continue to show that Mars once had a much more habitable environment than it does now, with rivers, lakes and maybe even an ocean.

There is also new evidence for subsurface water still existing on Mars today, including below the south polar ice cap and perhaps even in a global reservoir. That would, of course, have direct implications for the possibility of life – at least microbial – on Mars today.

Levin listed other possible positive clues to life on Mars as well, in his article.

While life on Mars, either past or present, still hasn’t been proven, the work of Gilbert Levin and other discoveries keep bringing us closer to the point when we may know for sure.

More information about Levin’s work is available on his website.

Bottom line: Gilbert Levin, the principal investigator for the Labeled Release (LR) life detection experiments on the Viking landers on Mars in the 1970s, still maintains that they really did find evidence of current microbial life in Martian soil.

Via Scientific American


from EarthSky https://ift.tt/2J96Z71

The breast cancer ‘avatar’ mice that could help personalise treatment 

All cancers are different. Lung cancer is very different to breast cancer, and one person’s breast cancer may be very different to another’s.

This means treatment for one group of patients won’t necessarily work for another. And without more accurate ways to tell who should get which treatment in certain cases, there’s the potential for unnecessary anxiety, wasted time and money.

Our breast cancer researchers in Cambridge are working to stop that.

Quick and personal decisions

Dr Jean Abraham co-leads the Personalised Breast Cancer Programme (PBCP), a collaboration between Cancer Research UK and Addenbrooke’s Charitable Trust. It has analysed the genes of 600 breast cancer patients to see if they could do this quickly enough to use the information to guide treatment decisions.

These patients are also involved in clinical trials aiming to understand why some respond to treatment while others don’t, by examining the genetic details of their individual cancers.

“The real drive is to identify those who would benefit from treatment and spare treatment from those who don’t need it,” says Abraham, who believes the programme is already making a difference.

“It’s led to changes in treatment decisions which in turn has prevented severe toxicities in some patients as they’ve managed to avoid drugs which they may have had problems handling. It has also led to the screening of patients’ families due to previously unknown inherited cancer risk,” she says.

For most patients, the results confirmed that they were receiving the best treatment available. But a small number (15 in 100) were found to be better suited to a different drug, and over half (more than 60 in 100) were found to be potentially eligible for a clinical trial should their cancer come back in the future.

“The beauty of the sequencing project is that we are getting the data faster and can react,” Abraham says.

Over the next 5 years the team aim to recruit 1650 more patients across the UK.

The Cancer Research UK Cambridge Institute, just a stone’s throw away from Addenbrooke’s Hospital, is also developing,“Integrated Cancer Medicine”, an approach combining genetic studies, imaging, animal and clinical data to better predict how patients’ cancers might respond to treatment. The PBCP provides part of the genomic data required to develop this approach, but it’s also being used by other researchers.

The ‘avatar’ mice that could personalise breast cancer care

Dr Alejandra Bruna, from the Cancer Research UK Cambridge  Institute, transplants tumour samples taken directly from a patient during surgery into mice, aiming to recreate the complexity of the patient’s cancer in these so-called ‘avatars’.

“One of the main drawbacks in cancer research has been the lack of laboratory tools that represent the true complex nature of tumours in patients,” she says. “This has impacted our understanding of cancer biology and drug development, and our findings in the lab aren’t always reproduced in the clinic.”

These avatars are an attempt to develop more representative techniques.

Bruna’s own inspiration came from realising that every patient is different, and conversations she had with her father while he was being treated for cancer.

“I asked myself if there would ever be a way to test lots of different therapies in one given tumour, which would help us treat patients more efficiently and with less toxicity,” she says.

So far, she’s grown tumours from more than 100 breast cancer patients in mice,showing that they’re very similar to the patient’s original tumour.

“We have shown that when you put a tumour in the avatar mouse that tumour retains all the molecular features that that tumour has in the human.”

They’ve then gone a step further. “We’ve tested how that specific tumour responds to hundreds of different therapies,” she says. And this is the power of the technique – patients can only be treated in one way at a time, but different treatments can be tested in multiple mice.

“We have that same tumour in many different realities,” says Bruna.

Paradoxically, another motivation for Bruna is reducing the number of animals used in research. Developing more accurate techniques means fewer mice will be used in the future.

She hopes that the information from these studies could help guide clinical decision making for patients in the future. Currently they are testing whether drug responses and the tumour’s behaviour are the same in the patient as their very own avatars.  The next goal would be to run a clinical trial to test whether avatars could be used to predict which future therapies would work best in patients whose disease has returned. This would help doctors and patients make a more informed choice, as right now there’s not a huge amount of evidence for what treatment to use when cancer comes back.

The research continues

But these techniques are expensive and need lots of infrastructure and expertise. And not all tumours transplanted into mice will grow.

One downside is that these mice lack an immune system, which has a big impact on how cancers progress and respond to treatment.

There’s a lot more to do, such as setting up this clinical trial to see if using the information on avatars will benefit patients. They also need to refine which patients these avatars could help most, possibly focusing on a subset of patients with fewer treatment options.

Bruna and Abraham are hopeful this will move quickly, largely because patients have been so generous in supporting the work.

“Time and time again I’m struck by how willingly, at a very vulnerable moment in their lives, shortly after being diagnosed, patients will commit to help with multiple research projects largely to help those who come after them,” Abraham says.

“This study and its legacy is really down to them.”

Michael


from Cancer Research UK – Science blog https://ift.tt/2BxWzdi

New cracks in Pine Island Glacier are getting longer

The European Space Agency (ESA) released the video above on October 18, 2019. It shows the evolution throughout 2019 of two large cracks in Pine Island Glacier in Antarctica. If you watch, you’ll see that the sizes of Paris and New York’s Manhattan Island are also shown, to help you see the scale of the glacier’s cracks. Since early 2019, the two large rifts each have rapidly grown to approximately 12 miles (20 km) in length.

ESA created the video using satellite data from the Copernicus Sentinel-1 mission, which carries radar, and which therefore can return images from Antarctica year-round, even during the long months of continuous winter darkness.

Pine Island Glacier is one of many Antarctic ice streams, but it’s of special interest to scientists in part because observations have shown it to be changing rapidly. It’s one of the primary ice arteries in the West Antarctic Ice Sheet, yet it’s known to be thinning, accelerating in its already-fast flow, and also receding back landward from the Amundsen Sea, which is part of the Southern Ocean encircling the Antarctic continent. All of these characteristics of Pine Island Glacier contribute directly to sea level rise.

EarthSky 2020 lunar calendars are available! They make great gifts. Order now. Going fast!

A long and wide crack in a glacier, showing dark sea water in the crack.

Here’s the 12-mile-long (20-km-long) crack in Pine Island Glacier, via ESA.

Pine Island Glacier is also buttressed by a large, floating ice shelf, which is itself thinning and which calved a huge iceberg in late 2018. That iceberg was labeled B46 by scientists. It was approximately 87 square miles (226 sq km) in size. In early 2019, not long after B46 left the ice sheet, scientists spotted the additional large rifts in the glacier, shown in the video at the top of this page and in the satellite image above.

Mark Drinkwater leads the Earth and Mission Sciences Division at ESA. He said in a statement:

These new rifts appeared very soon after last year’s major calving of iceberg B46. Sentinel-1 winter monitoring of their progressive extension signals that a new iceberg of similar proportions will soon be calved.

View Pine Island Glacier on an interactive Google map

Map of Antarctica, with ice streams and glaciers highlighted and named.

View larger. | Ice streams of Antarctica with Pine Island Glacier and Thwaites glacier highlighted, via AntarcticGlaciers.org

The Pine Island Glacier ice shelf now has one of the fastest rates of ice-shelf thinning in Antarctica. ESA said on October 19, 2019, that – since the early 1990s – its ice velocity (the rate of ice flow toward the ocean surrounding Antarctica) has increased dramatically to values which exceed 30 feet (10 meters) a day.

As our earthly satellites have looked on, since the 1990s, calving events have occurred in 1992, 1995, 2001, 2007, 2011, 2013, 2015, 2017 and 2018.

ESA said that its ERS-1, ERS-2, Envisat and Copernicus Sentinel-1 satellites have previously provided images with which to monitor changes in these glaciers, and explained:

With routine, year-round Copernicus Sentinel-1 images, it is possible to track changes in the speed of the ice flow, to monitor the migration of the grounding line, and the development of fractures and rifts which ultimately lead to iceberg calving events …

Recently, the frequency of Pine Island Glacier calving events has increased. Today, the glacier is observed to be losing mass by a combination of calving events together with strong basal melting, where warm ocean currents erode the underside of the floating ice shelf. As the ice shelf both thins and calves enormous icebergs, the glacier discharge is unable to replenish the ice lost and the ice shelf front recedes from its previous position.

Mark Drinkwater added:

Long-term measurements of West Antarctic Ice Sheet glaciers such as Pine Island are critical to understanding changes to the rate of loss of ice mass into the ocean.

The animation below comes from NASA research, and was released in 2011. It’s the first complete map showing the speed and direction of ice flow in Antarctica. The map – created using integrated radar observations from a consortium of international satellites – shows glaciers flowing thousands of miles from Antarctica’s deep interior to its coast. The NASA team that created it also used the word “critical,” saying this knowledge will be:

… critical for tracking future sea-level increases from climate change.

Bottom line: ESA scientists said in October 2019 that the two new cracks in Pine Island Glacier – observed since early this year – are getting longer. They’re now about 12 miles (20 km) in length.

Via ESA


from EarthSky https://ift.tt/2W1cU3e

Early this week, watch for the Orionids

Chart showing the eastern horizon as the Orionids' radiant point, in the direction of the constellation Orion, comes into view.

View larger. | Here is the scene Sunday and Monday evenings – from Northern Hemisphere locations – as the Orionid meteors’ radiant rises into view. Notice the moon will be ascending in the sky at the same time. From the Southern Hemisphere, where this shower is also visible, the view is much the same, but the ecliptic – or path of the sun, moon and planets – and the celestial equator would be oriented differently with respect to the horizon. Chart via Guy Ottewell’s blog.

Originally printed at Guy Ottewell’s blog. Re-printed here with permission.

You may already have seen outlying meteors of the annual Orionid shower. They should reach a peak on the mornings of October 21 and 22, in the hours after midnight. Their zenithal hourly rate – the number one alert person might count in an hour at the peak time, in perfect conditions and with the meteors coming from overhead – may be 25. You’ll be very lucky if you manage to count that many, especially as this year there is a last quarter moon in the sky at the same time.

The radiant of a meteor shower is the point or small area among the stars from which the meteors seem to fly. They are particles of dusk or rock shed long ago from a comet – in this case, periodic comet 1P Halley.

The particles emit light as they hit Earth’s atmosphere and burn up. Really, they are on parallel tracks, many miles apart, and can appear in any part of the sky. If you can trace one of these shining trails back to the Orion-Gemini constellations in our sky, it was an Orionid and not a sporadic meteor.

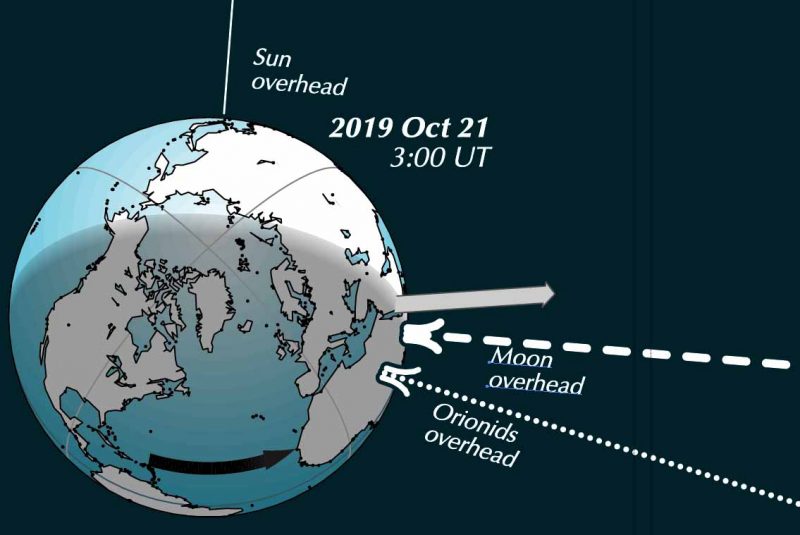
Illustration of the whole Earth around midnight in Europe, with the Orionid meteor stream encountering Earth from overhead.

View larger. | Here is the Orionid meteor stream (dotted line) striking Earth Sunday night. Guy Ottewell – who made this chart – lives in England, and he’s showing you Europe’s perspective tonight. The shower’s peak is likely Tuesday morning although Monday morning is good, too. The actual stream of particles in space – the meteor stream, debris left behind by Halley’s Comet – is millions of miles wide. People on all parts of Earth have a more or less equal chance of catching an Orionid meteor streaking across a dark night sky. Chart via Guy Ottewell’s blog.

In the picture above, Earth is seen from ecliptic north (the north pole of its orbit). The broad flat arrow shows its flight along its orbit in one minute, and the arrow on its equator shows its rotation in 3 hours. The actual stream of particles in space is millions of miles wide; the dotted line represents only those that happen to arrive from exactly overhead.

For Europe at this time, just before dawn, the Orionid radiant and the moon are almost overhead. America is moving around toward midnight and toward a nearer view of the hemisphere of sky in which the meteors can appear.

From all parts of Earth … the reason you may see more of these meteors after midnight, especially toward dawn, is that we are going to meet them: they are hitting Earth’s advancing front side, as shown in the illustration above. And that is because the orbit of their famous parent, Comet Halley, is retrograde – counter to the orbits of Earth and the other major planets.

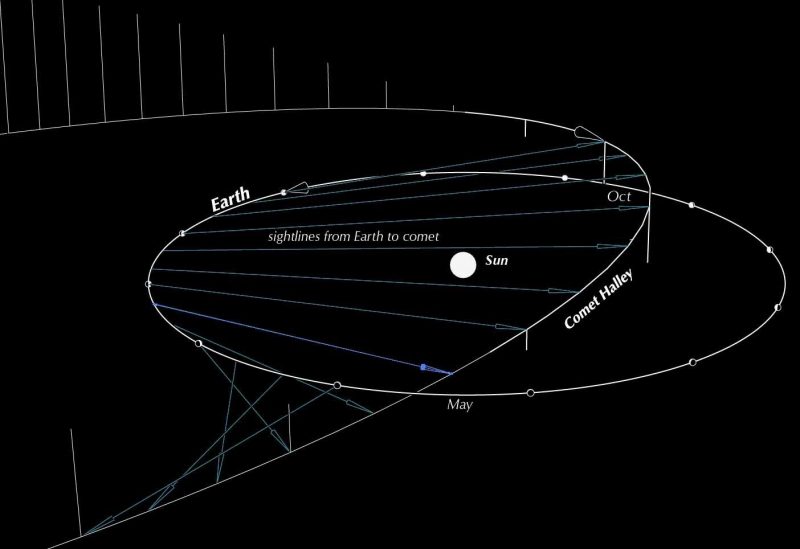
An illustration of Earth's orbit, in relationship to Comet Halley's orbit.

View larger. | This space diagram shows the path of Comet Halley during the most recent of its 76-years-apart visits, in late 1975 and early 1986. The stalks down or up to the ecliptic plane are at intervals of one month. The blue arrows are sightlines from Earth to the comet. Chart via Guy Ottewell’s blog.

You can see that the inward track is across the October part of Earth’s orbit. That’s why we see Orionid meteors in October. And the outward track is across our orbit in May. And so we shall see a second Halley-derived shower, the Eta Aquarids, in May. The orbit does not exactly intersect Earth’s. We see meteors because the particles shed by a comet gradually diverge from its orbit, filling a vast tube of space.

Bottom line: Charts and insights about this week’s Orionid meteor shower from astronomer Guy Ottewell.


from EarthSky https://ift.tt/2Mzw6SV

Last quarter moon is October 21

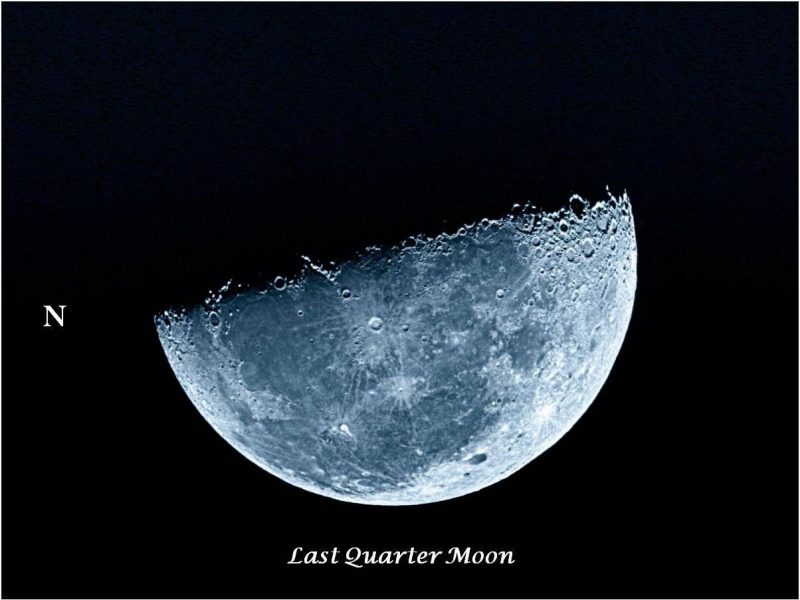
Last quarter moon after rising, lighted portion facing straight downward.

View at EarthSky Community Photos | Dr Ski in Valencia, Philippines caught the last quarter moon shortly after it rose around midnight on the morning of September 22, 2019. This moon phase is perfect for helping you envision the location of the sun … below your feet. Thanks, Dr Ski!

A last quarter moon appears half-lit by sunshine and half-immersed in its own shadow. It rises in the middle of the night, appears at its highest in the sky around dawn, and sets around midday.

On a last quarter moon, the lunar terminator – the shadow line dividing day and night – shows you where it’s sunset on the moon.

A last quarter moon provides a great opportunity to think of yourself on a three-dimensional world in space. For example, it’s fun to see this moon just after moonrise, shortly after midnight. Then the lighted portion points downward, to the sun below your feet. Think of the last quarter moon as a mirror to the world you’re standing on. Think of yourself standing in the middle of Earth’s nightside, on the midnight portion of Earth.

Features on the last quarter moon.

View at EarthSky Community Photos. | September 22, 2019 photo by Dr Ski. He wrote: “The moon’s southern limb at last quarter. The Straight Wall is either black or white depending on the angle of the sun’s rays. At lunar sunset (now), it’s white. Around full moon, Tycho is one of the easiest craters to find due to the impact rays emanating from it. It’s like the hub of a spoked wheel! At last quarter, Tycho becomes unremarkable. Clavius, on the other hand, becomes remarkable at high magnification.”

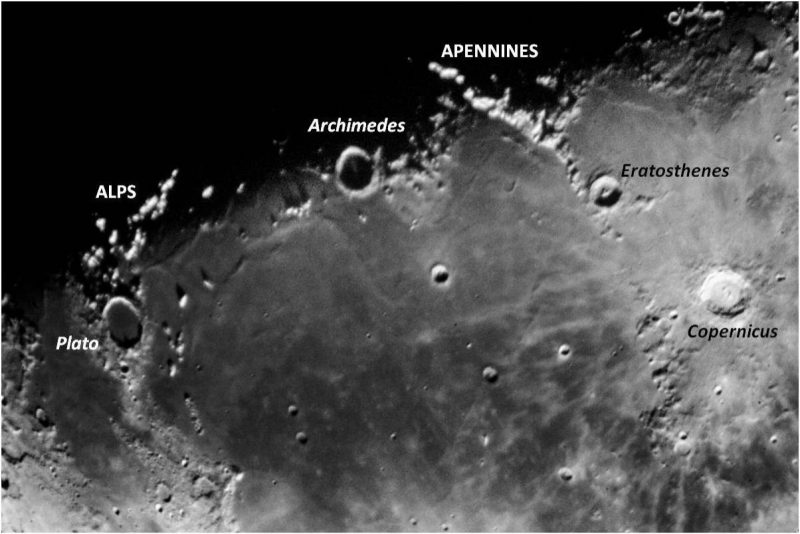
Features on the last quarter moon.

View at EarthSky Community Photos. | September 22, 2019 photo by Dr Ski. He wrote: “The Sea of Rains at last quarter. The lunar Alps and Apennines are bisected by the moon’s meridian. You can get an idea of the height of these mountains by how far they extend into the dark side of the terminator. At an elevation of over 5,000 meters [16,000 feet], the Apennines are twice as tall as the Alps.”

Also, a last quarter moon can be used as a guidepost to Earth’s direction of motion in orbit around the sun.

In other words, when you look toward a last quarter moon high in the predawn sky, for example, you’re gazing out approximately along the path of Earth’s orbit, in a forward direction. The moon is moving in orbit around the sun with the Earth and never holds still. But, if we could somehow anchor the moon in space … tie it down, keep it still … Earth’s orbital speed of 18 miles per second would carry us across the space between us and the moon in only a few hours.

Want to read more about the last quarter moon as a guidepost for Earth’s motion? Astronomer Guy Ottewell talks about it here.

A great thing about using the moon as a guidepost to Earth’s motion is that you can do it anywhere … as, for example, in the photo below, from large cities.

Daytime sky. High small moon, left half visible, above conical-top water tower and tall tan brick chimney.

Ben Orlove wrote from New York City: “I was sitting in the roof garden of my building, and there was the moon, right in front of me. You were right, this is a perfect time to visualize … the Earth’s motion.”

As the moon orbits Earth, it changes phase in an orderly way. Read more: 4 keys to understanding moon phases

Bottom line: The moon reaches its last quarter phase on October 21, 2019 at 12:39 UTC. In the coming week, watch for it to rise in the east in the hours after midnight, waning thinner each morning. Translate UTC to your time.


from EarthSky https://ift.tt/2ze0n1D

Orionid meteors late night until dawn

The Orionid meteor shower will peak early this week, with the best morning likely being Tuesday, October 22. Try watching on the mornings of October 21 and 23, too. In 2019, the moon will be at or just past its last quarter phase at the shower’s peak. That means it’ll be up before dawn, interfering with the best time of night for meteor-watching. Moonlight will surely decrease the numbers of meteors you’ll see at this year’s Orionid shower, but some meteors will be able to overcome the moonlit glare. The moon is waning so, with each passing morning, there’s less moonlight. When to watch? We recommend Tuesday morning, October 22, with the foreknowledge of that bright moon joining you. Try situating yourself in the shadow of a barn or mountain, to keep moonlight from ruining your night vision.

The Orionids start producing meteors at late evening but the number of meteors increase after midnight. Typically, the greatest number of Orionid meteors streak the sky during the few hours before dawn. On a moonless night, you can see as many as 10 to 15 meteors per hour at the Orionid’s peak.

These meteors – vaporizing bits of comet debris from Halley’s Comet – look like streaks of light in the night sky. Many people call them shooting stars.

Will you see any Orionids in the moonlight? We can’t say. We do know that many do catch bright meteors in moonlight, as Eliot Herman in Tucson did earlier this month:

Automatic camera view of bright Tauruid meteor, next to a nearly full moon.

Yes, it’s possible to catch a few meteors even in very bright moonlight, assuming they are bright meteors! Eliot Herman captured this Taurid meteor on October 12, 2019. He wrote: “The nearly full Hunter’s Moon could not suppress this bright Taurid meteor in Tucson, Arizona. Taurids often yield bright meteors.” That is true, and the Orionids tend to produce fewer bright meteors. But the moon is also waning now, and casting less light in the sky than it was on October 12. How many meteors will you see on the mornings of October 21, 22 and 23? The only way to find out is to look! Thanks, Eliot!

The Taurid meteor shower tends to produce many bright fireballs (or exceptionally bright meteors). The Orionids tend to be less bright – and thus more easily overwhelmed by moonlight – but the moon isn’t full now as it was in the image above. It’s a waning moon, past last quarter when you see it in the morning sky early in the week. Eliot Herman, a veteran meteor observer, pointed out that some Orionids are very bright. The image below is an exampleof an Orionid fireball, captured in 2017:

Bright, colorful fireball (shooting star) streaking above a house.

View larger to see the colors. | Orionid fireball captured at 11:14 p.m. local time in Tucson, Arizona on October 22, 2017. Eliot Herman described this image as “my fav Orionid photo” and wrote: “Note giant red star Betelgeuse near the radiant and the Belt of Orion further to the right rising above the foothills. The remnant trail persisted for about 50 seconds with the first 14 seconds being quite visible and then remaining faintly visible for the rest of the minute following the fireball.” See Eliot’s all-sky movie of this entire night of meteor-watching in 2017.

Want to know when morning dawn (astronomical twilight) first begins? Click here and remember to check the astronomical twilight box.

Remember, you don’t need any special equipment to enjoy the show. Find an open sky away from pesky artificial lights, enjoy the comfort of a reclining lawn chair and look upward. Find dark locations at EarthSky’s stargazing page (zoom out for a worldwide view).

Just be sure to give yourself at least 20 minutes for your eyes to adapt to the darkness. And you’ll want at least an hour of viewing time. That’s because meteors often come in spurts, followed by lulls.

Orionid meteors radiate from the constellation Orion, which was captured a few days ago - October 16, 2016 - by Zefri Besar in Brunei Darussalam. He wrote:

Orionid meteors radiate from the constellation Orion, shown in this photo from October 2016 by Zefri Besar in Brunei Darussalam.

Where is the radiant point for the Orionid meteor shower? The radiant point for the Orionids is in the northern part of Orion, near Orion’s Club. Many see the Hunter as a large rectangle. You’ll surely notice its distinctive row of three medium-bright stars in the middle: those stars represent Orion’s Belt. The brightest star in the sky, Sirius, is to the southeast of Orion on the sky’s dome, and the Belt stars always point to Sirius. This constellation is up in the southeast in the hours after midnight and it’s high in the south before dawn. We will have much more to say about Orion in the months to come, because it’s one of winter’s most prominent constellations.

Do you need to know Orion to see the meteors? Nah. The meteors appear in all parts of the sky. But if you trace the paths of the meteors backward, you’ll see they all seem to come from this constellation.

How many meteors can you expect to see? The number of meteors you’ll see in any meteor shower always varies greatly depending on when and where you watch. Meteor showers are not entirely predictable. That’s the fun of them! In a dark sky, you might see about 15 meteors per hour, or one meteor every few minutes, during the Orionid peak.

Also, extend Orion's Belt in a southeast direction to locate Sirius, the brightest star of the nighttime sky.

While looking for the Orionid’s radiant point, know that you can extend Orion’s Belt to locate Sirius, the sky’s brightest star.

When should you watch for Orionid meteors? Meteor showers aren’t just one-night events. In fact, they typically last several weeks, as Earth passes through a stream of debris left behind by a comet, in this case, the famous Comet Halley. According to the International Meteor Organization (IMO), the Orionids often exhibit several lesser maxima, so meteor activity may remain more or less constant for several nights in a row, centered on a peak night.

So, before dawn on October 23, the Orionids might match – or nearly match – the numbers before dawn on October 22. The Orionid meteors generally start at late night, or around midnight, and display maximum numbers in the predawn hours. That’s true no matter where you live on Earth, or what time zone you’re in. If you peer in a dark sky between midnight and dawn on October 21 or 22, you’ll likely see some meteors flying. Some might be bright enough to overcome the moonlit glare.

What should you watch for during the Orionid shower? If you’d like to make a new friend, or revisit an old one, enjoy the company of the constellation Orion – the radiant of the Orionid meteor shower – on this dark night. Orion rises in the east at late evening, fairly close to midnight. Surrounding Orion are the bright stars typically associated with winter evenings in the Northern Hemisphere. There are many bright stars in this part of the sky, and they are beautiful and colorful. Want to try to identify some? Your best bet is a planisphere.

Want more about 2019’s Orionid meteor shower? Click here

Possible Orionid meteor moving by the Gemini stars Castor and Pollux. The constellation Orion the Hunter is found at the upper right and the star Sirius below Orion’s Belt. Image via Mike Lewinski.

Bottom line: The last quarter moon interferes somewhat with the 2019 Orionid meteor shower. Watch shortly before dawn. Try watching on the mornings of October 21, 22 and 23. A dark sky is always best. Have fun!

Donate: Your support means the world to us


from EarthSky https://ift.tt/31vSnFt