Could a melting exomoon explain Tabby’s Star?

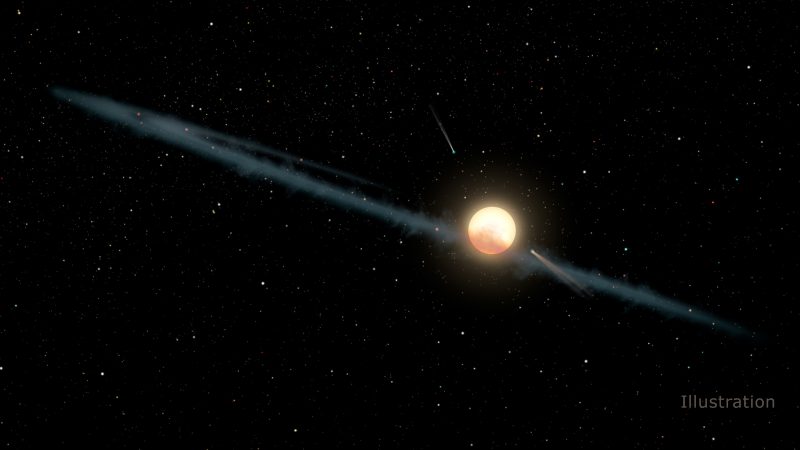
A sun-like star with an edge-on view of an irregular dust ring around it.

Artist’s concept of a hypothetical uneven ring of dust causing the mysterious dimming of Tabby’s Star, also known as KIC 8462852 or Boyajian’s Star. Image via NASA/JPL-Caltech/Columbia University.

Tabby’s Star – aka KIC 8462852 or Boyajian’s Star – has been fascinating astronomers and the public alike for the past few years now, with its weird abrupt dimmings in brightness. Theories have ranged from comets to black holes to alien megastructures to explain the odd dips. On September 16, scientists at Columbia University said they have come up with yet another possibility: a melting exomoon.

The new peer-reviewed paper was published in the Monthly Notices of the Royal Astronomical Society on September 5, 2019.

The new study focuses on the long-term dimming of Tabby’s Star, where evidence indicates that it has been gradually dimming overall for the past few decades or even centuries, if not longer. Studies have shown that the star dimmed by 14% between 1890 and 1989. This is separate from the other occasional dips, where the brightness of the star will suddenly dim for a few hours or days and then return to normal. Some of those dips have been as little as about 1%, while others as much as a whopping 22%.

But the gradual long-term dimming has been just as puzzling. The new scenario proposed involves a large icy exomoon – a moon orbiting a planet in another solar system – that is slowly “melting” or evaporating. As astrophysicist Brian Metzger of Columbia – a co-author on the new study – explained:

The exomoon is like a comet of ice that is evaporating and spewing off these rocks into space. Eventually the exomoon will completely evaporate, but it will take millions of years for the moon to be melted and consumed by the star. We’re so lucky to see this evaporation event happen.

Seven irregularly spaced dark objects with dust and gas tails in front of a sun-like star.

Theories about Tabby’s Star have ranged from comets to alien megastructures. Could the explanation really be an evaporating exomoon? Image via NASA/JPL-Caltech/Sky & Telescope.

An exomoon being slowly destroyed could also explain the other briefer, random dips. The moon could be ripped away from its planet, and in some cases, the moon could end up orbiting the star instead. When that happens, radiation from the star could tear away the outer layers of the moon, creating dust clouds. Those dust clouds could then cause the dips in brightness when they pass between the star and Earth.

But what about the long-term dimming? If an exomoon was torn apart, then pieces of it could still be present in the new orbit around the star where the moon had been pulled into. Larger-grained material forms a disk around the star, while smaller-grained clouds of dust pass through it, and larger particles can be moved closer to the star. All of this affects the opaqueness of the disk over time.

The idea of a planet and moon moving closer to its star and being destroyed is unique among the hypotheses offered for Tabby’s Star.

Young woman looking up at the stars in a planetarium.

Tabetha Boyajian, who helped bring mystery star KIC 8462852 to public attention. Image via exoplanets.astro.yale.edu.

Astrophysicist Miguel Martinez of Columbia University led the new research on Tabby’s Star. He said:

It naturally results in the orphaned exomoons ending up on (highly eccentric) orbits with precisely the properties previous research had shown were needed to explain the dimming of Tabby’s star. No other previous model was able to put all these pieces together.

If this hypothesis is correct, then another question is whether such events are rare, or could they be more common? Dips in brightness of some stars is seen quite often, but these tend to be much younger stars that still have disks of dust and gas around them, where planets can form. Tabby’s Star, however, is older and more like our own sun. The Kepler Space Telescope looked at hundreds of thousands of stars, but only saw one acting the way Tabby’s Star doesL Tabby’s Star itself. That’s not to say that Tabby’s Star is the only weird one found so far.

For example, consider the so-called Random TransiterHD 139139 – a binary star system 350 light-years from Earth. This star, also seen by Kepler, was found over a period of 87 days to undergo up to 28 transits, that is, 28 objects passing in front of the star, looking just like planets, and all the same size, except for one larger one. The problem is that there is no evidence of regular, periodic orbits for these 28 objects, as would be expected for planets. And why are they all mostly the same size? Hence the moniker Random Transiter.

Young smiling professor in front of a blackboard.

Miguel Martinez of Columbia University led the new research on Tabby’s Star. Image via Miguel Martinez.

If an evaporating exomoon really does explain Tabby’s Star, then that would also be compelling evidence that exomoons are common in our galaxy, as scientists think they should be (although a lot harder to detect). According to Metzger:

We don’t really have any evidence that moons exist outside of our solar system, but a moon being thrown off into its host star can’t be that uncommon. This is a contribution to the broadening of our knowledge of the exotic happenings in other solar systems that we wouldn’t have known 20 or 30 years ago.

The researchers seem to have made a good case for their melting exomoon idea, so it will be interesting to see what continued observations show, and if other scientists can support their findings. But it seems certain that Tabby’s Star will continue to be one of the most fascinating discoveries in space science regardless.

Bottom line: A new hypothesis could explain both the weird short dips and long-term dimming of Tabby’s Star: a “melting exomoon.”

Source: Orphaned Exomoons: Tidal Detachment and Evaporation Following an Exoplanet-Star Collision

Via Columbia University


from EarthSky https://ift.tt/2m8vKYI
A sun-like star with an edge-on view of an irregular dust ring around it.

Artist’s concept of a hypothetical uneven ring of dust causing the mysterious dimming of Tabby’s Star, also known as KIC 8462852 or Boyajian’s Star. Image via NASA/JPL-Caltech/Columbia University.

Tabby’s Star – aka KIC 8462852 or Boyajian’s Star – has been fascinating astronomers and the public alike for the past few years now, with its weird abrupt dimmings in brightness. Theories have ranged from comets to black holes to alien megastructures to explain the odd dips. On September 16, scientists at Columbia University said they have come up with yet another possibility: a melting exomoon.

The new peer-reviewed paper was published in the Monthly Notices of the Royal Astronomical Society on September 5, 2019.

The new study focuses on the long-term dimming of Tabby’s Star, where evidence indicates that it has been gradually dimming overall for the past few decades or even centuries, if not longer. Studies have shown that the star dimmed by 14% between 1890 and 1989. This is separate from the other occasional dips, where the brightness of the star will suddenly dim for a few hours or days and then return to normal. Some of those dips have been as little as about 1%, while others as much as a whopping 22%.

But the gradual long-term dimming has been just as puzzling. The new scenario proposed involves a large icy exomoon – a moon orbiting a planet in another solar system – that is slowly “melting” or evaporating. As astrophysicist Brian Metzger of Columbia – a co-author on the new study – explained:

The exomoon is like a comet of ice that is evaporating and spewing off these rocks into space. Eventually the exomoon will completely evaporate, but it will take millions of years for the moon to be melted and consumed by the star. We’re so lucky to see this evaporation event happen.

Seven irregularly spaced dark objects with dust and gas tails in front of a sun-like star.

Theories about Tabby’s Star have ranged from comets to alien megastructures. Could the explanation really be an evaporating exomoon? Image via NASA/JPL-Caltech/Sky & Telescope.

An exomoon being slowly destroyed could also explain the other briefer, random dips. The moon could be ripped away from its planet, and in some cases, the moon could end up orbiting the star instead. When that happens, radiation from the star could tear away the outer layers of the moon, creating dust clouds. Those dust clouds could then cause the dips in brightness when they pass between the star and Earth.

But what about the long-term dimming? If an exomoon was torn apart, then pieces of it could still be present in the new orbit around the star where the moon had been pulled into. Larger-grained material forms a disk around the star, while smaller-grained clouds of dust pass through it, and larger particles can be moved closer to the star. All of this affects the opaqueness of the disk over time.

The idea of a planet and moon moving closer to its star and being destroyed is unique among the hypotheses offered for Tabby’s Star.

Young woman looking up at the stars in a planetarium.

Tabetha Boyajian, who helped bring mystery star KIC 8462852 to public attention. Image via exoplanets.astro.yale.edu.

Astrophysicist Miguel Martinez of Columbia University led the new research on Tabby’s Star. He said:

It naturally results in the orphaned exomoons ending up on (highly eccentric) orbits with precisely the properties previous research had shown were needed to explain the dimming of Tabby’s star. No other previous model was able to put all these pieces together.

If this hypothesis is correct, then another question is whether such events are rare, or could they be more common? Dips in brightness of some stars is seen quite often, but these tend to be much younger stars that still have disks of dust and gas around them, where planets can form. Tabby’s Star, however, is older and more like our own sun. The Kepler Space Telescope looked at hundreds of thousands of stars, but only saw one acting the way Tabby’s Star doesL Tabby’s Star itself. That’s not to say that Tabby’s Star is the only weird one found so far.

For example, consider the so-called Random TransiterHD 139139 – a binary star system 350 light-years from Earth. This star, also seen by Kepler, was found over a period of 87 days to undergo up to 28 transits, that is, 28 objects passing in front of the star, looking just like planets, and all the same size, except for one larger one. The problem is that there is no evidence of regular, periodic orbits for these 28 objects, as would be expected for planets. And why are they all mostly the same size? Hence the moniker Random Transiter.

Young smiling professor in front of a blackboard.

Miguel Martinez of Columbia University led the new research on Tabby’s Star. Image via Miguel Martinez.

If an evaporating exomoon really does explain Tabby’s Star, then that would also be compelling evidence that exomoons are common in our galaxy, as scientists think they should be (although a lot harder to detect). According to Metzger:

We don’t really have any evidence that moons exist outside of our solar system, but a moon being thrown off into its host star can’t be that uncommon. This is a contribution to the broadening of our knowledge of the exotic happenings in other solar systems that we wouldn’t have known 20 or 30 years ago.

The researchers seem to have made a good case for their melting exomoon idea, so it will be interesting to see what continued observations show, and if other scientists can support their findings. But it seems certain that Tabby’s Star will continue to be one of the most fascinating discoveries in space science regardless.

Bottom line: A new hypothesis could explain both the weird short dips and long-term dimming of Tabby’s Star: a “melting exomoon.”

Source: Orphaned Exomoons: Tidal Detachment and Evaporation Following an Exoplanet-Star Collision

Via Columbia University


from EarthSky https://ift.tt/2m8vKYI

Why Earth has 4 seasons

Photo via Manish Mamtani Photography

Photo via Manish Mamtani Photography

All you need to know: September equinox

Nearly everyone enjoys the change of seasons on Earth – from winter to spring, from summer to fall. But why do our seasons change?

Some assume our planet’s changing distance from the sun causes the change in the seasons. That’s logical, but not the case, for Earth. Instead, Earth has seasons because our planet’s axis of rotation is tilted at an angle of 23.5 degrees relative to our orbital plane – the plane of Earth’s orbit around the sun.

The tilt in the axis of the Earth is called its obliquity by scientists.

Obliquity. Image via Wikipedia.

Autumn in New Jersey's Pinelands, by our friend Jeanette York. She said this is her backyard.

Autumn in New Jersey’s Pinelands, by our friend Jeanette York. She said this is her backyard.

Over the course of a year, the angle of tilt does not vary. In other words, Earth’s northern axis is always pointing the same direction in space. At this time, that direction is more or less toward the star we call Polaris, the North Star. But the orientation of Earth’s tilt with respect to the sun – our source of light and warmth – does change as we orbit the sun. In other words, the Northern Hemisphere is oriented toward the sun for half of the year and away from the sun for the other half. The same is true of the Southern Hemisphere.

When the Northern Hemisphere is oriented toward the sun, that region of Earth warms because of the corresponding increase in solar radiation. The sun’s rays are striking that part of Earth at a more direct angle. It’s summer.

When the Northern Hemisphere is oriented away from the sun, the sun’s rays are less direct, and that part of Earth cools. It’s winter.

Seasons in the Southern Hemisphere occur at opposite times of the year from those in the Northern Hemisphere. Northern summer = southern winter.

The tilt in Earth’s axis is strongly influenced by the way mass is distributed over the planet. Large amounts of land mass and ice sheets in the Northern Hemisphere make Earth top-heavy. An analogy for obliquity is imagining what would happen if you were to spin a ball with a piece of bubble gum stuck near the top. The extra weight would cause the ball to tilt when spun.

Over long periods of geological time, the angle of Earth’s obliquity cycles between 21.4 and 24.4 degrees. This cycle lasts approximately 41,000 years and is thought to play a key role in the formation of ice ages – a scientific theory proposed by Milutin Milankovitch in 1930.

The Earth is currently decreasing in obliquity. Decreases in obliquity can set the stage for more moderate seasons (cooler summers and warmer winters) while increases in obliquity create more extreme seasons (hotter summers and colder winters). Glaciers tend to grow when the Earth has many cool summers that fail to melt back the winter snows. Remember, we’re talking about a 41,000-year cycle here, so these changes in obliquity are not the primary driver of Earth’s climate in the century ahead. Temperatures on Earth are influenced not just by obliquity, but also by many more factors which drive our complex climate system and the global temperatures we experience from year to year. 

Other planets in our solar system also tilt at various degrees. Uranus rotates almost sideways at 97 degrees and has extreme seasons. The axial tilt on Venus is 177.3 degrees. Hence, Venus has very little in the way of seasons.

Earth’s distance from the sun does change throughout the year, and it’s logical to assume that an increase or decrease in a sun-planet distance could cause a cyclical change in the seasons. But – in the case of our planet – this change is too small to cause this change.

Our seasons change due to our planet’s angle of tilt – 23.5 degrees – relative to our orbit around the sun. If Earth did not tilt at all, but instead orbited exactly upright with respect to our orbit around the sun, there would be minor variations in temperature throughout each year as Earth moved slightly closer to the sun and then slightly farther away. And there would be temperature differences from Earth’s equatorial region to the poles. But, without Earth’s tilt, we’d lack Earth’s wonderful seasonal changes and our association of them with the various times of year – associating a fresh feeling in the air with springtime, for example.

It’s easy to imagine a planet that has a more pronounced change in its distance from its star as the planet orbits the star. Some extrasolar planets – planets orbiting distant stars – have been found with more extreme orbits. And even in our own solar system, for example, the planet Mars has a more elliptical orbit than Earth does. Its distance from the sun changes more dramatically through its year than Earth’s does, and the change in Mars’ distance from the sun does cause some more pronounced cyclical changes on this red desert world.

Image credit: James Jordan

Image via James Jordan

Bottom line: It’s logical to assume our planet’s changing distance from the sun causes the change in the seasons. But Earth’s distance from the sun doesn’t change enough to cause seasonal differences. Instead, our seasons change because Earth tilts on its axis, and the angle of tilt causes the Northern and Southern Hemispheres to trade places throughout the year in receiving the sun’s light and warmth most directly.

Enjoying EarthSky? Sign up for our free daily newsletter today!


from EarthSky https://ift.tt/2M91Ahh
Photo via Manish Mamtani Photography

Photo via Manish Mamtani Photography

All you need to know: September equinox

Nearly everyone enjoys the change of seasons on Earth – from winter to spring, from summer to fall. But why do our seasons change?

Some assume our planet’s changing distance from the sun causes the change in the seasons. That’s logical, but not the case, for Earth. Instead, Earth has seasons because our planet’s axis of rotation is tilted at an angle of 23.5 degrees relative to our orbital plane – the plane of Earth’s orbit around the sun.

The tilt in the axis of the Earth is called its obliquity by scientists.

Obliquity. Image via Wikipedia.

Autumn in New Jersey's Pinelands, by our friend Jeanette York. She said this is her backyard.

Autumn in New Jersey’s Pinelands, by our friend Jeanette York. She said this is her backyard.

Over the course of a year, the angle of tilt does not vary. In other words, Earth’s northern axis is always pointing the same direction in space. At this time, that direction is more or less toward the star we call Polaris, the North Star. But the orientation of Earth’s tilt with respect to the sun – our source of light and warmth – does change as we orbit the sun. In other words, the Northern Hemisphere is oriented toward the sun for half of the year and away from the sun for the other half. The same is true of the Southern Hemisphere.

When the Northern Hemisphere is oriented toward the sun, that region of Earth warms because of the corresponding increase in solar radiation. The sun’s rays are striking that part of Earth at a more direct angle. It’s summer.

When the Northern Hemisphere is oriented away from the sun, the sun’s rays are less direct, and that part of Earth cools. It’s winter.

Seasons in the Southern Hemisphere occur at opposite times of the year from those in the Northern Hemisphere. Northern summer = southern winter.

The tilt in Earth’s axis is strongly influenced by the way mass is distributed over the planet. Large amounts of land mass and ice sheets in the Northern Hemisphere make Earth top-heavy. An analogy for obliquity is imagining what would happen if you were to spin a ball with a piece of bubble gum stuck near the top. The extra weight would cause the ball to tilt when spun.

Over long periods of geological time, the angle of Earth’s obliquity cycles between 21.4 and 24.4 degrees. This cycle lasts approximately 41,000 years and is thought to play a key role in the formation of ice ages – a scientific theory proposed by Milutin Milankovitch in 1930.

The Earth is currently decreasing in obliquity. Decreases in obliquity can set the stage for more moderate seasons (cooler summers and warmer winters) while increases in obliquity create more extreme seasons (hotter summers and colder winters). Glaciers tend to grow when the Earth has many cool summers that fail to melt back the winter snows. Remember, we’re talking about a 41,000-year cycle here, so these changes in obliquity are not the primary driver of Earth’s climate in the century ahead. Temperatures on Earth are influenced not just by obliquity, but also by many more factors which drive our complex climate system and the global temperatures we experience from year to year. 

Other planets in our solar system also tilt at various degrees. Uranus rotates almost sideways at 97 degrees and has extreme seasons. The axial tilt on Venus is 177.3 degrees. Hence, Venus has very little in the way of seasons.

Earth’s distance from the sun does change throughout the year, and it’s logical to assume that an increase or decrease in a sun-planet distance could cause a cyclical change in the seasons. But – in the case of our planet – this change is too small to cause this change.

Our seasons change due to our planet’s angle of tilt – 23.5 degrees – relative to our orbit around the sun. If Earth did not tilt at all, but instead orbited exactly upright with respect to our orbit around the sun, there would be minor variations in temperature throughout each year as Earth moved slightly closer to the sun and then slightly farther away. And there would be temperature differences from Earth’s equatorial region to the poles. But, without Earth’s tilt, we’d lack Earth’s wonderful seasonal changes and our association of them with the various times of year – associating a fresh feeling in the air with springtime, for example.

It’s easy to imagine a planet that has a more pronounced change in its distance from its star as the planet orbits the star. Some extrasolar planets – planets orbiting distant stars – have been found with more extreme orbits. And even in our own solar system, for example, the planet Mars has a more elliptical orbit than Earth does. Its distance from the sun changes more dramatically through its year than Earth’s does, and the change in Mars’ distance from the sun does cause some more pronounced cyclical changes on this red desert world.

Image credit: James Jordan

Image via James Jordan

Bottom line: It’s logical to assume our planet’s changing distance from the sun causes the change in the seasons. But Earth’s distance from the sun doesn’t change enough to cause seasonal differences. Instead, our seasons change because Earth tilts on its axis, and the angle of tilt causes the Northern and Southern Hemispheres to trade places throughout the year in receiving the sun’s light and warmth most directly.

Enjoying EarthSky? Sign up for our free daily newsletter today!


from EarthSky https://ift.tt/2M91Ahh

A brief guide to the impacts of climate change on food production

This is a re-post from Yale Climate Connections by Daisy Simmons with input from from Dana Nuccitelli on the latest IPCC report

Food may be a universal language – but in these record-breaking hot days, so too is climate change. With July clocking in as the hottest month on Earth in recorded history and extreme weather ramping up globally, farmers are facing the brunt of climate change in croplands and pastures around the world.

Here in the U.S., for instance, climate impacts like more downpours make it harder to avert flooding and erosion on farms across the Midwest. California farmers, on the other hand, must find ways to stay productive despite increasing drought and wildfire risks.

It all amounts to far more than anecdotal inconvenience: The Intergovernmental Panel on Climate Change’s Fourth National Climate Assessment report projects that warming temperatures, severe heat, drought, wildfire, and major storms will “increasingly disrupt agricultural productivity,” threatening not only farmers’ livelihoods but also food security, quality, and price stability.

If these anticipated effects sound extreme, so too are the causes.

Five climate impacts affecting food production now

Climate change poses not just one but a whole slew of challenges to farmers – and to the larger communities that depend on them for food. From erratic precipitation to changing seasons, consider just these five key climatic changes and how they stand to affect food availability now and in the future:

1) More extreme weather can harm livestock and crops. Major storms have always devastated farms, whether from damaging winds during a storm, or erosion and landslides that can rear up even as the storm subsides. But now they’re becoming even more common. In spring 2018, for example, unusually heavy rain and snow storms caused massive flooding across the U.S. Midwest, leaving some areas 10 feet deep in sand. In Nebraska alone, farmers lost an estimated $440 million of cattle. As a result of these flooding conditions, many farmers had to delay spring planting. Delays in commodity crops like corn and soybeans aren’t just stressful for farmers, either – they could lead to food price volatility and even potential food insecurity.

2) Water scarcity across the U.S. Southwest makes it more expensive and difficult to sustain crops and livestock. Drought is in the long-term outlook across the U.S. West, with declining snowpack making it more challenging to keep reservoirs full through summer. Lack of adequate water can easily damage or destroy crops, dry up soil, and threaten livelihoods. Between 2014-2016, for example, California endured an estimated $3.8 billion of direct statewide economic losses to agriculture as a result of drought.

3) Seasons aren’t what they used to be. Growing seasons are starting earlier and getting hotter in a warming climate. A longer growing season, over time, could theoretically have some advantages, but it also presents more obstacles in the short term, such as an uptick in pest populations is possible, with more generations possible per year. Early spring onset can also cause crops to grow before the soil holds enough water and nutrients, or to ruin fruit crops that bud early and then experience later spring frost. Plus, warmer winters can affect other farming practices like grain storage.

Cornfield wildfire

Parched and fire-damaged ag fields pose mounting challenges to farmers and consumers.

4) Wildfire can devastate farms – even when the flames don’t actually reach them. Ranchers across the West have recently seen major losses as a result of worsening fire seasons, from outright loss of life to charred grazing lands and decimated hay stocks. What’s more, “secondary impacts” abound, from a smoky taint that can ruin wine, to the ordeal of keeping a farm operational when fires are raging nearby and evacuation orders seem just around the corner. All this also causes costs to mount given that the respiratory dangers of laboring in smoky, excessively hot conditions can force farms to send workers home in the height of harvest season.

5) Warmer weather and rising CO2 levels adversely affect food supply, safety and quality. According to a 2019 IPCC land use report, between 25 and 30 percent of the food produced worldwide is wasted, not all of it for the same reasons. In developed countries, for instance, consumers, sometimes seemingly with abandon, simply discard what they see as “excess” or “surplus” food. In developing countries, much of the waste is brought about by a lack of refrigeration as products go bad between producers and consumers. The IPCC report estimates that food waste costs about $1 trillion per year and accounts for about 10 percent of greenhouse gas emissions from food systems. Meanwhile, some two-billion humans worldwide are overweight or obese even as nearly one billion are undernourished, highlighting the inefficiencies and inequities in food distribution.

In addition, rising temperatures can alter exposures to some pathogens and toxins. Consider: Salmonella, Campylobacter, Vibrio parahaemolyticus in raw oysters, and mycotoxigenic fungi, which can all potentially thrive in warmer environments. More carbon dioxide in the atmosphere also can decrease dietary iron, zinc, protein, and other macro- and micronutrients in certain crops.

Now for the elephant still in the room: Food production isn’t just being affected by climate change – it’s actively contributing to climate change, too. According to IPCC’s land use report, agriculture and other land uses comprise more than one-fifth of global CO2 emissions, creating a vicious cycle.

Growing solutions to the climate crisis

The July IPCC report cited above lists various adaptation and mitigation measures that could help reduce the adverse impacts of food and dietary preferences on climate change. The suggestions address more sustainable food production and diets (more plant-based, less meat-based); improved forestry management (including reducing deforestation and increasing reforestation); agricultural carbon sequestration, including no-till farming practices; and reducing food waste.

And it warns that delaying action will be costly:

Deferral of [greenhouse gas] emissions reductions from all sectors implies trade-offs including irreversible loss in land ecosystem functions and services required for food, health, habitable settlements and production, leading to increasingly significant economic impacts on many countries in many regions of the world.

So, what can individuals do to help avert some of the worsening impacts of climate on food supply? There in fact are a number of ways to help support climate-friendlier food production.

Improving soil health, on a large-scale, is one key way forward. Nutrient-rich soil stores carbon better than degraded, overworked soil. Plus, healthy soil helps farms stay productive – a win-win. Consumers can boost these efforts, by supporting farmers and ranchers who engage in sustainable practices like cover cropping and composting.

Reducing meat consumption is another way to reduce the climate impact of food production, given that a livestock farm is like a methane factory, contributing an estimated 14.5 percent of global greenhouse gas emissions. Meatless Mondays, “flexitarian” diets, and the rise of faux-meat brands are all testimony to the growing efforts aimed at reducing meat consumption.

In addition to consumer actions, there are interesting new ways forward on the industry side. Manure digesters, for one, can convert methane from manure into electricity. And seaweed is gaining scientific interest for its potential in making cattle burp less often. (Yes, you read that right.)

Policy efforts will likely be key also. California for its part has goals to direct some cap-and-trade funding to build compost facilities, and incentivize methane reduction in dairies.

The challenges ahead are steep. But so too are the opportunities to adapt to new realities and reduce assorted diverse impacts. According to Project Drawdown, three of the top 10 best climate solutions have something to do with food, from reducing food waste (3) and choosing a plant-rich diet (4) to silvopasturing (9), which integrates trees and pasture into a single ecosystem.

It isn’t always easy to make such changes. What is getting easier, though, is to see that the world’s collective appetite for fossil fuels is having a negative impact on real food and on dietary options.

And the option of inaction on something so fundamental? Through their food-purchasing and dietary preferences, Americans increasingly, albeit perhaps only gradually, are showing that they are increasingly wary about swallowing that one.


from Skeptical Science https://ift.tt/2LKVhl4

2019 SkS Weekly Climate Change & Global Warming Digest #38

Story of the Week... Toon of the Week... Coming Soon on SkS... Climate Feedback Reviews... SkS Week in Review... Poster of the Week...

Story of the Week...

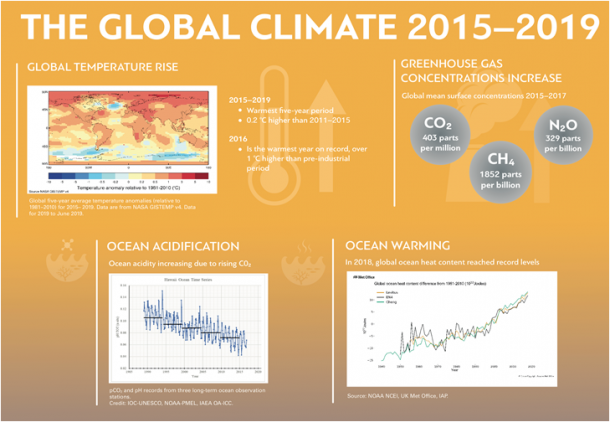
Global Climate in 2015-2019: Climate change accelerates

Record greenhouse gas concentrations mean further warming 

The Global Climate 2015-2019 

The tell-tale signs and impacts of climate change – such as sea level rise, ice loss and extreme weather – increased during 2015-2019, which is set to be the warmest five-year period on record, according to the World Meteorological Organization (WMO). Greenhouse gas concentrations in the atmosphere have also increased to record levels, locking in the warming trend for generations to come.

The WMO report on The Global Climate in 2015-2019, released to inform the United Nations Secretary-General’s Climate Action Summit, says that the global average temperature has increased by 1.1°C since the pre-industrial period, and by 0.2°C compared to 2011-2015.

The climate statement – which covers until July 2019 - was released as part of a high-level synthesis report from leading scientific institutions United in Science under the umbrella of the Science Advisory Group of the UN Climate Summit 2019. The report provides a unified assessment of the state of Earth system under the increasing influence of climate change, the response of humanity this far and projected changes of global climate in the future. It highlights the urgency and the potential of ambitious climate action in order to limit potentially irreversible impacts.

An accompanying WMO report on greenhouse gas concentrations shows that 2015-2019 has seen a continued increase in carbon dioxide (CO2) levels and other key greenhouse gases in the atmosphere to new records, with CO2 growth rates nearly 20% higher than the previous five years. CO2 remains in the atmosphere for centuries and in the ocean for even longer. Preliminary data from a subset of greenhouse gas observational sites for 2019 indicate that CO2 global concentrations are on track to reach or even exceed 410 ppm by the end of 2019.

“Climate change causes and impacts are increasing rather than slowing down,” said WMO Secretary-General Petteri Taalas, who is co-chair of the Science Advisory Group of the UN Climate Summit.

“Sea level rise has accelerated and we are concerned that an abrupt decline in the Antarctic and Greenland ice sheets, which will exacerbate future rise. As we have seen this year with tragic effect in the Bahamas and Mozambique, sea level rise and intense tropical storms led to humanitarian and economic catastrophes,” he said.

“The challenges are immense. Besides mitigation of climate change, there is a growing need to adapt. According to the recent Global Adaptation Commission report the most powerful way to adapt is to invest in early warning services, and pay special attention to impact-based forecasts,” he said.

“It is highly important that we reduce greenhouse gas emissions, notably from energy production, industry and transport. This is critical if we are to mitigate climate change and meet the targets set out in the Paris Agreement,” he said.

“To stop a global temperature increase of more than 2 degrees Celsius above pre-industrial levels, the level of ambition needs to be tripled. And to limit the increase to 1.5 degrees, it needs to be multiplied by five,” he said.

Sea level rise:

Over the five-year period May 2014 -2019, the rate of global mean sea-level rise has amounted to 5 mm per year, compared with 4 mm per year in the 2007-2016 ten-year period. This is substantially faster than the average rate since 1993 of 3.2 mm/year. The contribution of land ice melt from the world glaciers and the ice sheets has increased over time and now dominate the sea level budget, rather than thermal expansion. 

Shrinking Ice:

Throughout 2015-2018, the Arctic’s average September minimum (summer) sea-ice extent was well below the 1981-2010 average, as was the average winter sea-ice extent. The four lowest records for winter occurred during this period. Multi-year ice has almost disappeared.

Antarctic February minimum (summer) and September maximum (winter) sea-ice extent values have become well below the 1981-2010 average since 2016. This is in contrast to the previous 2011-2015 period and the long term 1979-2018 period. Antarctic summer sea ice reached its lowest and second lowest extent on record in 2017 and 2018, respectively, with 2017 also being the second lowest winter extent.

The amount of ice lost annually from the Antarctic ice sheet increased at least six-fold, from 40 Gt per year in 1979-1990 to 252 Gt per year in 2009-2017.

The Greenland ice sheet has witnessed a considerable acceleration in ice loss since the turn of the millennium.

For 2015-2018, the World Glacier Monitoring Service (WGMS) reference glaciers indicates an average specific mass change of −908 mm water equivalent per year, higher than in all other five-year periods since 1950. 

Ocean heat and acidity:

More than 90 % of the excess heat caused by climate change is stored in the oceans. 2018 had the largest ocean heat content values on record measured over the upper 700 meters, with 2017 ranking second and 2015 third.

The ocean absorbs around 30% of the annual anthropogenic emissions of CO2, thereby helping to alleviate additional warming. The ecological costs to the ocean, however, are high, as the absorbed CO2 reacts with seawater and changes the acidity of the ocean. There has been an overall increase in acidity of 26% since the beginning of the industrial revolution.

Extreme events:

More than 90 % of the natural disasters are related to weather.  The dominant disasters are storms and flooding, which have also led to highest economic losses. Heatwaves and drought have led to human losses, intensification of forest fires and loss of harvest.

Heatwaves, which were the deadliest meteorological hazard in the 2015-2019 period, affecting all continents and resulting in numerous new temperature records. Almost every study of a significant heatwave since 2015 has found the hallmark of climate change, according to the report.

The largest economic losses were associated with tropical cyclones. The 2017 Atlantic hurricane season was one of the most devastating on record with more than US$ 125 billion in losses associated with Hurricane Harvey alone. On the Indian Ocean, in March and April 2019, unprecedented and devastating back-to-back tropical cyclones hit Mozambique. 

Wildfires

Wildfires are strongly influenced by weather and climate phenomena. Drought substantially increases the risk of wildfire in most forest regions, with a particularly strong influence on long-lived fires. The three largest economic losses on record from wildfires have all occurred in the last four years.

In many cases, fires have led to massive releases of carbon dioxide to the atmosphere. Summer 2019 saw unprecedented wildfires in the Arctic region. In June alone, these fires emitted 50 megatons (Mt) of carbon dioxide into the atmosphere. This is more than was released by Arctic fires in the same month from 2010 to 2018 put together. There were also massive forest fires in Canada and Sweden in 2018. There were also widespread fires in the non-renewable tropical rain forests in Southern Asia and Amazon, which have had impacts on the global carbon budget. 

Climate change and extreme events

According to the Bulletin of the American Meteorological Society, over the period 2015 to 2017, 62 of the 77 events reported show a significant anthropogenic influence on the event’s occurrence, including almost every study of a significant heatwave. An increasing number of studies are also finding a human influence on the risk of extreme rainfall events. 

Global Climate in 2015-2019: Climate change accelerates, WMO Press Release, Sep 22, 2019


Toon of the Week...

 2019 Toon 38


Coming Soon on SkS...

  • A brief guide to the impacts of climate change on food production (Daisy Simmons)
  • Skeptical Science New Research for Week #38, 2019 (Doug Bostrom)
  • How the Greenland ice sheet fared in 2019 (Ruth Mottram, Martin Stendel & Peter Langen)
  • A small electric plane demonstrates promise, obstacles of climate-friendly air travel (Lindsay Fendt)
  • What psychotherapy can do for the climate and biodiversity crises (Caroline Hickman)
  • 2019 SkS Weekly Climate Change & Global Warming News Roundup #39 (John Hartz)
  • 2019 SkS Weekly Climate Change & Global Warming Digest #39 (John Hartz  

Climate Feedback Reviews...

 [To be added]


Poster of the Week...

2019 Poster 39 


SkS Week in Review...  


from Skeptical Science https://ift.tt/350Lrmz

Last quarter moon is September 22

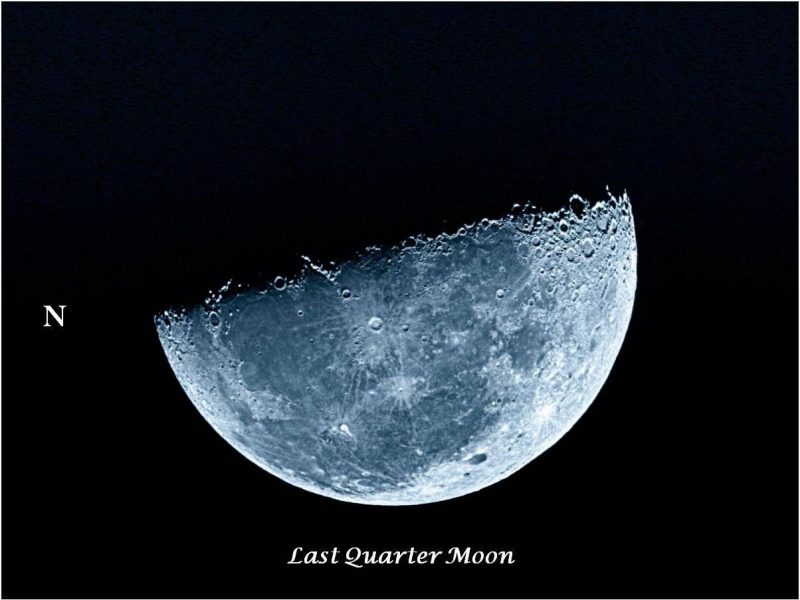
View at EarthSky Community Photos | Dr Ski in Valencia, Philippines caught the last quarter moon shortly after it rose around midnight on the morning of September 22, 2019. This moon phase is perfect for helping you envision the location of the sun … below your feet. Thanks, Dr Ski!

A last quarter moon appears half-lit by sunshine and half-immersed in its own shadow. It rises in the middle of the night, appears at its highest in the sky around dawn, and sets around midday.

On a last quarter moon, the lunar terminator – the shadow line dividing day and night – shows you where it’s sunset on the moon.

A last quarter moon provides a great opportunity to think of yourself on a three-dimensional world in space. For example, it’s fun to see this moon just after moonrise, shortly after midnight. Then the lighted portion points downward, to the sun below your feet. Think of the last quarter moon as a mirror to the world you’re standing on. Think of yourself standing in the middle of Earth’s nightside, on the midnight portion of Earth.

Also, a last quarter moon can be used as a guidepost to Earth’s direction of motion in orbit around the sun.

In other words, when you look toward a last quarter moon high in the predawn sky, for example, you’re gazing out approximately along the path of Earth’s orbit, in a forward direction. The moon is moving in orbit around the sun with the Earth and never holds still. But, if we could somehow anchor the moon in space … tie it down, keep it still … Earth’s orbital speed of 18 miles per second would carry us across the space between us and the moon in only a few hours.

Want to read more about the last quarter moon as a guidepost for Earth’s motion? Astronomer Guy Ottewell talks about it here.

A great thing about using the moon as a guidepost to Earth’s motion is that you can do it anywhere … as, for example, in the photo below, from large cities.

Daytime sky. High small moon, left half visible, above conical-top water tower and tall tan brick chimney.

Ben Orlove wrote from New York City: “I was sitting in the roof garden of my building, and there was the moon, right in front of me. You were right, this is a perfect time to visualize … the Earth’s motion.”

As the moon orbits Earth, it changes phase in an orderly way. Read more: 4 keys to understanding moon phases

Bottom line: The moon reaches its last quarter phase on September 22, 2019 at 2:41 UTC. In the coming week, watch for it to rise in the east in the hours after midnight, waning thinner each morning. Translate UTC to your time.


from EarthSky https://ift.tt/2ze0n1D

The 2nd-fastest pulsar, now with gamma rays

Small star with magenta and green beams radiating along an axis.

Artist’s concept of a pulsar. In this illustration, the pulsar swings its radio (green) and gamma-ray (magenta) beams past Earth with every spin, so that we see it as pulsing. Image via NASA.

Supernova explosions can crush ordinary stars into neutron stars, composed of exotic, extremely dense matter. Neutron stars are on the order of about 12 miles (20 km) across in contrast to hundreds of thousands of miles across for stars like our sun. Yet they contain mass on the order of 1.4 times that of our sun. Neutron stars have strong magnetic fields. They emit powerful blasts of radiation along their magnetic field lines. If, as a neutron star spins, its beams of radiation periodically point towards Earth, we see the star as a pulsing radio or gamma-ray source. Then the neutron star is also called a pulsar, often compared to a cosmic lighthouse. Modern astronomers know of pulsars spinning with mind-boggling rapidity. The 2nd-fastest one – called PSR J0952-0607 – spins some 707 times a second! Scientists at the Max Planck Institute for Gravitational Physics in Hanover, Germany announced on September 19, 2019 that this pulsar, J0952-0607 – formerly seen only at the radio end of the spectrum – now has been found to pulse also in gamma rays.

J0952-0607 – the number relates to the object’s position in the sky – was first discovered in 2017. It was originally seen to pulse in radio waves, but not gamma rays. The international team that studied it in detail – and recently published new work about it in the peer-reviewed Astrophysical Journal – said in a statement:

The pulsar rotates 707 times in a single second and is therefore the fastest spinning in our galaxy outside the dense stellar environments of globular clusters.

Shell of expanding gas with a star in the center.

Artist’s concept of a supernova remnant with a neutron star at its heart. Neutron stars are born in supernovae. As the outer parts of the star explode outward, the inner part of the star implode. The constituent parts of ordinary atoms – electrons and protons – are crushed together by gravity to form neutrons. Want to know more about neutron stars? Try this explainer, from The Conversation. Image via ESA.

The astronomers said this pulsar is orbiting the common center of mass in 6.2 hours with a companion star. The companion is extremely lightweight, with a mass of only one-fiftieth that of our sun. The companion star may be tidally locked to the pulsar, just as Earth’s moon is tidally locked to Earth so that one side of the moon always faces Earth. If one side of the companion star always faces the pulsar, that side of the star would be heated by the pulsar’s gamma radiation. The astronomers said they think they are seeing the companion’s hot “day” side and cooler “night” side vary in brightness and color as the companion star and the pulsar orbit their common center of mass.

These details were made possible because, in this new study, the astronomers analyzed a lot of data about this pulsar and its companion. They used 8.5 years worth of data from NASA’s Fermi Gamma-ray Space Telescope, two years of LOFAR radio observations, plus observations from two large optical telescopes, and gravitational-wave data from the LIGO detectors. The lead author of the new research is Lars Nieder, a PhD student at the Albert Einstein Center (Max Planck Institute) in Hannover. Data analyses is one of his special areas of study. He commented:

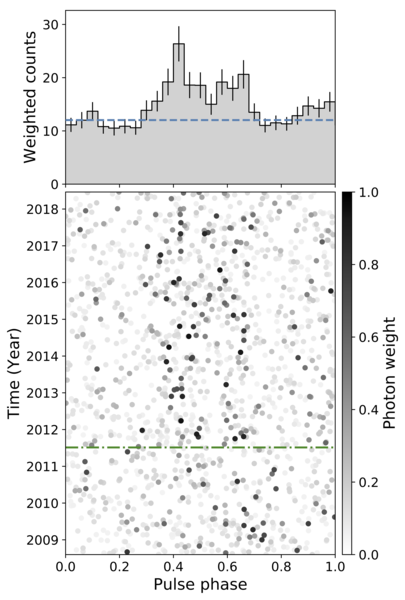
This search is extremely challenging because the Fermi gamma-ray telescope only registered the equivalent of about 200 gamma rays from the faint pulsar over the 8.5 years of observations. During this time the pulsar itself rotated 220 billion times. In other words, only once in every billion rotations was a gamma ray observed!

For each of these gamma rays, the search must identify exactly when during each of the 1.4 millisecond rotations it was emitted.

Clean-cut, blond man in a white T-shirt.

Lars Nieder – a PhD student in astrophysics at the Albert Einstein Institue Hannover – led the new research on PSR J0952-0607. Image via Max Planck.

According to these astronomers’ statement:

This requires combing through the data with very fine resolution in order not to miss any possible signals. The computing power required is enormous. The very sensitive search for faint gamma-ray pulsations would have taken 24 years to complete on a single computer core. By using the Atlas computer cluster at the AEI Hannover it finished in just 2 days.

The astronomers said they found surprises in the data. They were surprised, for example, to find no gamma-ray pulsations before July 2011. They said:

The reason for why the pulsar only seems to show pulsations after that date is unknown. Variations in how much gamma rays it emitted might be one reason, but the pulsar is so faint that it was not possible to test this hypothesis with sufficient accuracy. Changes in the pulsar orbit seen in similar systems might also offer an explanation, but there was not even a hint in the data that this was happening.

For now, the lack of gamma-ray pulsations before 2011 is a mystery.

Smiling, middle-aged man in glasses.

Bruce Allen is director of the Albert Einstein Institue Hannover and Nieder’s PhD supervisor. Image via Max Planck.

The astronomers commented that rapidly spinning pulsars like J0952-0607 are probes of extreme physics. They said:

How fast neutron stars can spin before they break apart from centrifugal forces is unknown and depends on unknown nuclear physics. Millisecond pulsars like J0952-0607 are rotating so rapidly because they have been spun up by accreting matter from their companion. This process is thought to bury the pulsar’s magnetic field. With the long-term gamma-ray observations, the research team showed that J0952-0607 has one of the ten lowest magnetic fields ever measured for a pulsar, consistent with expectations from theory.

Bruce Allen, Nieder’s PhD supervisor and director at the Albert Einstein Institue Hannover, added:

We will keep studying this system with gamma-ray, radio, and optical observatories since there are still unanswered questions about it. This discovery also shows once more that extreme pulsar systems are hiding in the Fermi LAT catalogue.

We are also employing our citizen science distributed computing project Einstein@Home to look for binary gamma-ray pulsar systems in other Fermi LAT sources and are confident to make more exciting discoveries in the future.

Technical-looking illustration; includes both graphs and data points.

The pulse profile (distribution of gamma-ray photons during one rotation of the pulsar) of J0952-0607 is shown at the top. Below is the corresponding distribution of the individual photons over the 10 years of observations. The greyscale shows the probability (photon weights) for individual photons to originate from the pulsar. From mid 2011 on, the photons line up along tracks corresponding to the pulse profile. This shows the detection of gamma-ray pulsations, which is not possible before mid 2011. Image via L. Nieder/ Max Planck Institute for Gravitational Physics.

Bottom line: PSR J0952-0607 is spinning 707 times a second, making it the 2nd-fastest pulsar known and the fastest pulsar outside globular clusters. Astronomers just discovered this pulsar is emitting high-energy gamma rays.

Source: Detection and Timing of Gamma-Ray Pulsations from the 707 Hz Pulsar J0952?0607

Via Max Planck Institute for Gravitational Physics


from EarthSky https://ift.tt/32U6CVu

Equinox sun is over Earth’s equator

The illustration at top by Tau’olunga via Wikimedia Commons shows the day arc of the sun, every hour – during the equinoxes – as seen on the celestial dome – from the equator. Also showing twilight suns down to -18° altitude. Note the sun at the zenith at noon and that the tree’s shadow is cast straight down. That is – as seen from the equator on the day of an equinox – a tree stands in the center of its own shadow.

The 2019 autumnal equinox for the Northern Hemisphere (spring equinox for the Southern Hemisphere) happens on Monday, September 23, at 7:50 UTC. At this special moment – the instant of the September equinox – the sun is at zenith, or straight overhead, as seen from Earth’s equator.

That’s the meaning of an equinox. The September equinox sun crosses the sky’s equator, going from north to south.

Donate: Your support means the world to us

Earth as

Who will see the sun exactly overhead at this equinox? If you were on the sun at the equinox instant (September 23 at 7:50 UTC), you’d be gazing toward the hemisphere of Earth shown in this simulated image. Looks like you’d have to be on a ship in the Indian Ocean, some 25 degrees south of Chabahar, Iran, to see the sun exactly directly overhead at noon at the exact moment of this equinox. No matter. Everyone along Earth’s equator on the day of the equinox – and for a day or two before and after it – will experience the noonday sun more or less overhead. Image via Fourmilab.

Although the equinox happens at the same instant for everyone worldwide, the clock time for the equinox varies by time zone. In the U.S., the local clock time for the September equinox will be Monday, September 23, at 3:50 a.m. EDT, 2:50 a.m. CDT, 1:50 a.m. MDT and 12:50 a.m. PDT.

On the day of the equinox, the sun pretty much rises due east and sets due west all over the world, with everyone worldwide receiving approximately equal portions of day and night.

When October comes rolling around, that’ll change dramatically. By then, the sun will rise noticeably south of due east and will set noticeably south of due west. That’ll mean shorter days and longer nights for the Northern Hemisphere, and longer days and shorter nights in the Southern Hemisphere.

After the equinox, the sun (and migrating birds) will continue to travel southward to the southern climes. Arctic sea ice will begin to freeze; Antarctic ice will start melting. The great wheel of the seasons will continue to turn.

How to celebrate?

Try to watch as the sun rises due east and sets due west on the day of the equinox. If you do that from your backyard, or deck, or a local park – somewhere that you have familiar landmarks – you’ll gain a handy tool for astronomy: that is, the tool of knowing the direction due east.

Bottom line: Around the equinox, the sun is overhead at noon for people at Earth’s equator.

The lunar calendars are here! View the moon phases throughout the year.

Read more: Everything you need to know about the September equinox 2019


from EarthSky https://ift.tt/2AEQ2Nn