Two fogbows

Fogbows are rainbows’ cousins – made by much the same process – but with the small water droplets inside a fog instead of larger raindrops. Look for fogbows in a thin fog when the sun is bright. You might see one when the sun breaks through a fog.

White arch against a dark blue sky.

Allen Carr captured this fogbow over Yellowstone Park’s White Dome Geyser on September 12, 2019..

White arch against blue background.

Fogbow and Orion, early on the morning of September 13, 2019, by Photography of the Eternal Nomad.


from EarthSky https://ift.tt/2V3gVUA

Tonight, find the Andromeda galaxy

Tonight, since the moon is waning and gone from the sky in early evening, find the Andromeda galaxy, the great spiral galaxy next door to our Milky Way. It’s the most distant thing you can see with your eye alone. It’s best seen in the evening at this time of year, assuming you’re in the Northern Hemisphere. Most people find the galaxy by star-hopping from the constellation Cassiopeia, which is a very noticeable M- or W-shaped pattern on the sky’s dome. I learned to find the Andromeda galaxy by star-hopping from the Great Square of Pegasus, to the two graceful streams of stars making up the constellation Andromeda.

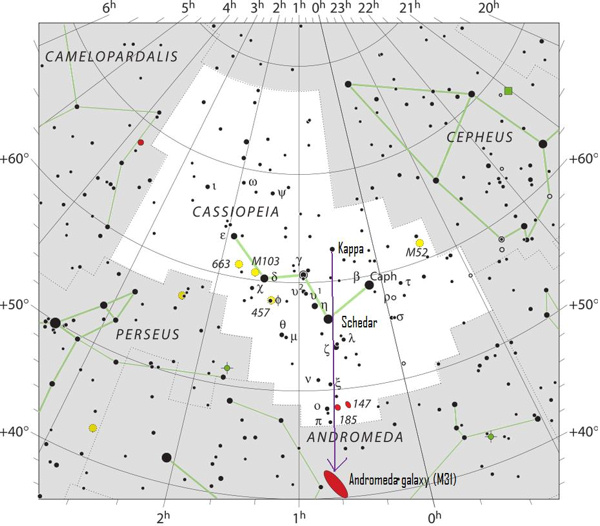
Look at the chart at the top of this post. It shows both constellations – Cassiopeia and Andromeda – so you can see the galaxy’s location with respect to both. Notice the star Schedar in Cassiopeia. It’s the constellation’s brightest star, and it points to the galaxy.

Star chart, black stars on white, of constellation Andromeda.

Draw an imaginary line from the star Kappa Cassiopeiae (abbreviated Kappa) through the star Schedar, then go about 3 times the Kappa-Schedar distance to locate the Andromeda galaxy (Messier 31). For another view, click here .

Now let’s take a closer look at the other way to find this galaxy:

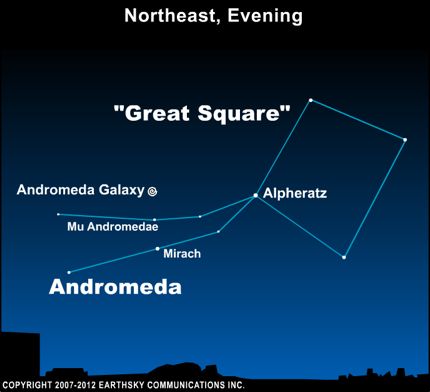
Star chart with Great Square and Andromeda constellations and Andromeda galaxy marked.

Use the Great Square of Pegasus to find the Andromeda galaxy. Here’s how to do it.

The large square pattern above is the Great Square in the constellation Pegasus. The constellation Andromeda can be seen as two streams of stars extending from one side of the Square, beginning at the star Alpheratz.

Notice Mirach, then Mu Andromedae. An imaginary line drawn through these two stars points to the Andromeda galaxy.

Just be aware – bright moonlight or city lights can overwhelm the faint glow of this object. The single most important thing you need to see the galaxy is a very dark sky.

What does the galaxy look like to the eye? Assuming you have a dark sky, it appears as a large fuzzy patch – bigger than a full moon in the sky – but vastly fainter and more subtle.

The lunar calendars are almost here! They’ll show you the moon phases throughout 2020. Watch for them. Supplies will be limited.

Dense star field containing oblong light streak with bright center, above sihouetted pine trees.

View larger. | The Andromeda galaxy (upper right of photo) as seen by EarthSky Facebook friend Ted Van at a Montana campsite in mid-August. Thank you, Ted!

For binocular astronomers: Binoculars, as always, enhance the view. Binoculars are an excellent choice for beginners to observe the Andromeda galaxy, because they are so easy to point. As you stand beneath a dark sky, locate the galaxy with your eye first, then slowly bring the binoculars up to your eyes so that the galaxy comes into binocular view. If that doesn’t work for you, try sweeping the area with your binoculars. Go slowly, and be sure your eyes are dark-adapted. The galaxy will appear as a fuzzy patch to the eye. It’ll appear brighter in binoculars. Can you see that its central region is more concentrated?

With the eye, or with binoculars, or even with a backyard telescope, the Andromeda galaxy won’t look like the image below. But it will be beautiful. It’ll take your breath away.

Oblique view of spiral galaxy in false color.

Image of the Andromeda galaxy captured by NASA's Wide-field Infrared Survey Explorer. Image via NASA/JPL-Caltech/UCLA

One of you wrote:

I’ve heard that the Andromeda galaxy will someday collide with our galaxy! Is that still a definite possibility?

Definite possibility describes much of what we know – or think we know – about the universe. As for the Andromeda galaxy and its future collision with our Milky Way: the first attempt to measure the radial velocity of this galaxy (its motion forward or back, along our line of sight) was made in 1912. After that, astronomers believed for some decades that the galaxy was approaching at nearly 200 miles per second (300 km/s), but later astronomers disagreed.

Then in May 2012, NASA astronomers announced they can now predict the time of this collision of titan galaxies with certainty. Remember, though, that the Andromeda Galaxy is 2.2 million light-years away, with a single light-year being almost 10 trillion kilometers (6 trillion miles). So although it does appear that this galaxy is approaching our Milky Way galaxy … it’s nothing to lose sleep over. When will they collide? According to NASA astronomers in 2012, it’ll be four billion years from now.

Read more: Will the Milky Way and Andromeda galaxies collide someday?

Plus when galaxies collide, they don’t exactly destroy each other. Because there’s so much more space than stars in our universe, colliding galaxies pass through each other, like ghosts.

But colliding galaxies do interact. Check out this cool video: Night sky as Milky Way and Andromeda galaxies merge.

Bottom line: The Andromeda galaxy, aka M31, will be visible on dark, moonless evenings from now until the beginning of spring. This post tells you how to use the constellations Cassiopeia and Pegasus to find it. Be sure you’re looking on a moonless night, far from city lights. This galaxy is approaching our Milky Way galaxy, across the vastness of space. Astronomers say that – four billion years from now – our two galaxies will collide.

Donate: Your support means the world to us


from EarthSky https://ift.tt/2CIsqcS

Moon, Aldebaran, Pleiades before bedtime

Late at night on September 19 and 20, 2019, watch as the waning gibbous moon sweeps in front of the constellation Taurus the Bull. You’ll be looking around midnight, or afterwards, or – if you’re not one to stay up late – get up before daybreak to view the moon and Taurus higher up in the sky on the mornings of September 20 or 21. The bright moon might make it tough to see the starlit figure of the Bull on these nights. But you should be able to make out Aldebaran, Taurus’ brightest star, as well as the tiny, misty, dipper-shaped Pleiades star cluster.

Then, when the moon moves away, look for the V-shaped Face of the Bull itself. The bright star Aldebaran marks one tip of the V.

Taurus is a far-northern constellation of the zodiac. That fact causes these stars to rise at an earlier hour in the Northern Hemisphere than in the Southern Hemisphere. The farther north you live, the earlier Taurus climbs above your northeast horizon. The farther south you live, the later Taurus comes up.

Want to see your specific sky view? Try Stellarium online

Or visit Sunrise Sunset Calendars, being sure to check the moonrise and moonset box, to find out when the moon rises into your sky.

Or see the U.S. Naval Observatory site and check Aldebaran as your celestial object of interest to find out when Aldebaran rises into your sky.

Antique etching of fierce bull with curved horns and stars shown.

Taurus the Bull via Urania’s Mirror/© Ian Ridpath.

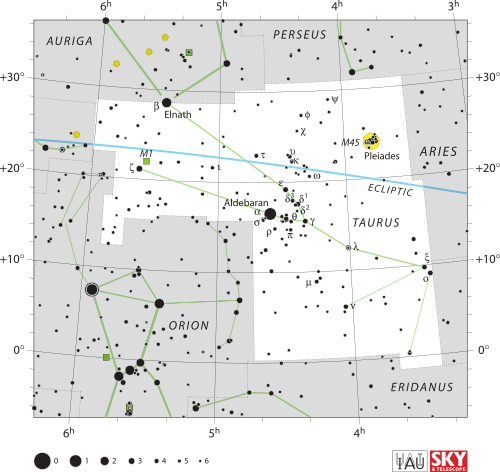
Star chart of constellation Taurus with Aldebaran and Pleiades marked prominently.

The ecliptic – the sun’s yearly path through the constellations of the Zodiac – passes through the constellation Taurus the Bull, to the north of the star Aldebaran and to the south of the Pleiades star cluster. The sun shines in front of Taurus from about May 14 to June 21, every year.

When the moon travels in front of Taurus (or any constellation of the zodiac, for that matter), the moon can travel anywhere from 5 degrees north to 5 degrees south of the ecliptic. For the next several years, the moon will remain south of the ecliptic in its monthly travels in front of Taurus the Bull.

A little over a year ago – on September 3, 2018 – the moon occulted (passed in front of) Aldebaran, presenting the final occultation of a monthly occultation series that started on January 29, 2015. But month by month, and year by year, the moon’s trajectory will slowly but surely shift northward as it goes through Taurus the Bull. In fact, for the next 15 years, the moon will be sweeping to the north of Aldebaran and to the south of Alcyone, the Pleiades’ brightest star.

The monthly occultation series involving the moon and the Pleiades star Alcyone will take place from September 5, 2023, till July 7, 2029.

Sky diagram with arrow pointing from Orion to Aldebaran and the Pleiades.

When the moon moves away, try this. The 3 stars of Orion’s Belt always point to the star Aldebaran and the Pleiades star cluster. Image via Janne/Flickr.

The Skidi Pawnee in the American Great Plains (Nebraska) used the Pleiades cluster as a calendar marker. When they saw the Pleiades cluster through the smoke holes of their lodges just before dawn, they knew it was time to harvest the crops.

Bottom line: Before bedtime on September 19 and 20, 2019, look eastward for the moon, which shines in front of the constellation Taurus the Bull.


from EarthSky https://ift.tt/2M1Icmj

Summer 2019 tied for hottest on record for Northern Hemisphere

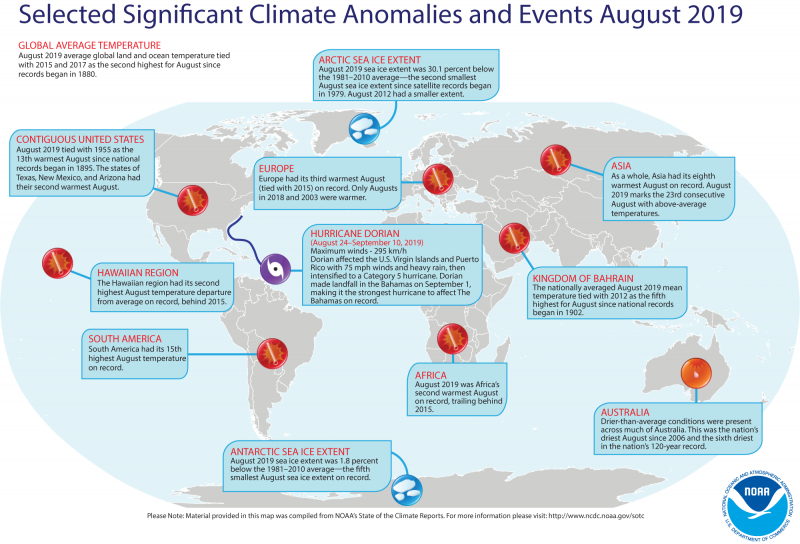
View larger.| Selected, significant climate anomalies and events, August, 2019. Scorching temps around the world made August 2019 as 2nd-hottest August on record, tied with 2015 and 2017. For details, see the short bulleted list below in our story. Image via NOAA.

According to NOAA report, released September 16, the 2019 Northern Hemisphere meteorological summer (June through August), is the hottest on in the 140-year climate record, tied with 2016. The 2019 Northern Hemisphere land and ocean surface temperatures for the period were 2.03 degrees F (1.13 degrees C) above average.

Meanwhile, June-August is the Southern Hemisphere’s winter, and this year’s Southern Hemisphere winter was tied with 2015 as the planet’s second hottest, after 2016, at 1.33 degrees F (.74 degrees C) above the 20th-century average. The last five June-August periods are the five hottest on record.

For the planet as a whole, NOAA reported that the period from January-August produced a global temperature that was 1.69 degrees F (.94 degrees C) above the 20th-century average of 57.3 degrees F (14.06 degrees C), making it the third hottest January-August period on record, after 2016 and 2017. The five warmest June–August periods have occurred in the last five years.

The global land and ocean surface temperature for the three-month season has increased at an average rate of .13 degrees F (.07 degrees C) per decade since 1880, according to NOAA, But since 1981, the average rate of increase is more than twice as great, at .32 degrees F (.18 degrees C) per decade.

NOAA said that the most notable warm temperature departures from average during June–August 2019 happened across much of the high latitudes in the Northern Hemisphere, specifically across the North Pacific Ocean, the Bering Sea, western Alaska, northern Canada, central Europe and north-central Russia. And Africa had its warmest June–August on record. No land or ocean areas had a record-cold June–August 2019 temperature.

See the full report

View larger. | Image via NOAA.

Bottom line: NOAA reports that the 2019 Northern Hemisphere summer (June-August) was the hottest in the 140-year climate record.

Via NOAA


from EarthSky https://ift.tt/34ZiaJ9

Did an asteroid collision cause an ice age on Earth?

Two asteroids crashing into each other and disintegrating.

Artist’s concept of the collision between 2 asteroids – some 460 million years ago – that created enough dust to cause an ice age on Earth. Image via Don Davis/Southwest Research Institute/EurekAlert.

Some 460 million years ago, Earth was a frozen world, caught in the grip of a global ice age. For a long time, scientists have been trying to figure what caused this ice age, which occurred in what they call the Ordovician period, and which coincided with a major mass extinction of nearly 61% of marine life. Now they think they may finally know. A new study – announced on September 18, 2019, by the Field Museum in Chicago – suggests the ice age resulted from a collision between two asteroids, not onto Earth, but with each other, in outer space. The collision may have caused much more dust than usual to enter Earth’s atmosphere. The influx of dust may have caused a global cooling that turned Earth into a colder, icier world.

These peer-reviewed results were published on September 18 in the journal Science Advances.

 Philipp Heck is one of the paper’s authors and a curator at the Field Museum. He explained in a statement:

Normally, Earth gains about 40,000 tons of extraterrestrial material every year. Imagine multiplying that by a factor of a thousand or ten thousand. Our hypothesis is that the large amounts of extraterrestrial dust over a timeframe of at least two million years played an important role in changing the climate on Earth, contributing to cooling.

Lead author of the research, Birger Schmitz, also at the Field Museum, added:

Our results show for the first time that such dust, at times, has cooled Earth dramatically. Our studies can give a more detailed, empirical-based understanding of how this works, and this in turn can be used to evaluate if model simulations are realistic.

Labeled layers in a vertical stone roadcut in a hillside.

The mid-Ordovician Hällekis section in sedimentary rock in southern Sweden, where the dust samples were found. The time of the asteroid collision/dust impact is represented by the red line. Image via Birger Schmitz/Lund University/Science Advances.

According to these scientists, the greatly increased amount of dust entering Earth’s atmosphere upset the climate balance enough to cause a new ice age, even if it took a couple million years to do it. In the collision, the study concludes, a 93-mile-wide asteroid broke apart somewhere between Mars and Jupiter. That was still close enough for much more dust then normal to enter Earth’s atmosphere.

It’s a fascinating hypothesis, but how did the scientists reach this conclusion?

They looked at samples from a place on Earth that is still pretty much frozen year-round: Antarctica. Micrometeorites from Antarctica, which are common, were compared to other 466-million-year-old rocks from sedimentary layers – the mid-Ordovician Hällekis section – in southern Sweden. According to Heck:

We studied extraterrestrial matter, meteorites and micrometeorites, in the sedimentary record of Earth, meaning rocks that were once sea floor. And then we extracted the extraterrestrial matter to discover what it was and where it came from.

Meteorite embedded in stone with fossilized long straight chambered shell above it.

A 466-million-year-old fossil meteorite, thought to have been created in the same asteroid collision that caused enough dust to create an ice age. The fossil of a squid-like creature called a nautiloid can also be seen along the top. Image via Field Museum/John Weinstein/EurekAlert.

In order to retrieve the space dust from the rocks, the research team used special acid to erode the rock and leave behind the dust particles, which were then analyzed. Then, rock samples from the ancient sea floor were also examined; the scientists wanted to find elements and isotopes that they could identify as having originated from space. As an example, helium atoms on Earth have two protons, two neutrons and two electrons. But, helium atoms that come from the sun are missing one neutron. Since those kinds of helium atoms, as well as traces of rare metals found in asteroids, were found in the 466-million-year-old rocks, that showed that the dust came from space.

It was already known that there was an ice age at this time, and the new study shows that the timing of it coincided with the extra dust in the atmosphere. As Schmitz said:

The timing appears to be perfect.

The researchers also found other evidence that some of Earth’s water at the time was trapped in glaciers and sea ice, since the analysis of the rocks indicated that the oceans were shallower at this time. All of this together is evidence that the increased dust in the atmosphere created a global cooling and ultimately an ice age.

Microscopic view of a cross-section of a micrometeorite with dark and light gray patches.

A chromite grain (light gray) from a micrometeorite in Antarctica. The grain was not included in the present study but is used here to illustrate the distribution of such relict grains in micrometeorites. Image via ScienceAdvances.

It’s a good thing that the cooling process was gradual, as that allowed much of earthly life to adapt to the changing conditions. According to Heck:

In the global cooling we studied, we’re talking about timescales of millions of years. It’s very different from the climate change caused by the meteorite 65 million years ago that killed the dinosaurs, and it’s different from the global warming today – this global cooling was a gentle nudge. There was less stress.

The researchers also noted that it might be tempting to think that dust like this might be a good way to combat climate change. But Heck urges caution even though it’s an idea worth studying:

Geoengineering proposals should be evaluated very critically and very carefully, because if something goes wrong, things could become worse than before. We’re experiencing global warming, it’s undeniable. And we need to think about how we can prevent catastrophic consequences, or minimize them. Any idea that’s reasonable should be explored.

The results of this study provide valuable insight into how a global ice age started millions of years ago – from an asteroid collision in deep space – and may even assist scientists in determining ways to mitigate current climate change.

Ice covering North America.

Some 460 million years ago, Earth was in the grip of a global ice age like the one in this artist’s concept. The new study suggests it was caused by dust from a collision between 2 asteroids. Image via NASA/Gizmodo.

Bottom line: A global ice age 466 million years ago was caused by dust from a collision between two asteroids, a new study suggests.

Source: An extraterrestrial trigger for the mid-Ordovician ice age: Dust from the breakup of the L-chondrite parent body

Via Field Museum


from EarthSky https://ift.tt/30q0sLa

DNA 'origami' takes flight in emerging field of nano machines

DNA nanotechnology, nicknamed DNA origami after the traditional Japanese paper craft, is moving from a nanoscale novelty to a practical research tool. Emory chemists Khalid Salaita and Aaron Blanchard wrote about this emerging field for the journal Science. (Getty Images)

By Carol Clark

Just as the steam engine set the stage for the Industrial Revolution, and micro transistors sparked the digital age, nanoscale devices made from DNA are opening up a new era in bio-medical research and materials science.

The journal Science describes the emerging uses of DNA mechanical devices in a “Perspective” article by Khalid Salaita, a professor of chemistry at Emory University, and Aaron Blanchard, a graduate student in the Wallace H. Coulter Department of Biomedical Engineering, a joint program of Georgia Institute of Technology and Emory.

The article heralds a new field, which Blanchard dubbed “DNA mechanotechnology,” to engineer DNA machines that generate, transmit and sense mechanical forces at the nanoscale.

“For a long time,” Salaita says, “scientists have been good at making micro devices, hundreds of times smaller than the width of a human hair. It’s been more challenging to make functional nano devices, thousands of times smaller than that. But using DNA as the component parts is making it possible to build extremely elaborate nano devices because the DNA parts self-assemble.”

"DNA mechanotechnology expands the opportunities for research involving biomedicine and materials science," Salaita says. (Graphic by Salaita Lab)

DNA, or deoxyribonucleic acid, stores and transmits genetic information as a code made up of four chemical bases: adenine (A), guanine (G), cytosine (C) and thymine (T). The DNA bases have a natural affinity to pair up with each other — A with T and C with G. Synthetic strands of DNA can be combined with natural DNA strands from bacteriophages. By moving around the sequence of letters on the strands, researchers can get the DNA strands to bind together in ways that create different shapes. The stiffness of DNA strands can also easily be adjusted, so they remain straight as a piece of dry spaghetti or bend and coil like boiled spaghetti.

The idea of using DNA as a construction material goes back to the 1980s, when biochemist Nadrian Seeman pioneered DNA nanotechnology. This field uses strands DNA to make functional devices at the nanoscale. The ability to make these precise, three-dimensional structures began as a novelty, nicknamed DNA origami, resulting in objects such as a microscopic map of the world and, more recently, the tiniest-ever game of tic-tac-toe, played on a DNA board.

Work on novelty objects continues to provide new insights into the mechanical properties of DNA. These insights are driving the ability to make DNA machines that generate, transmit and sense mechanical forces.

“If you put together these three main components of mechanical devices, you begin to get hammers and cogs and wheels and you can start building nano machines,” Salaita says. “DNA mechanotechnology expands the opportunities for research involving biomedicine and materials science. It’s like discovering a new continent and opening up fresh territory to explore.”

Watch a video about how DNA machines work


Potential uses for such devices include drug delivery devices in the form of nano capsules that open up when they reach a target site, nano computers and nano robots working on nanoscale assembly lines.

The use of DNA self-assembly by the genomics industry, for biomedical research and diagnostics, is further propelling DNA mechanotechnology, making DNA synthesis inexpensive and readily available. “Potentially anyone can dream up a nano-machine design and make it a reality,” Salaita says.

He gives the example of creating a pair of nano scissors. “You know that you need two rigid rods and that they need to be linked by a pivot mechanism,” he says. “By tinkering with some open-source software, you can create this design and then go onto a computer and place an order to custom synthesize your design. You’ll receive your order in a tube. You simply put the tube contents into a solution, let your device self-assemble, and then use a microscope to see if it works the way you thought that it would.”

The Salaita Lab is one of only about 100 around the world working at the forefront of DNA mechanotechnology. He and Blanchard developed the world’s strongest synthetic DNA-based motor, which was recently reported in Nano Letters.

A key focus of Salaita’s research is mapping and measuring how cells push and pull to learn more about the mechanical forces involved in the human immune system. Salaita developed the first DNA force gauges for cells, providing the first detailed view of the mechanical forces that one molecule applies to another molecule across the entire surface of a living cell. Mapping such forces may help to diagnose and treat diseases related to cellular mechanics. Cancer cells, for instance, move differently from normal cells, and it is unclear whether that difference is a cause or an effect of the disease.

Watch a video about the Salaita Lab's work with T cells


In 2016, Salaita used these DNA force gauges to provide the first direct evidence for the mechanical forces of T cells, the security guards of the immune system. His lab showed how T cells use a kind of mechanical “handshake” or tug to test whether a cell they encounter is a friend or foe. These mechanical tugs are central to a T cell’s decision for whether to mount an immune response.

“Your blood contains millions of different types of T cells, and each T cell is evolved to detect a certain pathogen or foreign agent,” Salaita explains. “T cells are constantly sampling cells throughout your body using these mechanical tugs. They bind and pull on proteins on a cell’s surface and, if the bond is strong, that’s a signal that the T cell has found a foreign agent.”

Salaita’s lab built on this discovery in a paper recently published in the Proceedings of the National Academy of Sciences (PNAS). Work led by Emory chemistry graduate student Rong Ma refined the sensitivity of the DNA force gauges. Not only can they detect these mechanical tugs at a force so slight that it is nearly one-billionth the weight of a paperclip, they can also capture evidence of tugs as brief as the blink of an eye.

The research provides an unprecedented look at the mechanical forces involved in the immune system. “We showed that, in addition to being evolved to detect certain foreign agents, T cells will also apply very brief mechanical tugs to foreign agents that are a near match,” Salaita says. “The frequency and duration of the tug depends on how closely the foreign agent is matched to the T cell receptor.”

The result provides a tool to predict how strong of an immune response a T cell will mount. “We hope this tool may eventually be used to fine tune immunotherapies for individual cancer patients,” Salaita says. “It could potentially help engineer T cells to go after particular cancer cells.”

Related:
Nano-walkers take speedy leap forward with first rolling DNA-based motor
T cells use 'handshakes' to sort friends from foes 
New methods reveal the mechanics of blood clotting 
Chemists reveal the force within you

from eScienceCommons https://ift.tt/2O9bEcO

No, asteroid 2007 FT3 won’t hit Earth in October

Diagram of solar system with long elliptical orbit at an angle to the other orbits.

This illustration shows the positions of Earth and asteroid 2007 FT3 on October 3, 2019. Note the space rock’s orbit (not the object itself) does come close to the orbit of the Earth. Image via NASA/JPL.

Asteroid 2007 FT3 – a 1,115-foot (340-meter) space rock – is appearing in doomsday headlines suggesting the asteroid could hit our planet on October 3, 2019. Here’s an example: Deadly 1,100-Foot Asteroid Could Hit Earth In October, NASA Reveals. Sounds scary, right? But is it true? Is this asteroid really deadly? It’s only deadly if it kills something, and that’s not going to happen. Asteroid 2007 FT3 is not going to hit us. Of course, NASA knows that. What’s going on here? Why does the headline say NASA reveals?

The truth is, asteroid 2007 FT3 is likely pass Earth at such an extreme distance that even big professional telescopes at major observatories won’t be able to detect it this October. How far will it be at its closest distance? Preliminary estimates indicate asteroid 2007 FT3 will pass on October, 2019 at almost 360 times the Earth-moon distance. That’s many millions of miles, an enormous distance!

Asteroid 2007 FT3 was discovered on March 20, 2007 from Mount Lemmon, in Arizona. It was observed only briefly – just 14 times over 1.2 days – and then became too faint to observe, disappearing back into the depths of space. Because it was observed for such a short time, there are uncertainties in its orbit. Those sorts of uncertainties for a newly observed, or briefly observed, asteroid are very, very normal and ordinary. They’re just part of the process.

Because of the uncertainties, however, 2007 FT3 does appear in a “risk list” maintained by astronomers at the Center for Near Earth Object Studies (CNEOS) at NASA’s Jet Propulsion Laboratory in Pasadena, California. The Sentry Risk Table is part of a highly automated collision monitoring system that continually scans the most current asteroid catalog for possibilities of future impact with Earth over the next 100 years. Asteroid 2007 FT3 does appear on the current Sentry Risk Table (although objects are removed from this table as their orbits become better known).

But being in a “risk table” doesn’t mean there’s actual risk. Look at the table carefully. Click into the numbers in the column labeled Impact Probability (Cumulative). You’ll see that 2007 FT3 has an extremely low chance of impacting Earth in October:

0.00015% chance of Earth impact
1 in 670,000 odds of impact
99.99985% chance the asteroid will miss the Earth

Let’s linger on the Sentry Risk Table a little longer. CNEOS, which maintains this table, explains on its website:

When interpreting Sentry pages, where information on known potential NEA [Near-Earth Asteroid] impacts is posted, one must bear in mind that an Earth collision by a sizable NEA is a very low probability event. Objects normally appear on the Risk Page because their orbits can bring them close to the Earth’s orbit and the limited number of available observations do not yet allow their trajectories to be well-enough defined. In such cases, there may be a wide range of possible future paths that can be fit to the existing observations, sometimes including a few that can intersect the Earth.

Whenever a newly discovered NEA is posted on the Sentry Impact Risk Page, by far the most likely outcome is that the object will eventually be removed as new observations become available, the object’s orbit is improved, and its future motion is more tightly constrained. As a result, several new NEAs each month may be listed on the Sentry Impact Risk page, only to be removed shortly afterwards. This is a normal process, completely expected. The removal of an object from the Impact Risk page does not indicate that the object’s risk was evaluated mistakenly: the risk was real until additional observations showed that it was not.

And so on and so on. We encourage you to read all of this page if you want to understand the Sentry system.
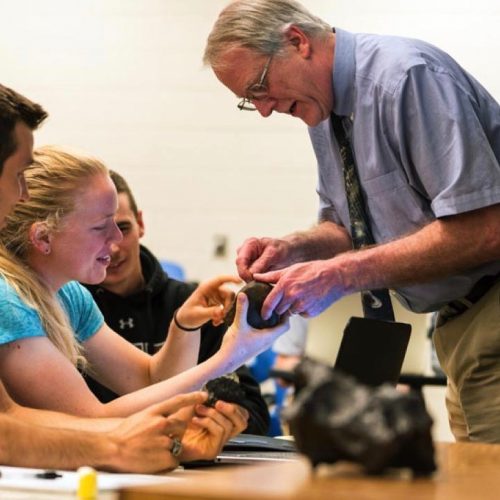
A kindly looking professor talking to students about a rock, maybe a meteorite?

This MIT professor – Richard P. Binzel – is one of the astronomers who helped develop an important tool for understanding asteroid risk and conveying it to the public: the Torino Scale. If you’re ever fearful of a particular asteroid, be sure to find out its ranking on the Torino Scale. That’ll nearly always make you feel better! Image via MIT.

Now let’s look at another important tool for understanding Near-Earth Asteroids (NEAs): the Torino Scale. It was created by astronomer Richard P. Binzel of MIT in 1995 and presented at a United Nations conference that year. CNEOS described the Torino Scale this way:

The Torino Scale, adopted by the [International Astronomical Union] in 1999, is a tool for categorizing potential Earth impact events. An integer scale ranging from 0 to 10 with associated color coding, it is intended primarily to facilitate public communication by the asteroid impact hazard monitoring community. The scale captures the likelihood and consequences of a potential impact event, but does not consider the time remaining until the potential impact. More extraordinary events are indicated by a higher Torino Scale value.

Read Richard P. Binzel’s description of the Torino Scale

Asteroid 2007 FT3 has a Torino Scale ranking of 0, which indicates:

The likelihood of a collision is zero, or is so low as to be effectively zero.

Even with the poorly constrained orbit or limited data, NASA scientists estimate that on October 3,2019, asteroid 2007 FT3 should pass at some 86 million miles (138 million km) from Earth.

2007 FT3 should be a little “closer” to Earth on October 11, 2068. During that “closer” approach, the space rock should be passing at more than 15 million miles (24.5 million km), or about 64 times the Earth-moon distance. That’s still a huge distance.

2007 FT3 is categorized as an Apollo-type asteroid. It takes 1.2 years (438 days) to complete an orbit around the Sun. Its orbit – not the object itself – does come close to the orbit of the Earth, and it is therefore considered a potentially hazardous asteroid, by CNEOS:

Potentially Hazardous Asteroids (PHAs) are currently defined based on parameters that measure the asteroid’s potential to make threatening close approaches to the Earth. Specifically, all asteroids with a minimum orbit intersection distance (MOID) of 0.05 au or less and an absolute magnitude (H) of 22.0 or less are considered PHAs.

Radar animation of 3200 Phaethon shows the asteroid tumbling in space.

We can’t see asteroids very well, because they’re small. This animation is built from Arecibo radar images of near-Earth asteroid 3200 Phaethon, acquired from December 15 through 19, 2017. Read more about these observations.

Do you see what’s going on here? In recent decades, astronomers have realized the potential for asteroids to strike Earth. That is a very real potential. The world as a whole has recognized that it’s important for a planet with 7.6 billion humans to understand the potential threat of asteroids, and to track asteroids, and even to discuss what we might do if we did learn an asteroid was heading our way. Hopefully, we would learn this some years before it happened, and not days before.

But all of this formalization of a potential threat – nomenclature, lists, acronyms – has also created a potential to create misunderstandings and fear. And, we all know, on the internet fear means clicks, and clicks mean $$.

Meanwhile, the asteroids are just out there, as they’ve been for billions of years, pursuing their orbits around the sun. If asteroid 2007 FT3 is re-observed in late September or early October, 2019, the new observations might let astronomers better refine its orbit. Then, perhaps, it’ll be removed from the Sentry Risk Table.

In the meantime, don’t worry. What you’re seeing here is just astronomy in action, and, in particular, the branch of astronomy that aims to keep us safe from asteroids. And the preliminary data – based on these astronomers’ best-possible observations and most careful orbit calculations – clearly indicate that this particular asteroid, 2007 FT3, poses no risk to our planet.
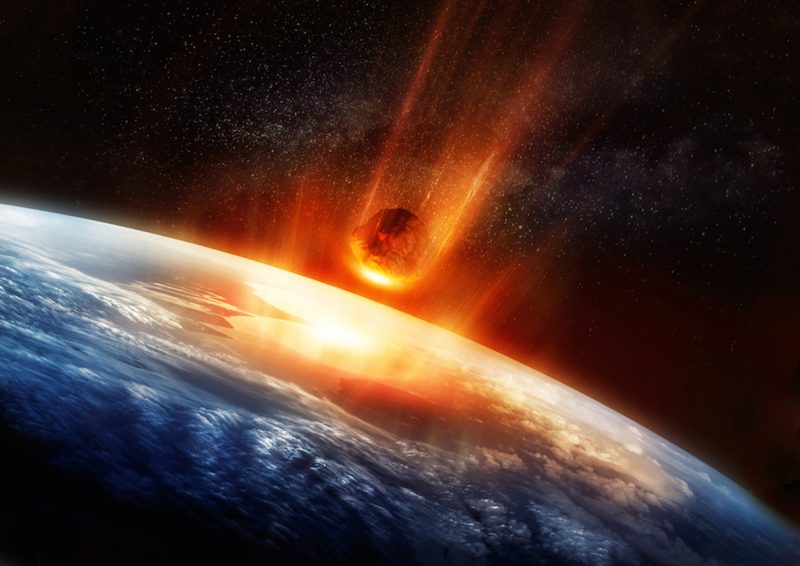
A painting of a huge flaming space rock falling to Earth.

Artist’s concept of a large asteroid hitting Earth. Has this ever happened? Sure. Large asteroids have struck Earth in the past. Large craters on Earth – for example, Meteor Crater in Arizona – bear witness to an asteroid strike. Could a large asteroid strike us in the future? It’s possible, and that’s why astronomers are so busy nowadays with asteroid tracking. But, at this writing, no large asteroid is known to be on a collision course with Earth. Image via SolarSeven/ Shutterstock.

Bottom line: Asteroid 2007 FT3 will not strike Earth on October 3, 2019.


from EarthSky https://ift.tt/309BpRd
Diagram of solar system with long elliptical orbit at an angle to the other orbits.

This illustration shows the positions of Earth and asteroid 2007 FT3 on October 3, 2019. Note the space rock’s orbit (not the object itself) does come close to the orbit of the Earth. Image via NASA/JPL.

Asteroid 2007 FT3 – a 1,115-foot (340-meter) space rock – is appearing in doomsday headlines suggesting the asteroid could hit our planet on October 3, 2019. Here’s an example: Deadly 1,100-Foot Asteroid Could Hit Earth In October, NASA Reveals. Sounds scary, right? But is it true? Is this asteroid really deadly? It’s only deadly if it kills something, and that’s not going to happen. Asteroid 2007 FT3 is not going to hit us. Of course, NASA knows that. What’s going on here? Why does the headline say NASA reveals?

The truth is, asteroid 2007 FT3 is likely pass Earth at such an extreme distance that even big professional telescopes at major observatories won’t be able to detect it this October. How far will it be at its closest distance? Preliminary estimates indicate asteroid 2007 FT3 will pass on October, 2019 at almost 360 times the Earth-moon distance. That’s many millions of miles, an enormous distance!

Asteroid 2007 FT3 was discovered on March 20, 2007 from Mount Lemmon, in Arizona. It was observed only briefly – just 14 times over 1.2 days – and then became too faint to observe, disappearing back into the depths of space. Because it was observed for such a short time, there are uncertainties in its orbit. Those sorts of uncertainties for a newly observed, or briefly observed, asteroid are very, very normal and ordinary. They’re just part of the process.

Because of the uncertainties, however, 2007 FT3 does appear in a “risk list” maintained by astronomers at the Center for Near Earth Object Studies (CNEOS) at NASA’s Jet Propulsion Laboratory in Pasadena, California. The Sentry Risk Table is part of a highly automated collision monitoring system that continually scans the most current asteroid catalog for possibilities of future impact with Earth over the next 100 years. Asteroid 2007 FT3 does appear on the current Sentry Risk Table (although objects are removed from this table as their orbits become better known).

But being in a “risk table” doesn’t mean there’s actual risk. Look at the table carefully. Click into the numbers in the column labeled Impact Probability (Cumulative). You’ll see that 2007 FT3 has an extremely low chance of impacting Earth in October:

0.00015% chance of Earth impact
1 in 670,000 odds of impact
99.99985% chance the asteroid will miss the Earth

Let’s linger on the Sentry Risk Table a little longer. CNEOS, which maintains this table, explains on its website:

When interpreting Sentry pages, where information on known potential NEA [Near-Earth Asteroid] impacts is posted, one must bear in mind that an Earth collision by a sizable NEA is a very low probability event. Objects normally appear on the Risk Page because their orbits can bring them close to the Earth’s orbit and the limited number of available observations do not yet allow their trajectories to be well-enough defined. In such cases, there may be a wide range of possible future paths that can be fit to the existing observations, sometimes including a few that can intersect the Earth.

Whenever a newly discovered NEA is posted on the Sentry Impact Risk Page, by far the most likely outcome is that the object will eventually be removed as new observations become available, the object’s orbit is improved, and its future motion is more tightly constrained. As a result, several new NEAs each month may be listed on the Sentry Impact Risk page, only to be removed shortly afterwards. This is a normal process, completely expected. The removal of an object from the Impact Risk page does not indicate that the object’s risk was evaluated mistakenly: the risk was real until additional observations showed that it was not.

And so on and so on. We encourage you to read all of this page if you want to understand the Sentry system.

A kindly looking professor talking to students about a rock, maybe a meteorite?

This MIT professor – Richard P. Binzel – is one of the astronomers who helped develop an important tool for understanding asteroid risk and conveying it to the public: the Torino Scale. If you’re ever fearful of a particular asteroid, be sure to find out its ranking on the Torino Scale. That’ll nearly always make you feel better! Image via MIT.

Now let’s look at another important tool for understanding Near-Earth Asteroids (NEAs): the Torino Scale. It was created by astronomer Richard P. Binzel of MIT in 1995 and presented at a United Nations conference that year. CNEOS described the Torino Scale this way:

The Torino Scale, adopted by the [International Astronomical Union] in 1999, is a tool for categorizing potential Earth impact events. An integer scale ranging from 0 to 10 with associated color coding, it is intended primarily to facilitate public communication by the asteroid impact hazard monitoring community. The scale captures the likelihood and consequences of a potential impact event, but does not consider the time remaining until the potential impact. More extraordinary events are indicated by a higher Torino Scale value.

Read Richard P. Binzel’s description of the Torino Scale

Asteroid 2007 FT3 has a Torino Scale ranking of 0, which indicates:

The likelihood of a collision is zero, or is so low as to be effectively zero.

Even with the poorly constrained orbit or limited data, NASA scientists estimate that on October 3,2019, asteroid 2007 FT3 should pass at some 86 million miles (138 million km) from Earth.

2007 FT3 should be a little “closer” to Earth on October 11, 2068. During that “closer” approach, the space rock should be passing at more than 15 million miles (24.5 million km), or about 64 times the Earth-moon distance. That’s still a huge distance.

2007 FT3 is categorized as an Apollo-type asteroid. It takes 1.2 years (438 days) to complete an orbit around the Sun. Its orbit – not the object itself – does come close to the orbit of the Earth, and it is therefore considered a potentially hazardous asteroid, by CNEOS:

Potentially Hazardous Asteroids (PHAs) are currently defined based on parameters that measure the asteroid’s potential to make threatening close approaches to the Earth. Specifically, all asteroids with a minimum orbit intersection distance (MOID) of 0.05 au or less and an absolute magnitude (H) of 22.0 or less are considered PHAs.

Radar animation of 3200 Phaethon shows the asteroid tumbling in space.

We can’t see asteroids very well, because they’re small. This animation is built from Arecibo radar images of near-Earth asteroid 3200 Phaethon, acquired from December 15 through 19, 2017. Read more about these observations.

Do you see what’s going on here? In recent decades, astronomers have realized the potential for asteroids to strike Earth. That is a very real potential. The world as a whole has recognized that it’s important for a planet with 7.6 billion humans to understand the potential threat of asteroids, and to track asteroids, and even to discuss what we might do if we did learn an asteroid was heading our way. Hopefully, we would learn this some years before it happened, and not days before.

But all of this formalization of a potential threat – nomenclature, lists, acronyms – has also created a potential to create misunderstandings and fear. And, we all know, on the internet fear means clicks, and clicks mean $$.

Meanwhile, the asteroids are just out there, as they’ve been for billions of years, pursuing their orbits around the sun. If asteroid 2007 FT3 is re-observed in late September or early October, 2019, the new observations might let astronomers better refine its orbit. Then, perhaps, it’ll be removed from the Sentry Risk Table.

In the meantime, don’t worry. What you’re seeing here is just astronomy in action, and, in particular, the branch of astronomy that aims to keep us safe from asteroids. And the preliminary data – based on these astronomers’ best-possible observations and most careful orbit calculations – clearly indicate that this particular asteroid, 2007 FT3, poses no risk to our planet.

A painting of a huge flaming space rock falling to Earth.

Artist’s concept of a large asteroid hitting Earth. Has this ever happened? Sure. Large asteroids have struck Earth in the past. Large craters on Earth – for example, Meteor Crater in Arizona – bear witness to an asteroid strike. Could a large asteroid strike us in the future? It’s possible, and that’s why astronomers are so busy nowadays with asteroid tracking. But, at this writing, no large asteroid is known to be on a collision course with Earth. Image via SolarSeven/ Shutterstock.

Bottom line: Asteroid 2007 FT3 will not strike Earth on October 3, 2019.


from EarthSky https://ift.tt/309BpRd