Volcanic eruption creates moveable islands of pumice

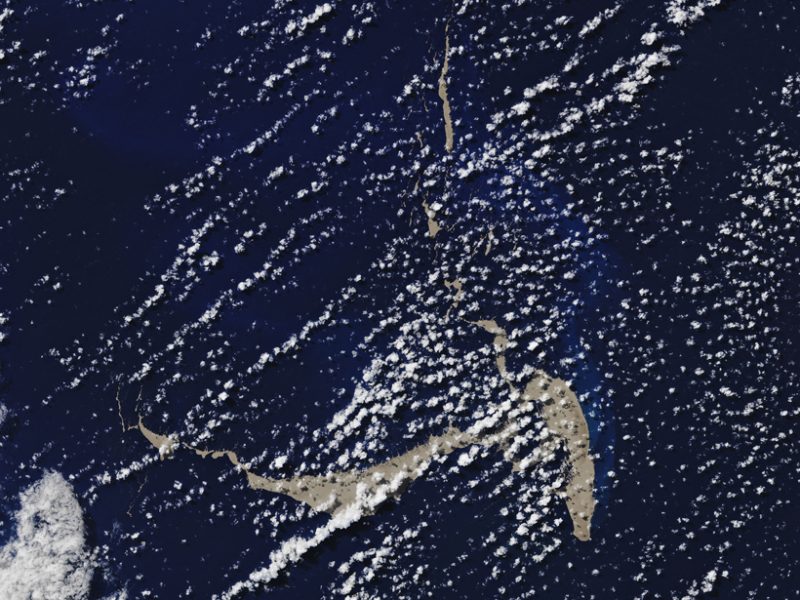
Aerial view of blue sea mottled with white dots and lines and with large tan areas (the rafts).

Satellite image of a pumice raft floating near the Kingdom of Tonga. Image via NASA Earth Observatory.

In early August 2019, an unnamed volcano in the South Pacific Ocean near the Kingdom of Tonga erupted roughly 130 feet (40 meters) underwater. As lava spewed from the volcano, it cooled into pumice — porous rock filled with gas bubbles — and floated to the surface. This volcanic debris, with some fragments tiny and some as large as beach balls, aggregated into pumice rafts spanning an area of about 60 square miles (200 square km) — almost as big as Washington, D.C.

These temporary islands of volcanic rock are shaped and moved by ocean currents, wind, and waves, and provide a literal toehold for marine life, such as barnacles, coral, seaweed and mollusks, say scientists.

Several sailing crews have encountered the rocks. In a video, below, posted on YouTube on August 17, Shannon Lenz said:

On August 9, 2019, we sailed through a pumice field for 6-8 hours, much of the time there was no visible water. It was like plowing through a field. We figured the pumice was at least 6-inches thick.

An Australian couple, Michael Hoult and Larissa Brill, were sailing a catamaran to Fiji, when they encountered the raft on August 16. The couple said in a Facebook post:

We entered a total rock rubble slick made up of pumice stones from marble to basketball size.

Pumice rafts aren’t that common, according to Martin Jutzeler, a volcanologist at the University of Tasmania in Hobart. He told EOS:

We see about two per decade.

Jutzeler told EOS that not all undersea eruptions produce them, but the rafts that do form tend to stick around. They can last for months or years until the pumice abrades itself into dust or finally sinks. And floating pumice can traverse long distances. For example, he said, when the same unnamed volcano near Tonga erupted in 2001, the pumice raft it created eventually arrived in Queensland, Australia.
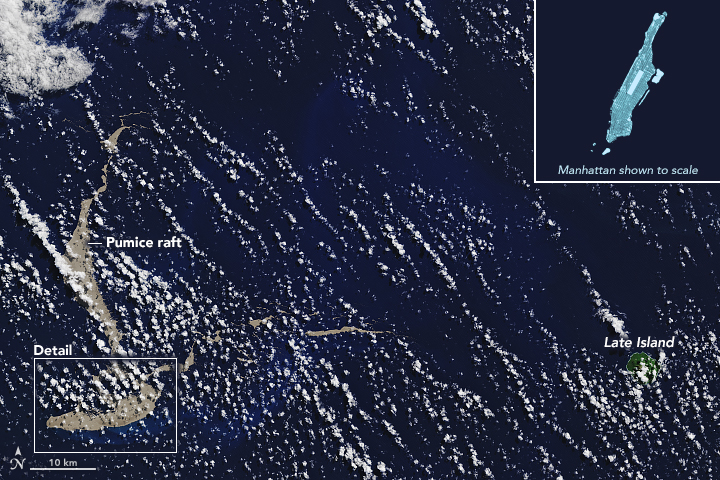
Aerial view sea with large tan areas and inset showing Manhattan Island for scale.

August 13, 2109. See detail below. Image via NASA Earth Observatory.
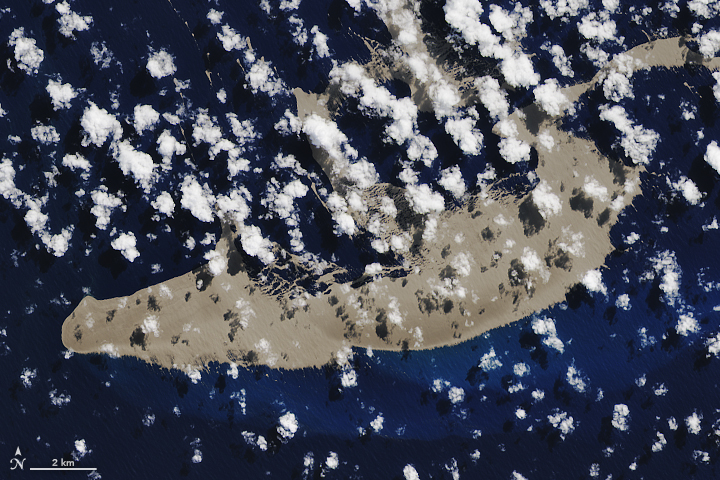
Aarial view, blue sea, scattered white clouds, tan raft nearly filling image.

Detail of above image, taken August 13, 2109. Image via NASA Earth Observatory.

These transient, movable islands play an important role in marine ecosystems, scientists say, moving barnacles, coral, and seaweed that cling to the pumice to new homes. Some news outlets are reporting that the pumice might make it to Australia to help restore the Great Barrier Reef’s corals , half of which have been killed in recent years as a result of climate change. According to Denison University volcanologist Erik Klemetti, the long-distance journeys of pumice rafts are

… definitely a way to get organisms to disperse widely.

But the idea that the stowaways aboard pumice rafts might replenish the Great Barrier Reef’s corals is wishful thinking, Klemetti told EOS. He said:

That’s probably an oversell.

Researchers are keeping a close watch on how the rafts are moving. Satellite imagery provides nearly daily updates. Ocean currents, wind, and waves sculpt and power the rafts, which now number in the hundreds.

Bottom line: In August 2019, rafts of pumice, spewed from an undersea volcano and spanning an area about the size of Washington, D.C., appeared in the South Pacific.

Via EOS


from EarthSky https://ift.tt/31x2RFi
Aerial view of blue sea mottled with white dots and lines and with large tan areas (the rafts).

Satellite image of a pumice raft floating near the Kingdom of Tonga. Image via NASA Earth Observatory.

In early August 2019, an unnamed volcano in the South Pacific Ocean near the Kingdom of Tonga erupted roughly 130 feet (40 meters) underwater. As lava spewed from the volcano, it cooled into pumice — porous rock filled with gas bubbles — and floated to the surface. This volcanic debris, with some fragments tiny and some as large as beach balls, aggregated into pumice rafts spanning an area of about 60 square miles (200 square km) — almost as big as Washington, D.C.

These temporary islands of volcanic rock are shaped and moved by ocean currents, wind, and waves, and provide a literal toehold for marine life, such as barnacles, coral, seaweed and mollusks, say scientists.

Several sailing crews have encountered the rocks. In a video, below, posted on YouTube on August 17, Shannon Lenz said:

On August 9, 2019, we sailed through a pumice field for 6-8 hours, much of the time there was no visible water. It was like plowing through a field. We figured the pumice was at least 6-inches thick.

An Australian couple, Michael Hoult and Larissa Brill, were sailing a catamaran to Fiji, when they encountered the raft on August 16. The couple said in a Facebook post:

We entered a total rock rubble slick made up of pumice stones from marble to basketball size.

Pumice rafts aren’t that common, according to Martin Jutzeler, a volcanologist at the University of Tasmania in Hobart. He told EOS:

We see about two per decade.

Jutzeler told EOS that not all undersea eruptions produce them, but the rafts that do form tend to stick around. They can last for months or years until the pumice abrades itself into dust or finally sinks. And floating pumice can traverse long distances. For example, he said, when the same unnamed volcano near Tonga erupted in 2001, the pumice raft it created eventually arrived in Queensland, Australia.

Aerial view sea with large tan areas and inset showing Manhattan Island for scale.

August 13, 2109. See detail below. Image via NASA Earth Observatory.

Aarial view, blue sea, scattered white clouds, tan raft nearly filling image.

Detail of above image, taken August 13, 2109. Image via NASA Earth Observatory.

These transient, movable islands play an important role in marine ecosystems, scientists say, moving barnacles, coral, and seaweed that cling to the pumice to new homes. Some news outlets are reporting that the pumice might make it to Australia to help restore the Great Barrier Reef’s corals , half of which have been killed in recent years as a result of climate change. According to Denison University volcanologist Erik Klemetti, the long-distance journeys of pumice rafts are

… definitely a way to get organisms to disperse widely.

But the idea that the stowaways aboard pumice rafts might replenish the Great Barrier Reef’s corals is wishful thinking, Klemetti told EOS. He said:

That’s probably an oversell.

Researchers are keeping a close watch on how the rafts are moving. Satellite imagery provides nearly daily updates. Ocean currents, wind, and waves sculpt and power the rafts, which now number in the hundreds.

Bottom line: In August 2019, rafts of pumice, spewed from an undersea volcano and spanning an area about the size of Washington, D.C., appeared in the South Pacific.

Via EOS


from EarthSky https://ift.tt/31x2RFi

How to see the Great Square of Pegasus

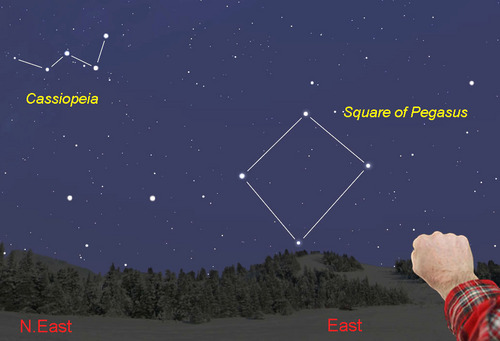
Sky chart with Great Square stars connected with white lines and east marked.

The Great Square of Pegasus consists of 4 stars of nearly equal brightness: Scheat, Alpheratz, Markab and Algenib. Illustration via AstroBob.

The Great Square of Pegasus gallops into the fall sky just after dark around the September equinox, which fells in 2019 on September 23. It consists of four stars of nearly equal brightness: Scheat, Alpheratz, Markab and Algenib. It’s a landmark of the Northern Hemisphere’s autumn sky.

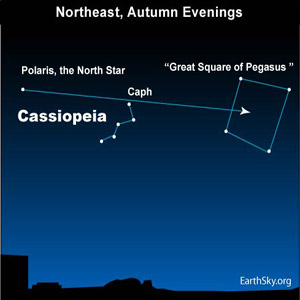
To find it, first of all use the Big Dipper to star-hop to Polaris the North Star. By drawing an imaginary line from any Big Dipper handle star through Polaris, and going twice the distance, you’ll always land on the W or M-shaped constellation Cassiopeia the Queen. A line from Polaris through the star Caph of Cassiopeia faithfully escorts you to the Great Square of Pegasus.

Chart of Cassiopeia and Great Square with N east and east marked and man's fist for measurement.

Image via astrobob.

Chart: line drawn from Polaris through Cassiopeia star Caph to Great Square.

Finding the Great Square of Pegasus.

Like the Big Dipper, the Great Square of Pegasus isn’t a constellation. Instead, it’s an asterism, or noticeable pattern on our sky’s dome.

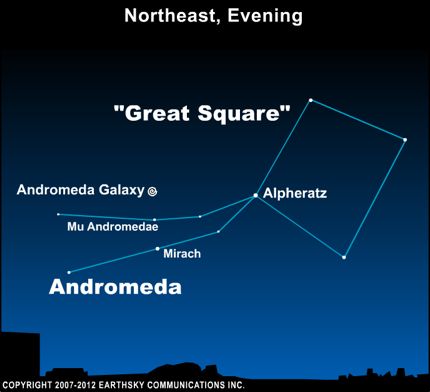
The Great Square is used much like the Big Dipper to help you find other sky treasures, the most notable being the Andromeda Galaxy.

Chart of constellation Andromeda next to Square with galaxy shown slightly above it.

Use the Great Square of Pegasus to find the Andromeda galaxy. Here’s how to do it.

A great big square of nothing. Often at events where many are stargazing for the first time, one may hear:

… the Great Square has nothing in it.

But, of course, the Great Square isn’t empty. The stars in the Square are faint enough that the unaided eye can’t easily detect them. If you have binoculars or small telescopes many stars pop up within the Square.

Dense star field with four brighter stars at corners of Square.

View larger. | You often hear people say the Great Square is “empty” of stars. Of course, it’s not. Charles White created this composite on November 20, 2017. It consists of 10 images, each a 30-second exposure. Rokinon 35mm lens, f2.0 ISA1600. Camera: Sony QX1 ILCE. Iptron Sky Tracker.

One of the most famous faint stars near the Great Square is 51 Pegasi. In 1995 astronomers announced they discovered a planet around this star. After a few months of skepticism from the astronomical community, it was confirmed that the first planet outside of our solar system had been discovered. Now we know that two planets orbit the star.

Some books say that 51 Pegasi can be viewed with the eye alone, but it’s a bit of a challenge. Using binoculars, look roughly halfway between Scheat and Markab. The chart below is courtesy of Professor Jim Kaler. Note that you won’t be able to see the planets. Pegasus 51 is approximately 50 light-years away from Earth.

Chart of constellation Pegasus with 10 stars labeled.

The star 51 Pegasi in the Great Square, via Jim Kaler.

You might recall that Pegasus was a winged horse in Greek mythology. The constellation Pegasus is one of seven constellations in the sky that tells why it is not good to say that a mortal is more beautiful than the gods. This story is plastered all over the autumn night sky.

Queen Cassiopeia bragged that she (or her daughter Andromeda) was more beautiful than immortal Nereids, or sea nymphs. This angered the gods, who asked the sea-god Poseidon to take revenge. The punishment was that King Cepheus and the Queen had to sacrifice their only daughter Andromeda to Cetus the sea monster. Andromeda while chained down to a rock at sea, and about to be gobbled up by the sea monster, saw Perseus riding Pegasus the flying horse. Perseus swooped down and showed the head of the Medusa to the Cetus, the sea monster, then Cetus immediately turned to stone. Then he whacked the chains holding Andromeda and freed her.

They flew off into the sunset to live happily ever after. The mortal horse on the last day of his life was given the honor of becoming a constellation for his loyal service. The dolphin that provided comfort to Andromeda was also granted immortality in the heavens by Zeus with the Delphinus constellation.

Enjoying EarthSky so far? Sign up for our free daily newsletter today!

Donate to EarthSky: Your support means the world to us

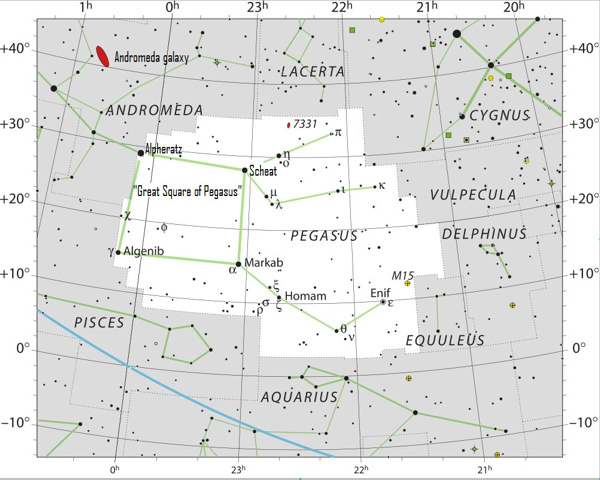
Star chart with black stars on white of constellation Pegasus.

The Great Square of Pegasus makes up the eastern (left) half of the constellation Pegasus. Image via Wikimedia Commons

Bottom line: How to see the Great Square of Pegasus star pattern.


from EarthSky https://ift.tt/304jMBp

Learning to live on the moon … underwater

Person in gear in underwater tank, with other people floating around.

Image via NASA/Bill Brassard.

In this image, taken September 5, 2019, in the massive pool at NASA’s Neutral Buoyancy Lab at the Johnson Space Center in Houston, astronaut teams move around, set up habitats, collect samples and deploy experiments as they will on the moon

The astronauts wear weighted vests and backpacks to simulate walking on the moon, which has one-sixth the gravity of Earth. The huge pool is used primarily to train astronauts for spacewalks aboard the International Space Station.

Via NASA


from EarthSky https://ift.tt/2QgNwYm

Close-up on Cassiopeia the Queen

Tonight – or any autumn evening – Cassiopeia the Queen can be found in the northeast after sunset. This constellation has the distinctive shape of a W, or M, depending on the time of night you see it. The shape of this constellation makes Cassiopeia’s stars very noticeable. Look for the Queen, starting at nightfall or early evening.

Cassiopeia represents an ancient queen of Ethiopia. The entire constellation is sometimes also called Cassiopeia’s Chair, and some old star maps depict the queen sitting on the chair, marked by the five brightest stars of this constellation. These stars are Schedar, Caph, Gamma Cassiopeiae, Ruchbah and Segin.

Animated diagram of Cassiopeia stars and Big Dipper circling around Polaris.

The Big Dipper and the W-shaped constellation Cassiopeia circle around Polaris, the North Star, in a period of 23 hours and 56 minutes. The Big Dipper is circumpolar at 41 degrees north latitude, and all latitudes farther north.

If you have a dark sky, you can look below Cassiopeia in the northeast on these autumn evenings for a famous binocular object. This object is called the Double Cluster in Perseus. These are open star clusters, each of which consists of young stars still moving together from the primordial cloud of gas and dust that gave birth to the cluster’s stars. These clusters are familiarly known to stargazers as H and Chi Persei.

Stargazers smile when they peer at them through their binoculars, not only because they are beautiful, but also because of their names. They are named from two different alphabets, the Greek and the Roman. Stars have Greek letter names, but most star clusters don’t. Johann Bayer (1572-1625) gave Chi Persei – the cluster on the top – its Greek letter name. Then, it’s said, he ran out of Greek letters. That’s when he used a Roman letter – the letter H – to name the other cluster.

After midnight, Cassiopeia swings above Polaris, the North Star. Before dawn, she is found in the northwest. But during the evening hours, Queen Cassiopeia lights up the northeast sky.

Bottom line: The constellation Cassiopeia the Queen has the distinct shape of a W or M. Find her in the north-northeast sky on September and October evenings.

Help support EarthSky! Visit the EarthSky store to see the great selection of educational tools and team gear we have to offer.

Enjoying EarthSky so far? Sign up for our free daily newsletter today!


from EarthSky https://ift.tt/2O6ZMI7

Skeptical Science to join the Global Climate Strike on September 20!

By now, many of you will already be aware that a big week of climate action kicks off on Friday, September 20 with a Global Climate Strike. Skeptical Science will join the digital version of the strike which is why we added a special - and closable - footer pointing to more information to our homepage.

ClimateStrikePoster

Come September 20, the footer will be replaced by a full screen overlay. However, as we expect many attacks from the usual suspects to coincide with the week of action, we‘ll not switch off Skeptical Science completely and the overlay can be closed to keep all our content readily available should any debunkings become necessary. Frankly, we‘d be quite surprised if this were not needed!

GlobalStrike

If you have a website or blog, how about joining the Digital Global Climate Strike? Find all the information and resources you need here.

Will you join the strike on the ground somewhere? If yes, please share in the comments where you participated!


from Skeptical Science https://ift.tt/2IciwCp

Skeptical Science New Research for Week #37, 2019

63 articles with 10 freely available as open access 

Pitch in!

In the abstract for Unlocking pre-1850 instrumental meteorological records: A global inventory (an open access article), Stefan Brönnimann tells us:

Instrumental meteorological measurements from periods prior to the start of national weather services are designated “early instrumental data”. They have played an important role in climate research as they allow daily-to-decadal variability and changes of temperature, pressure, and precipitation, including extremes, to be addressed. Early instrumental data can also help place 21st century climatic changes into a historical context such as to define pre-industrial climate and its variability. Until recently, the focus was on long, high-quality series, while the large number of shorter series (which together also cover long periods) received little to no attention. The shift in climate and climate impact research from mean climate characteristics towards weather variability and extremes, as well as the success of historical reanalyses which make use of short series, generates a need for locating and exploring further early instrumental measurements. However, information on early instrumental series has never been electronically compiled on a global scale. Here we attempt a worldwide compilation of metadata on early instrumental meteorological records prior to 1850 (1890 for Africa and the Arctic). Our global inventory comprises information on several thousand records, about half of which have not yet been digitized (not even as monthly means), and only approximately 20% of which have made it to global repositories. 

Having an inventory in hand, the next logical step is to render these records into a format suitable for computational input. There are ongoing efforts to do this— projects to which all of us may contribute help. For more information and leads to ongoing conversions, visit the ACRE website. The "citizen scientists" approach has proven very successful; in a brief period of time some 3,272 volunteers made thousands of old meteorological observations from the UK available as input to various weather and climate research avenues. Collections in the inventory described by Brönnimann will doubtless become grist for the mill of citizen volunteers.

"Let them eat lobster thermidor"

With yet another week's articles ranging from "concerning" to "dismal,"  adolescent lobsters finding an expanded habitat in certain areas thanks to a changing climate seem a welcome relief. Unfortunately, close reading of Goode et al's The brighter side of climate change: How local oceanography amplified a lobster boom in the Gulf of Maine reveals that generally warming waters on the larger scale are the reason for otherwise less suitable lobster habitat improving so as to produce a burgeoning boon of deliciousness. As is the case with setting one's house on fire and basking in warmth on a cold winter's evening, local and ephemeral effects are likely not worth the ultimate cost.

Articles:

Physical science of anthropogenic global warming

Connecting AMOC changes

Indian Ocean warming can strengthen the Atlantic meridional overturning circulation

Quantifying the importance of interannual, interdecadal and multidecadal climate natural variabilities in the modulation of global warming rates

Emergent Constraints on Climate-Carbon Cycle Feedbacks (open access)

Observation of global warming and global warming effects

More hots: Quantifying upward trends in the number of extremely hot days and nights in Tallahassee, Florida, USA: 1892–2018

Changes in mean flow and atmospheric wave activity in the North Atlantic sector

Physical retrieval of sea-surface temperature from INSAT-3D imager observations (open access)

An interdecadal shift of the extratropical teleconnection from the tropical Pacific during boreal summer

Trends in Compound Flooding in Northwestern Europe during 1901–2014

Large Decadal Changes in Air‐Sea CO2 Fluxes in the Caribbean Sea

Hot Summers in the Northern Hemisphere

Nineteenth‐century Tides in the Gulf of Maine and Implications for Secular Trends

Upper ocean distribution of glacial meltwater in the Amundsen Sea, Antarctica

Climate, irrigation, and land‐cover change explain streamflow trends in countries bordering the Northeast Atlantic

Significant increases in extreme precipitation and the associations with global warming over the global land monsoon regions

Observed Changes in Extreme Temperature over the Global Land Based on a Newly Developed Station Daily Dataset

Influence of Track Changes on the Poleward Shift of LMI Location of Western North Pacific Tropical Cyclones

 Unlocking pre-1850 instrumental meteorological records: A global inventory (open access)

Saharan air intrusions as a relevant mechanism for Iberian heatwaves: The record breaking events of August 2018 and June 2019

Contribution of extreme daily precipitation to total rainfall over the Arabian Peninsula

Innovative trend analysis of annual and seasonal rainfall in the Yangtze River Delta, eastern China

Modeling global warming and global warming effects

Tidal responses to future sea level trends on the Yellow Sea shelf

Northern Hemisphere atmospheric stilling accelerates lake thermal responses to a warming world

Quantifying the cloud particle‐size feedback in an Earth system model

Understanding Monsoonal Water Cycle Changes in a Warmer Climate in E3SMv1 Using a Normalized Gross Moist Stability Framework

Projected changes in the probability distributions, seasonality, and spatiotemporal scaling of daily and sub‐daily extreme precipitation simulated by a 50‐member ensemble over northeastern North America

Deglacial abrupt climate changes: not simply a freshwater problem (open access)

Assessment of the changes in precipitation and temperature in Teesta River basin in Indian Himalayan Region under climate change

Impact of internal variability on climate change for the upcoming decades: analysis of the CanESM2-LE and CESM-LE large ensembles (open access)

A bias-corrected projection for the changes in East Asian summer monsoon rainfall under global warming

Streamflow response to climate change in the Greater Horn of Africa (open access)

Intensified hydroclimatic regime in Korean basins under 1.5 and 2 °C global warming

Humans dealing with our warming of the planet

Importance of framing for extreme event attribution: the role of spatial and temporal scales (open access)

Assessing the maturity of China’s seven carbon trading pilots

Cross-sectoral and trans-national interactions in national-scale climate change impacts assessment—the case of the Czech Republic (open access)

Adaptive capacity in urban areas of developing countries

An intra-household analysis of farmers’ perceptions of and adaptation to climate change impacts: empirical evidence from drought prone zones of Bangladesh

The road traveled and pathways forward: A review of Loss and Damage from Climate Change: Concepts, Methods and Policy Options

Spatiotemporal changes of rice phenology in China under climate change from 1981 to 2010

A policy mixes approach to conceptualizing and measuring climate change adaptation policy

The brighter side of climate change: How local oceanography amplified a lobster boom in the Gulf of Maine

The acclimation of leaf photosynthesis of wheat and rice to seasonal temperature changes in T‐FACE environments

Post‐truth and anthropogenic climate change: Asking the right questions

Fairness conceptions and self-determined mitigation ambition under the Paris Agreement: Is there a relationship?

Historical development of climate change policies and the Climate Change Secretariat in Sri Lanka

A global decarbonisation bond (open access)

Climate change adaptation in coastal cities of developing countries: characterizing types of vulnerability and adaptation options

The potential impacts of Emissions Trading Scheme and biofuel options to carbon emissions of U.S. airlines

Regional carbon policies in an interconnected power system: How expanded coverage could exacerbate emission leakage

Examining concern about climate change and local environmental changes from an ecosystem service perspective in the Western U.S

Implementation solutions for greenhouse gas mitigation measures in livestock agriculture: A framework for coherent strategy

Projected declines in global DHA availability for human consumption as a result of global warming (open access)

Building political support for carbon pricing—Lessons from cap-and-trade policies

Cities and greenhouse gas reduction: Policy makers or policy takers?

Biology and global warming

A review of environmental droughts: Increased risk under global warming?

Climate change alters elevational phenology patterns of the European spruce bark beetle (Ips typographus)

Global warming promotes biological invasion of a honey bee pest

Flexibility in a changing arctic food web: Can rough‐legged buzzards cope with changing small rodent communities?

Effects of climate warming on Sphagnum photosynthesis in peatlands depend on peat moisture and species‐specific anatomical traits

Trait structure and redundancy determine sensitivity to disturbance in marine fish communities

Temporal and spatial trends in marine carbon isotopes in the Arctic Ocean and implications for food web studies

Testing for changes in biomass dynamics in large‐scale forest datasets

Future projections of record-breaking sea surface temperature and cyanobacteria bloom events in the Baltic Sea


Suggestions

Please let us know if you're aware of an article you think may be of interest for Skeptical Science research news, or if we've missed something that may be important. Send your input to Skeptical Science via our contact form.

The previous edition of Skeptical Science new research may be found here. 


from Skeptical Science https://ift.tt/303aw0n

Will a huge volcano on Jupiter’s moon Io erupt this month?

A portion of the surface of Io, appearing mottled.

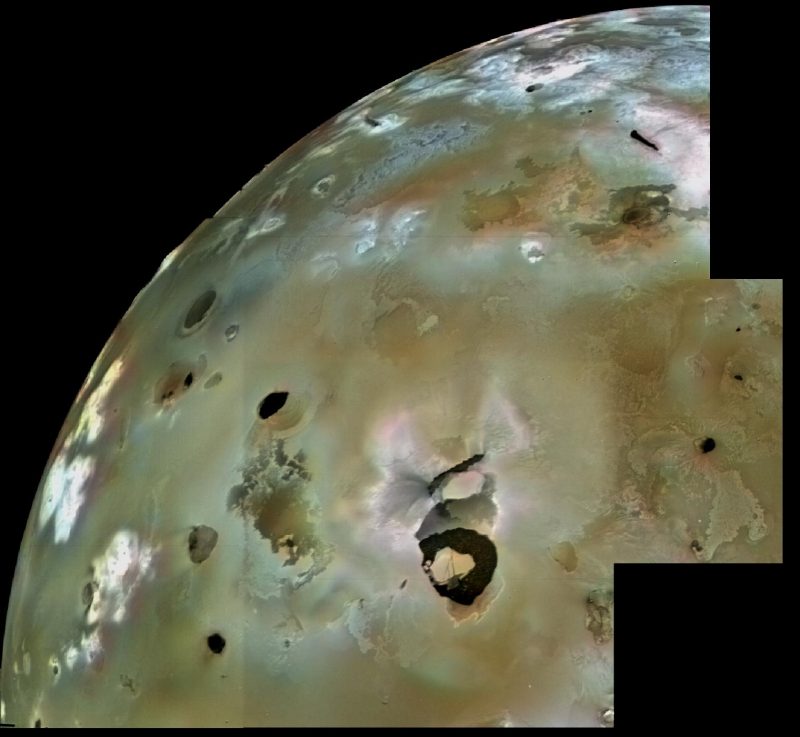
View larger. | Voyager 1 image mosaic – acquired in 1979 – showing a huge area of the volcanic plains on Jupiter’s moon Io. Numerous volcanic calderas and lava flows are visible here. Loki Patera, an active lava lake, is the large, U-shaped black feature, about in the center, toward the bottom of this image. Image via NASA PhotoJournal.

Jupiter’s moon Io is a world of active volcanoes, and Loki Patera is the largest of these, a great depression in the moon’s surface some 126 miles (202 km) across. An active lava lake resides in this depression, and the molten lava there is thought to be directly connected to a magma reservoir below. Above, the lake is likely covered over by a thin, solidified crust. Scientists peering through earthly telescopes have seen this area as continuously active. They think that the crust overlying the lake occasionally gives way, causing a brightness increase. In fact, Loki’s periodic eruptions are so regular that an astronomers has predicted one for this month. Loki is expected to erupt again in mid-September 2019, according to astronomer Julie Rathbun of the Planetary Science Institute based in Tucson, Arizona.

She presented this work today (September 17, 2019) at the joint meeting of the European Planetary Science Congress and the AAS Division for Planetary Sciences in Geneva, Switzerland. She said in a statement that, if Loki behaves as expected, it:

…should erupt in September 2019, around the same time as the EPSC-DPS joint meeting.

Rathbun added:

We correctly predicted that the last eruption would occur in May of 2018. Volcanoes are so difficult to predict because they are so complicated. Many things influence volcanic eruptions, including the rate of magma supply, the composition of the magma — particularly the presence of bubbles in the magma, the type of rock the volcano sits in, the fracture state of the rock, and many other issues.

We think that Loki could be predictable because it is so large. Because of its size, basic physics are likely to dominate when it erupts, so the small complications that affect smaller volcanoes are likely to not affect Loki as much.

In 2002, Rathbun published a paper showing that Loki’s eruption schedule had been approximately every 540 days during the 1990s. It currently appears to be approximately every 475 days. She explained:

Loki is the largest and most powerful volcano on Io, so bright in the infrared that we can detect it using telescopes on the Earth.

Will Loki erupt this month? This week, as Rathbun suggested? She reminded us:

… you have to be careful because Loki is named after a trickster god, and the volcano has not been known to behave itself. In the early 2000s, once the 540 day pattern was detected, Loki’s behavior changed and did not exhibit periodic behavior again until about 2013.

We’ll keep you updated.

Voyager image of volcano Loki on Io.

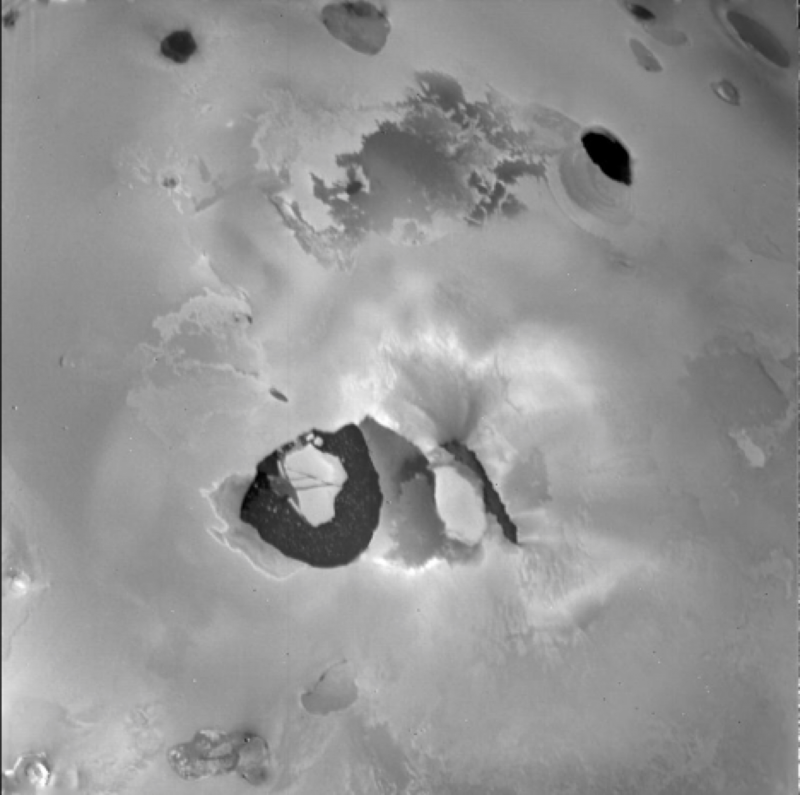
View larger. | The Voyager 1 spacecraft acquired this image of the volcano Loki on Jupiter’s moon Io in ___. As Voyager was sweeping past, the main eruptive activity came from the lower left of the dark linear feature (perhaps a rift) in the center. Below is the “lava lake,” a U-shaped dark area about 120 miles (200 km) across.

By the way, volcanos on Earth are driven by heat produced within Earth via the radioactive decay of isotopes in our planet’s mantle and crust, and also via the primordial heat leftover from Earth’s formation.

The source of Io’s heat is very different. Io’s heat is due to tidal frictional heating caused by the continual flexing of Io by the gravity of Jupiter and Europa, another of Jupiter’s satellites.

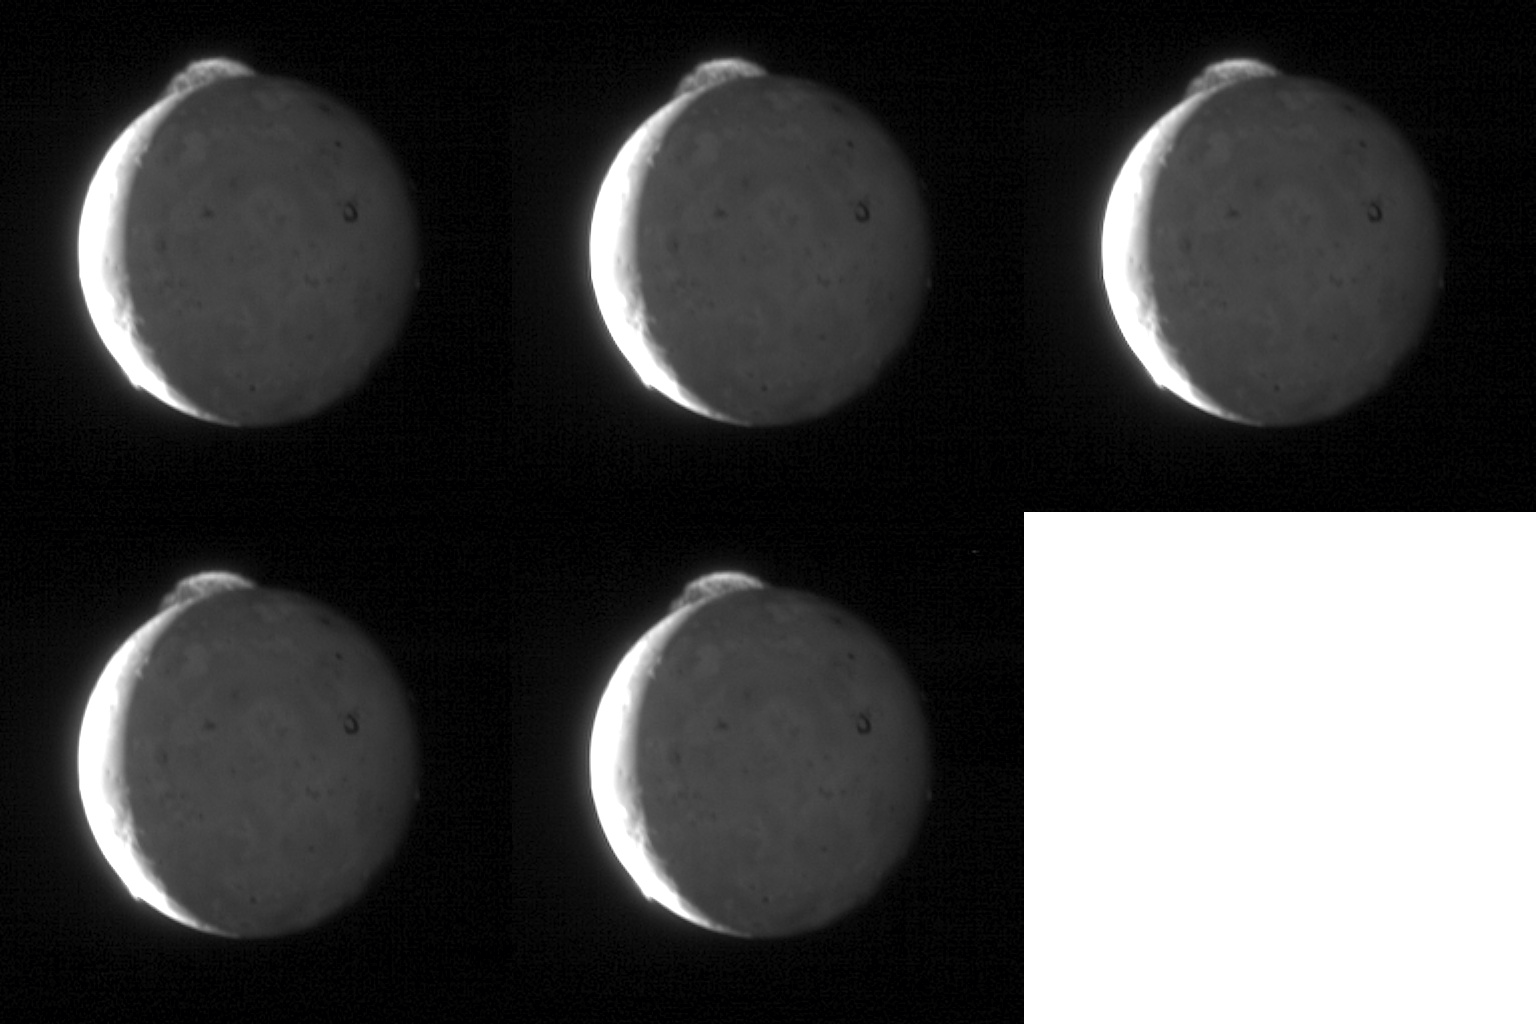
An active volcano on the edge, or limb, of Io can be seen spewing material into space.

A massive volcanic plume erupts from a volcano the surface of Jupiter’s moon Io. This plume isn’t from Loki, but, still, it’s cool, isn’t it? Image via NASA/ JHU-APL/ SRI.

Bottom line: A planetary scientists predicts that Loki, the largest volcano on Jupiter’s moon Io, will erupt in September, 2019.

Via EuroPlanet


from EarthSky https://ift.tt/2LWGTVJ