Since launch in 2014, Europe’s Sentinel-1A spacecraft has performed flawlessly, delivering a wealth of advanced radar imagery for Europe’s Copernicus programme. Later joined in orbit by sister satellite Sentinel-1B, the tandem mission recently delivered images of the zone in central Italy devastated by an earthquake on 24 August.

Sentinel-1, the first in the family of Copernicus satellites, is used to monitor many aspects of our environment, from detecting and tracking oil spills and mapping sea ice to monitoring movement in land surfaces and mapping changes in the way land is used. It also plays a crucial role in providing timely information to help respond to natural disasters and assist humanitarian relief efforts. Credit: ESA/ATG medialab
Ironically, just the day before, on 23 August, a solar panel on Sentinel-1A was hit by a millimetre-sized particle. The event has had, to date, no effect on the spacecraft’s routine operations, and such hits are not unexpected according to ESA’s Space Debris Office.
In fact, the effects of such hits on other spacecraft might have caused anomalies noticed by numerous satellite operators in past years, but it has been very difficult to definitely determine the cause, since other possible root causes could explain the effect.
In this case, however, the Sentinel-1A satellite is equipped with on-board cameras (meant to provide visual confirmation of solar array deployment shortly after launch and since switched off) and this system was switched back on to provide a view of the affected array, giving quick visual confirmation that an impact had occurred and providing clues as to what sort of strike may have happened.
We spoke with Holger Krag, Head of ESA’s Space Debris Office at ESOC, the European Space Operations Centre, Darmstadt, Germany, to get more details on his team’s involvement in this fascinating investigation.
Can you tell us in a nutshell what happened with Sentinel-1A?
As we do for other Earth missions, we routinely provide conjunction warnings for potential collisions between the Sentinel-series of satellites and known, catalogued space debris objects.
On 23 August, mission controllers working on Sentinel-1A noticed some odd occurrences. First, they saw a relatively sudden drop in power generated on board by the solar arrays, starting at 17:07 UTC (19:07 CEST), while on the same day ESOC’s Flight Dynamics team noticed that the orbit had inexplicably changed (referred to as a ‘discontinuity’) and that the satellite’s attitude – its orientation in space – had changed. All these pointed to a common cause – an impact of some sort. That’s when we were notified.

Holger Krag Credit: ESA
We should note, as mentioned in the initial web news, that the power reduction is relatively small [less than 5% – Ed.] compared to the overall power generated by the solar panel, which remains much higher than what the satellite needs to perform routine operations.
Also the small change in attitude was automatically compensated for by the spacecraft’s attitude and orbit control system, and the change in orbit can be compensated for in the next routine orbit correction manoeuvre, which Sentinel-1A does every week, so no permanent effect on the mission is expected.
What was your first step?
Our first reaction was to check the space debris catalogue that we maintain for ESA and we confirmed that no known object was expected to come anywhere close enough to run the risk of a collision at that time. So whatever the colliding object was, it was not previously known to us.
From our catalogue, we have a very good idea of all debris objects at the Sentinel-1A altitude, about 700 km, that are larger than about 5 cm or so (these are trackable via radar). A collision with any objects in the catalogue would also have generated much more severe effects, up to the complete destruction of the spacecraft. The effects noted by the Sentinel-1A operators pointed more to an object of a few millimeters diameter.
When we used the observed orbit and attitude change, we applied some basic physics to the balance of impulses and angular momentum, which confirmed the estimated size of a few millimeters. However, currently, we are not able to conclude whether the impact was due to an artificial object or due to a naturally occurring micrometeoroid. That’s a really interesting and challenging question that we’re now trying to solve, so we’ve got our Sherlock Holmes’ ‘deerstalker’ caps on!
How significant was this impact?
The object had a significant impact velocity component toward the spacecraft. It basically came out of the flight direction with some sideward component. If it had hit the main body of the satellite, it very well could have led to significant damage.
On average, human-caused debris objects have a relative impact velocity of around 11 km/second at Sentinel-1A’s orbit. Even at a few mm diameter, this means that a collision with a solar array can be significant. We know from ground tests that hyper-velocity impacts generate a plasma and electrostatic discharge. If power conducting cables are hit, ground tests have shown that a short circuit can be generated. Hence, there can be more than just mechanical damage.
If a debris collision occurs, it is common for a satellite to be hit on its solar arrays – these present the largest cross-sectional area – and this is less damaging, as we see in this case.
Conversely, natural micrometeroids are travelling with relative speeds at or greater than 20 km/second, hence for a meteoroid a smaller size would suffice to generate the same observed effect. This is why we cannot rule out a micrometeoroid as one explanation at this stage.
This event here is special in many ways. For example, ESA have analysed solar arrays from Hubble after spending a long time in space. One array was full of micro-craters, but a massive feature like the one Sentinel-1A has never been observed, which shows that such events are still rare.
What information do the photos provide?
The photos are excellent and a very rare bit of evidence – indeed, I’ve never seen an impact from which we got such photos.
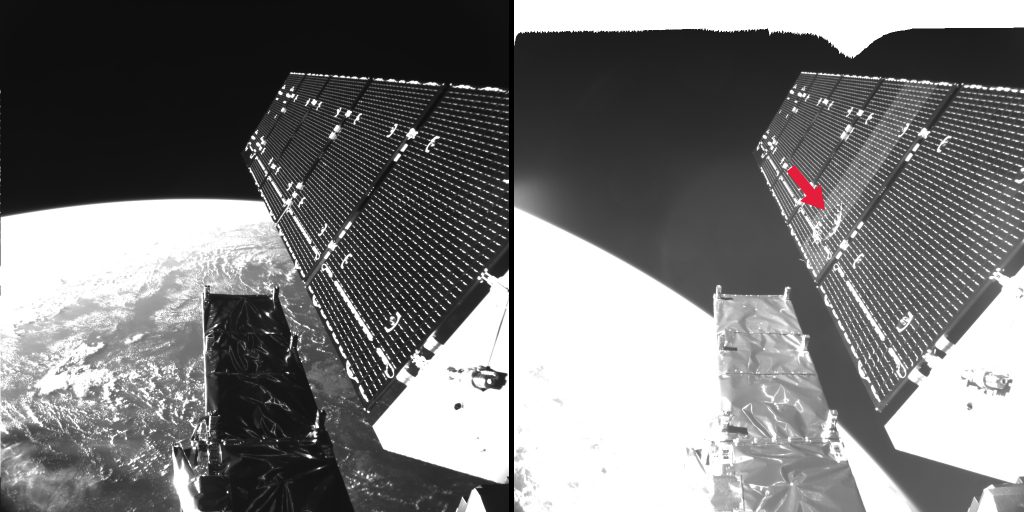
Sentinel-1A solar array before & after Credit: ESA
The one showing the impact penetration appears to indicate that the impacting object hit from the back side of the solar array, exiting out the front side, and it imparted a torque that caused the spacecraft to rotate in a certain fashion which also fits with the ‘telemetry’ (spacecraft status information) readings.
This is an important clue, as most debris objects do, in fact, impinge and collide from directions parallel to the plane of the flight direction, and almost never from top-down or from bottom-up, while natural micrometeoroids impinge also from above – since they are not bound to orbits around Earth. The precise impact location revealed by the images was one of the missing clues in our equations.
Since the image gives us a good indication of the impacting object’s directionality, we are analysing this to see if we can exclude one or the other.
What’s your initial suspicion?
With what we know now, my inclination is to strongly suspect this was a space-debris impact. At the determined impactor size of a few millimetres, our models suggest that the number of space debris is larger than that of meteoroids. If we could determine the impact directionality more precisely we might be able to confirm this hypothesis.
How will this affect future missions?
With growing impact risk in orbit, we might face a situation where future spacecraft must be designed to cater for such unpredictable energetic impacts.
You can’t avoid the risk entirely, or avoid an impact that destroys your satellite, but you can take certain design steps – for example, you can design solar arrays to have excess margin in the power they generate and other systems to have more redundancy and more robustness.
Then, when an impact does happen, and you survive it, you aren’t faced with a serious loss of power.
This also highlights the overall risk due to the existing space debris environment. All space-faring organisations must ensure that mitigation guidelines are followed and that we don’t do anything to cause more debris.
It also highlights the need to start removing defunct satellites and other large objects from orbit, so that they in turn do not cause cascading debris growth.
We appear to have survived this unexpected collision with minimal impact on this particular satellite. We may not be so fortuitous next time.
Editor’s note: On the question of how this event may affect future missions, Pierre Potin, ESA’s Sentinel-1 mission manager, adds that:
The on-board camera(s), which were not supposed to be used after LEOP (the initial launch and early orbit phase), has proved to be very useful in this case. From this experience, one could recommend embarking such cameras on future satellites – given that they will have to have a more appropriate design and pass some stringent environmental tests to ensure that they last the life of the mission.
from Rocket Science http://ift.tt/2bXqjnx
v
Since launch in 2014, Europe’s Sentinel-1A spacecraft has performed flawlessly, delivering a wealth of advanced radar imagery for Europe’s Copernicus programme. Later joined in orbit by sister satellite Sentinel-1B, the tandem mission recently delivered images of the zone in central Italy devastated by an earthquake on 24 August.
Sentinel-1, the first in the family of Copernicus satellites, is used to monitor many aspects of our environment, from detecting and tracking oil spills and mapping sea ice to monitoring movement in land surfaces and mapping changes in the way land is used. It also plays a crucial role in providing timely information to help respond to natural disasters and assist humanitarian relief efforts. Credit: ESA/ATG medialab
Ironically, just the day before, on 23 August, a solar panel on Sentinel-1A was hit by a millimetre-sized particle. The event has had, to date, no effect on the spacecraft’s routine operations, and such hits are not unexpected according to ESA’s Space Debris Office.
In fact, the effects of such hits on other spacecraft might have caused anomalies noticed by numerous satellite operators in past years, but it has been very difficult to definitely determine the cause, since other possible root causes could explain the effect.
In this case, however, the Sentinel-1A satellite is equipped with on-board cameras (meant to provide visual confirmation of solar array deployment shortly after launch and since switched off) and this system was switched back on to provide a view of the affected array, giving quick visual confirmation that an impact had occurred and providing clues as to what sort of strike may have happened.
We spoke with Holger Krag, Head of ESA’s Space Debris Office at ESOC, the European Space Operations Centre, Darmstadt, Germany, to get more details on his team’s involvement in this fascinating investigation.
Can you tell us in a nutshell what happened with Sentinel-1A?
As we do for other Earth missions, we routinely provide conjunction warnings for potential collisions between the Sentinel-series of satellites and known, catalogued space debris objects.
On 23 August, mission controllers working on Sentinel-1A noticed some odd occurrences. First, they saw a relatively sudden drop in power generated on board by the solar arrays, starting at 17:07 UTC (19:07 CEST), while on the same day ESOC’s Flight Dynamics team noticed that the orbit had inexplicably changed (referred to as a ‘discontinuity’) and that the satellite’s attitude – its orientation in space – had changed. All these pointed to a common cause – an impact of some sort. That’s when we were notified.
Holger Krag Credit: ESA
We should note, as mentioned in the initial web news, that the power reduction is relatively small [less than 5% – Ed.] compared to the overall power generated by the solar panel, which remains much higher than what the satellite needs to perform routine operations.
Also the small change in attitude was automatically compensated for by the spacecraft’s attitude and orbit control system, and the change in orbit can be compensated for in the next routine orbit correction manoeuvre, which Sentinel-1A does every week, so no permanent effect on the mission is expected.
What was your first step?
Our first reaction was to check the space debris catalogue that we maintain for ESA and we confirmed that no known object was expected to come anywhere close enough to run the risk of a collision at that time. So whatever the colliding object was, it was not previously known to us.
From our catalogue, we have a very good idea of all debris objects at the Sentinel-1A altitude, about 700 km, that are larger than about 5 cm or so (these are trackable via radar). A collision with any objects in the catalogue would also have generated much more severe effects, up to the complete destruction of the spacecraft. The effects noted by the Sentinel-1A operators pointed more to an object of a few millimeters diameter.
When we used the observed orbit and attitude change, we applied some basic physics to the balance of impulses and angular momentum, which confirmed the estimated size of a few millimeters. However, currently, we are not able to conclude whether the impact was due to an artificial object or due to a naturally occurring micrometeoroid. That’s a really interesting and challenging question that we’re now trying to solve, so we’ve got our Sherlock Holmes’ ‘deerstalker’ caps on!
How significant was this impact?
The object had a significant impact velocity component toward the spacecraft. It basically came out of the flight direction with some sideward component. If it had hit the main body of the satellite, it very well could have led to significant damage.
On average, human-caused debris objects have a relative impact velocity of around 11 km/second at Sentinel-1A’s orbit. Even at a few mm diameter, this means that a collision with a solar array can be significant. We know from ground tests that hyper-velocity impacts generate a plasma and electrostatic discharge. If power conducting cables are hit, ground tests have shown that a short circuit can be generated. Hence, there can be more than just mechanical damage.
If a debris collision occurs, it is common for a satellite to be hit on its solar arrays – these present the largest cross-sectional area – and this is less damaging, as we see in this case.
Conversely, natural micrometeroids are travelling with relative speeds at or greater than 20 km/second, hence for a meteoroid a smaller size would suffice to generate the same observed effect. This is why we cannot rule out a micrometeoroid as one explanation at this stage.
This event here is special in many ways. For example, ESA have analysed solar arrays from Hubble after spending a long time in space. One array was full of micro-craters, but a massive feature like the one Sentinel-1A has never been observed, which shows that such events are still rare.
What information do the photos provide?
The photos are excellent and a very rare bit of evidence – indeed, I’ve never seen an impact from which we got such photos.
Sentinel-1A solar array before & after Credit: ESA
The one showing the impact penetration appears to indicate that the impacting object hit from the back side of the solar array, exiting out the front side, and it imparted a torque that caused the spacecraft to rotate in a certain fashion which also fits with the ‘telemetry’ (spacecraft status information) readings.
This is an important clue, as most debris objects do, in fact, impinge and collide from directions parallel to the plane of the flight direction, and almost never from top-down or from bottom-up, while natural micrometeoroids impinge also from above – since they are not bound to orbits around Earth. The precise impact location revealed by the images was one of the missing clues in our equations.
Since the image gives us a good indication of the impacting object’s directionality, we are analysing this to see if we can exclude one or the other.
What’s your initial suspicion?
With what we know now, my inclination is to strongly suspect this was a space-debris impact. At the determined impactor size of a few millimetres, our models suggest that the number of space debris is larger than that of meteoroids. If we could determine the impact directionality more precisely we might be able to confirm this hypothesis.
How will this affect future missions?
With growing impact risk in orbit, we might face a situation where future spacecraft must be designed to cater for such unpredictable energetic impacts.
You can’t avoid the risk entirely, or avoid an impact that destroys your satellite, but you can take certain design steps – for example, you can design solar arrays to have excess margin in the power they generate and other systems to have more redundancy and more robustness.
Then, when an impact does happen, and you survive it, you aren’t faced with a serious loss of power.
This also highlights the overall risk due to the existing space debris environment. All space-faring organisations must ensure that mitigation guidelines are followed and that we don’t do anything to cause more debris.
It also highlights the need to start removing defunct satellites and other large objects from orbit, so that they in turn do not cause cascading debris growth.
We appear to have survived this unexpected collision with minimal impact on this particular satellite. We may not be so fortuitous next time.
Editor’s note: On the question of how this event may affect future missions, Pierre Potin, ESA’s Sentinel-1 mission manager, adds that:
The on-board camera(s), which were not supposed to be used after LEOP (the initial launch and early orbit phase), has proved to be very useful in this case. From this experience, one could recommend embarking such cameras on future satellites – given that they will have to have a more appropriate design and pass some stringent environmental tests to ensure that they last the life of the mission.
from Rocket Science http://ift.tt/2bXqjnx
v