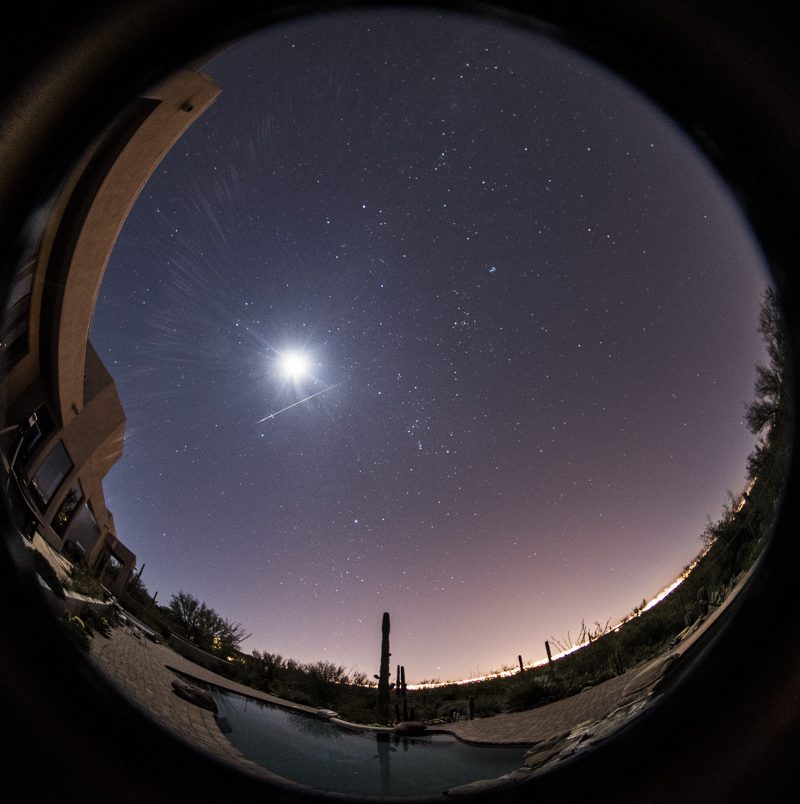
The composite image above – from John Ashley at Glacier National Park in Montana, in 2016 – perfectly captures the feeling of standing outside as dawn is approaching, after a peak night of Perseid meteor-watching. As viewed from anywhere in the Northern Hemisphere, the Perseids’ radiant point is highest at dawn, and so the meteors rain down from overhead. Unfortunately, in 2019, the moon is in the way of this shower. View the full image here.
When is the peak of the Perseid meteor shower in 2019? The most meteors are most likely to fall in the predawn hours on August 13, yet under the light of a bright waxing gibbous moon. The mornings of August 11 and 12 are surely worth trying, too, especially as there will be more moon-free viewing time on these mornings … a larger window between moonset and dawn. Although the brighter Perseids will overcome the moonlight, there’s nothing like a dark sky for meteor watching. During the coming peak of the 2019 Perseid shower, the moon will be in the sky as night falls. So moonset is the key factor. Visit the Sunrise Sunset Calendars site to find out when the moon sets in your sky, remembering to check the moonrise and moonset box.
In dark skies – no moon and no city lights – the Perseids have been known to usher in 50 to 60 meteors per hour, or more, at their peak.
So here are the tasks before you, if you want to watch meteors in 2019. Find out the time of moonset on the morning(s) you want to watch. Find a country location, far from city lights. Plan to watch during the hours between moonset and dawn.
Can’t get out of town? Then go to the darkest sky you can find near you (a beach? a park?) as late at night as you can, preferably just before dawn. Situate yourself in the shadow of a tree or building, if there are lights around. Look up, and hope for the best! Who knows … you might catch a shooting star.
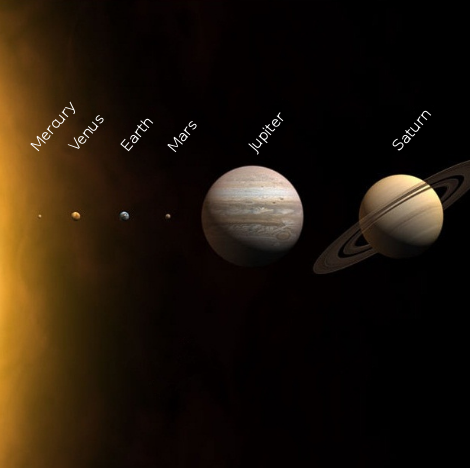
By the way, as a consolation prize, there are some bright stars and planets near the moon on these nights. Read more: Moon, Jupiter, Saturn … Perseid meteors?

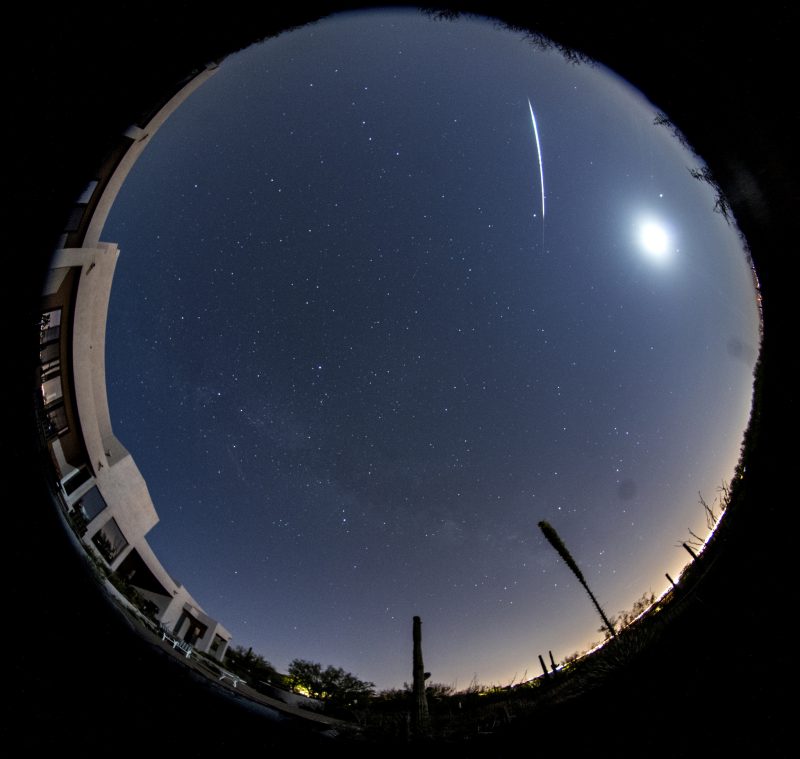
The Perseids begin in July every year and rise slowly to their August peak. Eliot Herman in Tucson, Arizona, captured this bright Perseid meteor on the morning of August 8, 2019. Thank you, Eliot!
Can you watch the shower in the evening hours? In years when the moon is down during those hours, in the Northern Hemisphere, you might see a smattering of Perseid meteors in the evening. Plus, evening is the best time of night to try to catch an earthgrazer, which is an elongated, long-lasting meteor that travels horizontally across the sky. Earthgrazers are rare but most memorable if you’re lucky enough to spot one.
What if you’re in the Southern Hemisphere? From the Southern Hemisphere, the first meteors – and possible earthgrazers – won’t be flying until after midnight or the wee hours of the morning.
In either the Northern or the Southern Hemisphere, the greatest number of meteors streak the sky in the few hours before dawn.
Enjoying EarthSky so far? Sign up for our free daily newsletter today!
The earliest historical account of Perseid activity comes from a Chinese record in 36 A.D., where it was said that:
… more than 100 meteors flew in the morning.
Numerous references to the August Perseids appear in Chinese, Japanese and Korean records throughout the 8th, 9th, 10th and 11th centuries. Meanwhile, according to ancient western skylore, the Perseid shower commemorates the time when the god Zeus visited the mortal maiden Danaë in the form of a shower of gold. Zeus and Danaë became the parents of Perseus the Hero – from whose constellation the Perseid meteors radiate. More about the Perseid’s radiant point below.
The Perseid meteors happen around this time every year, as Earth in its orbit crosses the orbital path of Comet Swift-Tuttle. Dusty debris left behind by this comet smashes into Earth’s upper atmosphere, lighting up the nighttime as fiery Perseid meteors. The meteors start out slowly in the evening hours, begin to pick up steam after midnight and put out the greatest numbers in the dark hours before dawn.
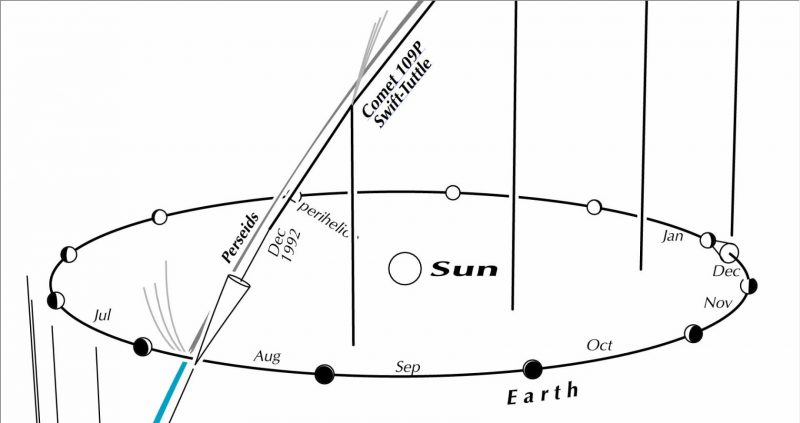
The parent comet of the Perseids – Comet Swift-Tuttle – takes about 130 years to orbit the sun once. We see the meteor shower when Earth intersects the comet’s orbit each year, and debris left behind in its orbit enters our atmosphere. Chart via Guy Ottewell. More awesome Perseid charts from Guy in this post from last year.
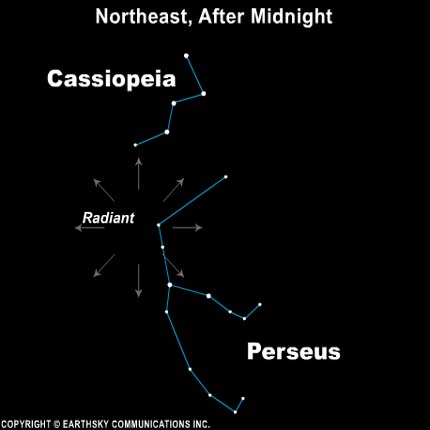
The paths of the Perseid meteors, when traced backward, appear to originate in the constellation Perseus. Hence, this meteor shower’s name. While out there peering into dark skies, try looking for the Perseid’s radiant point. You don’t need to find it to enjoy the meteors, but it’s fun to find.
Perseus itself isn’t all that easy to find, but a nearby constellation – Cassiopeia the Queen – is. Look northward for Cassiopeia. It has a very distinctive shape of the letter W or the number 3. See it? Good.
The constellation Perseus, radiant for the annual Perseid meteor shower. The easy-to-spot constellation Cassiopeia is nearby.
Want to go deeper? Then look for the Double Cluster in Perseus. This dual cluster of stars almost exactly marks the radiant point of the Perseid meteor shower. You can find it by scanning with your binoculars between Perseus and Cassiopeia.
Although the Double Cluster can be seen with the unaided eye in a dark country sky, the Double Clusters’ stars burst into view through binoculars. The clusters are more formally known as NGC 884 (Chi Persei) and NGC 869 (h Persei). The Double Cluster is thought to be over 7,000 light-years away from us, in the Perseus arm of the Milky Way galaxy.
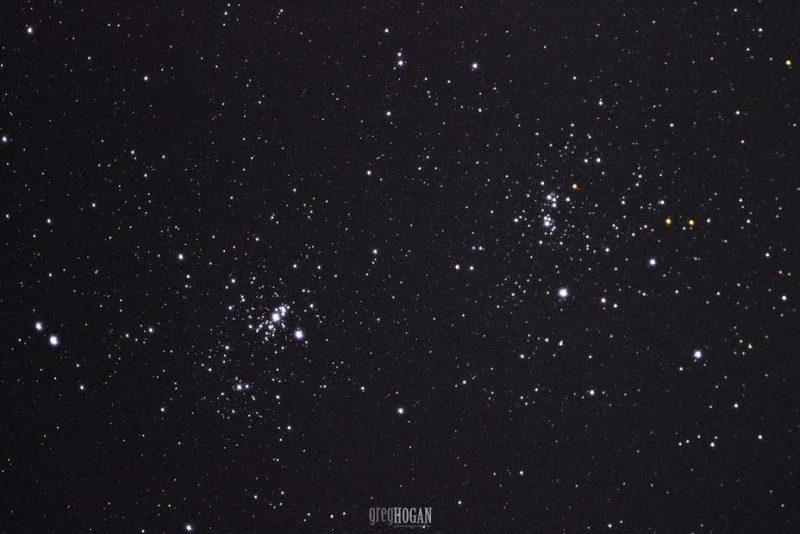
Double cluster in Perseus via Greg Hogan of Kathleen, Georgia.
Now here’s the good news. You don’t need to know the constellation Perseus to watch the Perseid meteor shower. You don’t need to find the radiant point. The Perseids do radiate from there, but they will appear in all parts of a dark night sky.
Here’s all you do need to know about the radiant point. As viewed from the Northern Hemisphere, the radiant sits low in the northeast sky at evening and climbs upward throughout the night. The higher that the radiant is in your sky, the more Perseid meteors you’re likely to see. For the Perseids, the radiant is highest before dawn.
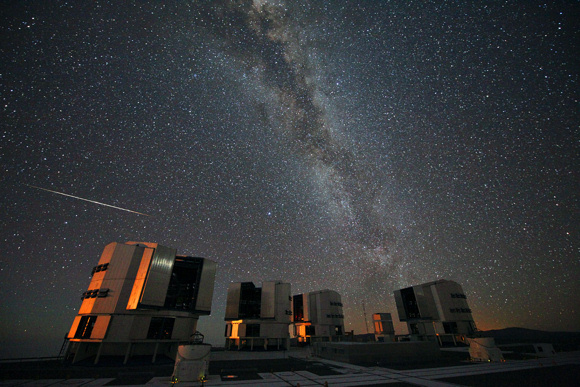
Some Perseid meteors will be visible in the Southern Hemisphere, although the numbers will not be as high. Photo via the European Southern Observatory/S. Guisard in northern Chile.
Looking for a dark area to observe from? Check out EarthSky’s interactive, worldwide Best Places to Stargaze map.
Bottom line: The mornings leading up to August 13, 2019, should be decent for meteor-watching, providing you can find a way to work around the pesky moon. The moon is brighter in the sky on each of those mornings, and the dark window between moonset and dawn steadily shrinks as the peak morning – August 13 – approaches. We recommend watching across several mornings, before the peak, this year. Find moonset times for your location at Sunrise Sunset Calendars.
EarthSky’s meteor shower guide for 2019
from EarthSky https://ift.tt/33mnViZ
The composite image above – from John Ashley at Glacier National Park in Montana, in 2016 – perfectly captures the feeling of standing outside as dawn is approaching, after a peak night of Perseid meteor-watching. As viewed from anywhere in the Northern Hemisphere, the Perseids’ radiant point is highest at dawn, and so the meteors rain down from overhead. Unfortunately, in 2019, the moon is in the way of this shower. View the full image here.
When is the peak of the Perseid meteor shower in 2019? The most meteors are most likely to fall in the predawn hours on August 13, yet under the light of a bright waxing gibbous moon. The mornings of August 11 and 12 are surely worth trying, too, especially as there will be more moon-free viewing time on these mornings … a larger window between moonset and dawn. Although the brighter Perseids will overcome the moonlight, there’s nothing like a dark sky for meteor watching. During the coming peak of the 2019 Perseid shower, the moon will be in the sky as night falls. So moonset is the key factor. Visit the Sunrise Sunset Calendars site to find out when the moon sets in your sky, remembering to check the moonrise and moonset box.
In dark skies – no moon and no city lights – the Perseids have been known to usher in 50 to 60 meteors per hour, or more, at their peak.
So here are the tasks before you, if you want to watch meteors in 2019. Find out the time of moonset on the morning(s) you want to watch. Find a country location, far from city lights. Plan to watch during the hours between moonset and dawn.
Can’t get out of town? Then go to the darkest sky you can find near you (a beach? a park?) as late at night as you can, preferably just before dawn. Situate yourself in the shadow of a tree or building, if there are lights around. Look up, and hope for the best! Who knows … you might catch a shooting star.
By the way, as a consolation prize, there are some bright stars and planets near the moon on these nights. Read more: Moon, Jupiter, Saturn … Perseid meteors?
The Perseids begin in July every year and rise slowly to their August peak. Eliot Herman in Tucson, Arizona, captured this bright Perseid meteor on the morning of August 8, 2019. Thank you, Eliot!
Can you watch the shower in the evening hours? In years when the moon is down during those hours, in the Northern Hemisphere, you might see a smattering of Perseid meteors in the evening. Plus, evening is the best time of night to try to catch an earthgrazer, which is an elongated, long-lasting meteor that travels horizontally across the sky. Earthgrazers are rare but most memorable if you’re lucky enough to spot one.
What if you’re in the Southern Hemisphere? From the Southern Hemisphere, the first meteors – and possible earthgrazers – won’t be flying until after midnight or the wee hours of the morning.
In either the Northern or the Southern Hemisphere, the greatest number of meteors streak the sky in the few hours before dawn.
Enjoying EarthSky so far? Sign up for our free daily newsletter today!
The earliest historical account of Perseid activity comes from a Chinese record in 36 A.D., where it was said that:
… more than 100 meteors flew in the morning.
Numerous references to the August Perseids appear in Chinese, Japanese and Korean records throughout the 8th, 9th, 10th and 11th centuries. Meanwhile, according to ancient western skylore, the Perseid shower commemorates the time when the god Zeus visited the mortal maiden Danaë in the form of a shower of gold. Zeus and Danaë became the parents of Perseus the Hero – from whose constellation the Perseid meteors radiate. More about the Perseid’s radiant point below.
The Perseid meteors happen around this time every year, as Earth in its orbit crosses the orbital path of Comet Swift-Tuttle. Dusty debris left behind by this comet smashes into Earth’s upper atmosphere, lighting up the nighttime as fiery Perseid meteors. The meteors start out slowly in the evening hours, begin to pick up steam after midnight and put out the greatest numbers in the dark hours before dawn.
The parent comet of the Perseids – Comet Swift-Tuttle – takes about 130 years to orbit the sun once. We see the meteor shower when Earth intersects the comet’s orbit each year, and debris left behind in its orbit enters our atmosphere. Chart via Guy Ottewell. More awesome Perseid charts from Guy in this post from last year.
The paths of the Perseid meteors, when traced backward, appear to originate in the constellation Perseus. Hence, this meteor shower’s name. While out there peering into dark skies, try looking for the Perseid’s radiant point. You don’t need to find it to enjoy the meteors, but it’s fun to find.
Perseus itself isn’t all that easy to find, but a nearby constellation – Cassiopeia the Queen – is. Look northward for Cassiopeia. It has a very distinctive shape of the letter W or the number 3. See it? Good.
The constellation Perseus, radiant for the annual Perseid meteor shower. The easy-to-spot constellation Cassiopeia is nearby.
Want to go deeper? Then look for the Double Cluster in Perseus. This dual cluster of stars almost exactly marks the radiant point of the Perseid meteor shower. You can find it by scanning with your binoculars between Perseus and Cassiopeia.
Although the Double Cluster can be seen with the unaided eye in a dark country sky, the Double Clusters’ stars burst into view through binoculars. The clusters are more formally known as NGC 884 (Chi Persei) and NGC 869 (h Persei). The Double Cluster is thought to be over 7,000 light-years away from us, in the Perseus arm of the Milky Way galaxy.
Double cluster in Perseus via Greg Hogan of Kathleen, Georgia.
Now here’s the good news. You don’t need to know the constellation Perseus to watch the Perseid meteor shower. You don’t need to find the radiant point. The Perseids do radiate from there, but they will appear in all parts of a dark night sky.
Here’s all you do need to know about the radiant point. As viewed from the Northern Hemisphere, the radiant sits low in the northeast sky at evening and climbs upward throughout the night. The higher that the radiant is in your sky, the more Perseid meteors you’re likely to see. For the Perseids, the radiant is highest before dawn.
Some Perseid meteors will be visible in the Southern Hemisphere, although the numbers will not be as high. Photo via the European Southern Observatory/S. Guisard in northern Chile.
Looking for a dark area to observe from? Check out EarthSky’s interactive, worldwide Best Places to Stargaze map.
Bottom line: The mornings leading up to August 13, 2019, should be decent for meteor-watching, providing you can find a way to work around the pesky moon. The moon is brighter in the sky on each of those mornings, and the dark window between moonset and dawn steadily shrinks as the peak morning – August 13 – approaches. We recommend watching across several mornings, before the peak, this year. Find moonset times for your location at Sunrise Sunset Calendars.
EarthSky’s meteor shower guide for 2019
from EarthSky https://ift.tt/33mnViZ