
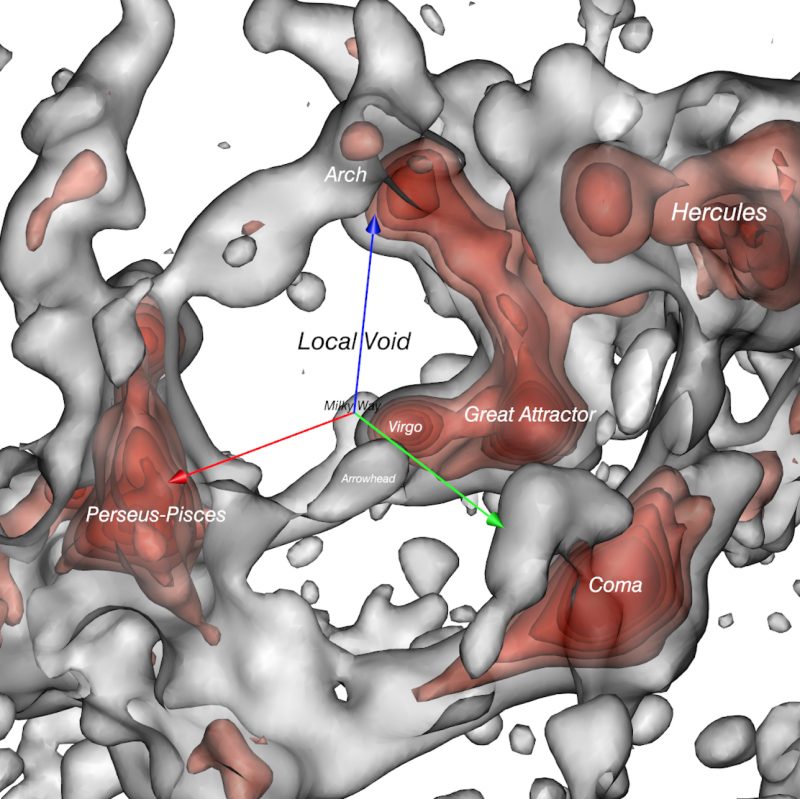
View larger. | When you look at this artist’s rendition of the large-scale structure surrounding our Milky Way, you’ve got to think big! See the Milky Way? Those red-green-blue arrows each represent a distance 200 million light-years in length. According to new research, we’re at a boundary between our Local Void, and the high-density Virgo galaxy cluster. Image via R. Brent Tully/ IfA.
Astronomers have published a new study showing more of the vast cosmic structure surrounding our Milky Way galaxy. In recent decades, astronomers have realized that the galaxies in our universe have a vast honeycomb structure, consisting of great conglomerations of galaxies interspersed with vast cosmic voids. This team has now measured the motions of 18,000 galaxies and used those motions to infer the distribution of mass responsible for the motions. From there, they constructed three-dimensional maps of our local universe, showing the Milky Way’s place with respect to our local cosmic void, which they call the Local Void. This work was led by R. Brent Tully of the University of Hawaii Institute for Astronomy (IfA), who has worked in this area of study for many years. He and an international team published the new study on July 22, 2019, in the peer-reviewed Astrophysical Journal.
They’ve created some interesting views of their work including an interactive video, which you can see and play around with here. With the interactive model, you can pan, zoom, rotate, and pause/activate the time evolution of movement along orbits. The orbits are shown in a reference frame that removes the overall expansion of the universe. What we are seeing are the deviations from cosmic expansion caused by the interactions of local sources of gravity.
Representations of the void can also be seen in a video (below).
The universe is a tapestry of galaxy congregations and vast voids. In a new study being reported, Tully and his team apply the same tools from an earlier study to map the size and shape of an extensive empty region they called the Local Void that borders the Milky Way galaxy.
Galaxies not only move with the overall expansion of the universe, they also respond to the gravitational tug of their neighbors and regions with a lot of mass. As a consequence, relative to the overall expansion of the universe they are moving towards the densest areas and away from regions with little mass – the voids.
Although we live in a cosmic metropolis, back in 1987 Tully and Richard Fisher noted that our Milky Way galaxy is also at the edge of an extensive empty region that they called the Local Void. The existence of the Local Void has been widely accepted, but it remained poorly studied because it lies behind the center of our galaxy and is therefore heavily obscured from our view.
Now, Tully and his team have measured the motions of 18,000 galaxies in the Cosmicflows-3 compendium of galaxy distances, constructing a cosmographic map that highlights the boundary between the collection of matter and the absence of matter that defines the edge of the Local Void. They used the same technique in 2014 to identify the full extent of our home supercluster of over one hundred thousand galaxies, giving it the name Laniakea, meaning “immense heaven” in Hawaiian.
Cosmicflows-3: Cosmography of the Local Void from Daniel Pomarède on Vimeo.
For 30 years, astronomers have been trying to identify why the motions of the Milky Way, our nearest large galaxy neighbor Andromeda, and their smaller neighbors deviate from the overall expansion of the universe by over 600 km/s (1.3 million mph). The new study shows that roughly half of this motion is generated “locally” from the combination of a pull from the massive nearby Virgo Cluster and our participation in the expansion of the Local Void as it becomes ever emptier.
Representations of the void can be seen in a video and, alternatively, with an interactive model. With the interactive model, a viewer can pan, zoom, rotate, and pause/activate the time evolution of movement along orbits. The orbits are shown in a reference frame that removes the overall expansion of the universe. What we are seeing are the deviations from cosmic expansion caused by the interactions of local sources of gravity.
Bottom line: Astronomers have mapped gigantic structures encompassing vast, dense clusters of galaxies and bubble-like voids among them, with the Milky Way between the Local Void and the denser Virgo Cluster.
Source: Cosmicflows-3: Cosmography of the Local Void
from EarthSky https://ift.tt/2OIQt32
Aucun commentaire:
Enregistrer un commentaire