

It’ll be easy to spot the moon and Venus in early December, but Mercury will present more of a challenge. You might need binoculars to spot the young moon and Mercury after sunset on November 30. Read more.
Two of the five bright planets rise to great prominence in December 2016. Venus and Jupiter almost seem to balance two sides of our sky. Venus, the brightest planet, blazes in the west first thing at dusk. Jupiter, second-brightest, lords over the eastern half of sky before sunrise. Mars joins Venus in the evening sky, though it’s higher up than Venus and sets in the west after Venus does. Venus and Mars remain evening objects throughout December, but Saturn is now lost in the sun’s glare. We expect the notoriously elusive bright planet Mercury to become visible at dusk/nightfall by early December. Day by day, Mercury climbs upward to reach its greatest evening elongation in the evening sky on December 10. Follow the links below to learn more about planets in December 2016.
Brilliant Venus is the “evening star”
Mars, east of Venus, until mid-to-late evening
Saturn lost in sun’s glare
Bright Jupiter is prominent before dawn
Mercury in west at dusk/nightfall
Like what EarthSky offers? Sign up for our free daily newsletter today!
Astronomy events, star parties, festivals, workshops
Visit a new EarthSky feature – Best Places to Stargaze – and add your fav.

Watch for the waxing crescent moon and the dazzling planet Venus to adorn the evening wilight for several days, centered on December 2 or 3. Read more.
Brilliant Venus is the “evening star.” Okay, it’s not a star. It’s a planet. But people will call it the evening star all the same. In these past weeks, many have noticed Venus and been amazed at its brilliance in the west after sunset. It’s the brightest planet and very, very bright, even though it’s been low in the sky.
Be sure to catch the waxing crescent moon near Venus in early December, as displayed on the sky chart above. Click here for details.
Venus will climb upward from the setting sun throughout the month. Watch for Venus to close the gap between itself and Mars. These two visible evening planets will be closer together on the sky’s dome by the month’s end and closer yet in January 2017.
From mid-northern latitudes (U.S. and Europe), Venus sets about three hours after the sun in early December, and four hours after sunset by the month’s end.
At mid-southern latitudes (Australia and South Africa), Venus sets about about three hours after the sun all month long.

The moon, Venus and Mars as seen from North America on December 4, 2016. But no matter where you reside worldwide, look first for the moon on this date, and then seek out Venus and Mars. Read more
Mars, east of Venus, until mid-to-late evening. After appearing as a bright red light in our sky last May and June, Mars now appears only modestly bright (though still ruddy),above dazzling Venus. Venus is so bright that it pops out almost immediately after sunset, but you’ll have to wait until nightfall to see fainter Mars. Look for the moon close to Mars for a few evenings, centered on or near December 4.
From mid-northern latitudes (U.S. and Europe), look for the red planet Mars to set in the west around 9 to 10 p.m. all month long.
At mid-southern latitudes (Australia and South Africa), Mars sets in the west around 11 p.m. or midnight in early December, and about an hour earlier by the month’s end.
Mars will linger in our sky for several more months. Keep in mind, however, that Earth is traveling away from Mars as we speak – moving far ahead of this planet in the endless race around the sun – so Mars is dimming in our evening sky. Mars is in its long, lingering, relatively inconspicuous phase now. It’ll be still visible in the west to the unaided eye – though not prominent – during its conjunction with Uranus on the evening of February 27, 2017.
Mars won’t make its transition from the evening to the morning sky until July 27, 2017. Even so, Mars’ stature in the evening sky will continue to diminish to that of a rather faint “star,” and we expect few – if any – skywatchers to observe the conjunction of Mars and Mercury in the evening sky on June 28, 2017.
The conjunction of Mars and Venus in the morning sky on October 5, 2017, may well present the first good opportunity to spot Mars in the morning sky when it returns from being behind the sun on July 27, 2017.
Looking for a sky almanac? EarthSky recommends…

View larger | Mikhail Chubarets in the Ukraine made this chart. It shows the view of Mars through a telescope in 2016. We never see Mars as a disk like this with the eye alone. But you can see why Mars was bright to the eye in 2016, and is now fading.
Saturn lost in sun’s glare. Saturn swings behind the sun on December 10, as this world transitions from the evening to morning sky.
In both the Northern and Southern Hemispheres, Saturn might return to visibility in the east before sunrise in very late December 2016. More likely, you’ll have to wait until January 2017 to view Saturn in the morning sky.
Saturn, the farthest world that you can easily view with the eye alone, appears golden in color. It shines with a steady light.
Binoculars don’t reveal Saturn’s gorgeous rings, by the way, although binoculars will enhance Saturn’s golden color. To see the rings, you need a small telescope. A telescope will also reveal one or more of Saturn’s many moons, most notably Titan.
Saturn’s rings are inclined at a little more than 26o from edge-on, exhibiting their northern face. Next year, in October 2017, the rings will open most widely, displaying a maximum inclination of 27o.
As with so much in space (and on Earth), the appearance of Saturn’s rings from Earth is cyclical. In the year 2025, the rings will appear edge-on as seen from Earth. After that, we’ll begin to see the south side of Saturn’s rings, to increase to a maximum inclination of 27o by May 2032.
Click here for recommended almanacs. They can help you know when the planets rise, transit and set in your sky

Tom Wildoner over-exposed Saturn itself to capture this view of Saturn’s moons on June 25, 2016. Visit Tom at LeisurelyScientist.com.

Use the moon to locate Jupiter in the morning sky for several days, centered on or near December 22. Read more.
Bright Jupiter is prominent before dawn. Jupiter’s increasing prominence as the “morning star” will be hard to overlook in December. To see Jupiter, seek out the brightest starlike object in the predawn sky or the morning twilight and that’ll be the king planet Jupiter!
From mid-northern latitudes, like those in the U.S. and Europe, Jupiter rises about 2.5 hours after midnight in early December and around one hour after the midnight hour by the month’s end.
From mid-southern latitudes (Australia), look for Jupiter to rise about 2 hours after midnight in early December and around midnight by the end of the month.
If you’re not a night owl, your best bet for catching Jupiter is to wake up before sunrise to see this brilliant beauty of a planet lighting up the predawn and dawn sky. Watch for the waning crescent moon to join up with Jupiter for several days, centered on or near December 22. See the above sky chart.
By the way, Jupiter shines in front of the constellation Virgo, near Virgo’s brightest star, Spica. Jupiter serves a great reference for learning the constellations of the zodiac, because Jupiter stays in each constellation for roughly a year. So use Jupiter to become familiar with the star Spica and the constellation Virgo, starting now, and throughout 2017.
If you have binoculars or a telescope, it’s fairly easy to see Jupiter’s four major moons, which look like pinpricks of light on or near the same plane. They are often called the Galilean moons to honor Galileo, who discovered these great Jovian moons in 1610. In their order from Jupiter, these moons are Io, Europa, Ganymede and Callisto.
These moons circle Jupiter around the Jovian equator. In cycles of six years, we view Jupiter’s equator edge-on. So, in 2015, we got to view a number of mutual events involving Jupiter’s moons through a high-powered telescope. Click here or here or here for more details.
Although Jupiter’s axial tilt is only 3o out of perpendicular relative to the ecliptic (Earth’s orbital plane), Jupiter’s axis will tilt enough toward the sun and Earth so that the farthest of these four moons, Callisto, will NOT pass in front of Jupiter or behind Jupiter for a period of about three years, starting in late 2016. During this approximate 3-year period, Callisto will remain “perpetually” visible, alternately swinging “above” and “below” Jupiter.
Click here for a Jupiter’s moons almanac, courtesy of Sky & Telescope.

Throughout December 2016, an imaginary line from Mars through Venus points in the direction of Mercury. The only problem is that Mercury might have set by the time Mars becomes visible. In that case, draw your imaginary line to the horizon, using Mars and Venus. Then the following evening, look at this spot on the horizon for Mercury. Read more.
Mercury in west at dusk/nightfall. Mercury transitioned from the morning to the evening sky on October 27, 2016. This month, in December, Mercury will finally climb high enough from the glare of sunset to view in the evening sky from both the Northern Hemisphere and the Southern Hemisphere.
Possibly, some of you caught the thin waxing crescent moon near Mercury after sunset November 30.
Try viewing Mercury after sunset for a few weeks, centered on or near December 10. Mercury is tricky. If you look too soon, Mercury will be lost in the twilight glare; if you look too late, it will have followed the sun beneath the horizon. Watch for Mercury low in the sky, and near the sunset point on the horizon, seeking for this hidden treasure around 45 to 60 minutes after sunset. Remember, binoculars are always helpful for any Mercury search. Good Luck!
Click here for recommended almanacs; they can give you Mercury’s setting time in your sky.
What do we mean by bright planet? By bright planet, we mean any solar system planet that is easily visible without an optical aid and that has been watched by our ancestors since time immemorial. In their outward order from the sun, the five bright planets are Mercury, Venus, Mars, Jupiter and Saturn. These planets actually do appear bright in our sky. They are typically as bright as – or brighter than – the brightest stars. Plus, these relatively nearby worlds tend to shine with a steadier light than the distant, twinkling stars. You can spot them, and come to know them as faithful friends, if you try.
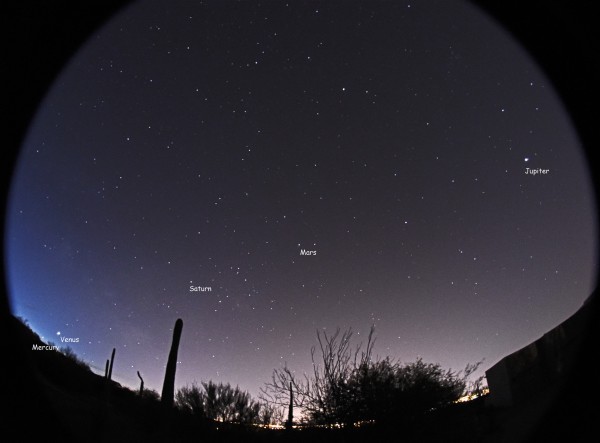
From late January, and through mid-February, 5 bright planets were visible at once in the predawn sky. This image is from February 8, 2016. It’s by Eliot Herman in Tucson, Arizona. View on Flickr.
Bottom line: In December 2016, three of the five bright planets appear in the evening sky at dusk/nightfall: Mercury, Venus and Mars. Jupiter reigns as the sole morning planet, whereas Saturn is lost in the sun’s glare.
Easily locate stars and constellations with EarthSky’s planisphere.
Don’t miss anything. Subscribe to EarthSky News by email
from EarthSky http://ift.tt/IJfHCr
It’ll be easy to spot the moon and Venus in early December, but Mercury will present more of a challenge. You might need binoculars to spot the young moon and Mercury after sunset on November 30. Read more.
Two of the five bright planets rise to great prominence in December 2016. Venus and Jupiter almost seem to balance two sides of our sky. Venus, the brightest planet, blazes in the west first thing at dusk. Jupiter, second-brightest, lords over the eastern half of sky before sunrise. Mars joins Venus in the evening sky, though it’s higher up than Venus and sets in the west after Venus does. Venus and Mars remain evening objects throughout December, but Saturn is now lost in the sun’s glare. We expect the notoriously elusive bright planet Mercury to become visible at dusk/nightfall by early December. Day by day, Mercury climbs upward to reach its greatest evening elongation in the evening sky on December 10. Follow the links below to learn more about planets in December 2016.
Brilliant Venus is the “evening star”
Mars, east of Venus, until mid-to-late evening
Saturn lost in sun’s glare
Bright Jupiter is prominent before dawn
Mercury in west at dusk/nightfall
Like what EarthSky offers? Sign up for our free daily newsletter today!
Astronomy events, star parties, festivals, workshops
Visit a new EarthSky feature – Best Places to Stargaze – and add your fav.
Watch for the waxing crescent moon and the dazzling planet Venus to adorn the evening wilight for several days, centered on December 2 or 3. Read more.
Brilliant Venus is the “evening star.” Okay, it’s not a star. It’s a planet. But people will call it the evening star all the same. In these past weeks, many have noticed Venus and been amazed at its brilliance in the west after sunset. It’s the brightest planet and very, very bright, even though it’s been low in the sky.
Be sure to catch the waxing crescent moon near Venus in early December, as displayed on the sky chart above. Click here for details.
Venus will climb upward from the setting sun throughout the month. Watch for Venus to close the gap between itself and Mars. These two visible evening planets will be closer together on the sky’s dome by the month’s end and closer yet in January 2017.
From mid-northern latitudes (U.S. and Europe), Venus sets about three hours after the sun in early December, and four hours after sunset by the month’s end.
At mid-southern latitudes (Australia and South Africa), Venus sets about about three hours after the sun all month long.
The moon, Venus and Mars as seen from North America on December 4, 2016. But no matter where you reside worldwide, look first for the moon on this date, and then seek out Venus and Mars. Read more
Mars, east of Venus, until mid-to-late evening. After appearing as a bright red light in our sky last May and June, Mars now appears only modestly bright (though still ruddy),above dazzling Venus. Venus is so bright that it pops out almost immediately after sunset, but you’ll have to wait until nightfall to see fainter Mars. Look for the moon close to Mars for a few evenings, centered on or near December 4.
From mid-northern latitudes (U.S. and Europe), look for the red planet Mars to set in the west around 9 to 10 p.m. all month long.
At mid-southern latitudes (Australia and South Africa), Mars sets in the west around 11 p.m. or midnight in early December, and about an hour earlier by the month’s end.
Mars will linger in our sky for several more months. Keep in mind, however, that Earth is traveling away from Mars as we speak – moving far ahead of this planet in the endless race around the sun – so Mars is dimming in our evening sky. Mars is in its long, lingering, relatively inconspicuous phase now. It’ll be still visible in the west to the unaided eye – though not prominent – during its conjunction with Uranus on the evening of February 27, 2017.
Mars won’t make its transition from the evening to the morning sky until July 27, 2017. Even so, Mars’ stature in the evening sky will continue to diminish to that of a rather faint “star,” and we expect few – if any – skywatchers to observe the conjunction of Mars and Mercury in the evening sky on June 28, 2017.
The conjunction of Mars and Venus in the morning sky on October 5, 2017, may well present the first good opportunity to spot Mars in the morning sky when it returns from being behind the sun on July 27, 2017.
Looking for a sky almanac? EarthSky recommends…
View larger | Mikhail Chubarets in the Ukraine made this chart. It shows the view of Mars through a telescope in 2016. We never see Mars as a disk like this with the eye alone. But you can see why Mars was bright to the eye in 2016, and is now fading.
Saturn lost in sun’s glare. Saturn swings behind the sun on December 10, as this world transitions from the evening to morning sky.
In both the Northern and Southern Hemispheres, Saturn might return to visibility in the east before sunrise in very late December 2016. More likely, you’ll have to wait until January 2017 to view Saturn in the morning sky.
Saturn, the farthest world that you can easily view with the eye alone, appears golden in color. It shines with a steady light.
Binoculars don’t reveal Saturn’s gorgeous rings, by the way, although binoculars will enhance Saturn’s golden color. To see the rings, you need a small telescope. A telescope will also reveal one or more of Saturn’s many moons, most notably Titan.
Saturn’s rings are inclined at a little more than 26o from edge-on, exhibiting their northern face. Next year, in October 2017, the rings will open most widely, displaying a maximum inclination of 27o.
As with so much in space (and on Earth), the appearance of Saturn’s rings from Earth is cyclical. In the year 2025, the rings will appear edge-on as seen from Earth. After that, we’ll begin to see the south side of Saturn’s rings, to increase to a maximum inclination of 27o by May 2032.
Click here for recommended almanacs. They can help you know when the planets rise, transit and set in your sky
Tom Wildoner over-exposed Saturn itself to capture this view of Saturn’s moons on June 25, 2016. Visit Tom at LeisurelyScientist.com.
Use the moon to locate Jupiter in the morning sky for several days, centered on or near December 22. Read more.
Bright Jupiter is prominent before dawn. Jupiter’s increasing prominence as the “morning star” will be hard to overlook in December. To see Jupiter, seek out the brightest starlike object in the predawn sky or the morning twilight and that’ll be the king planet Jupiter!
From mid-northern latitudes, like those in the U.S. and Europe, Jupiter rises about 2.5 hours after midnight in early December and around one hour after the midnight hour by the month’s end.
From mid-southern latitudes (Australia), look for Jupiter to rise about 2 hours after midnight in early December and around midnight by the end of the month.
If you’re not a night owl, your best bet for catching Jupiter is to wake up before sunrise to see this brilliant beauty of a planet lighting up the predawn and dawn sky. Watch for the waning crescent moon to join up with Jupiter for several days, centered on or near December 22. See the above sky chart.
By the way, Jupiter shines in front of the constellation Virgo, near Virgo’s brightest star, Spica. Jupiter serves a great reference for learning the constellations of the zodiac, because Jupiter stays in each constellation for roughly a year. So use Jupiter to become familiar with the star Spica and the constellation Virgo, starting now, and throughout 2017.
If you have binoculars or a telescope, it’s fairly easy to see Jupiter’s four major moons, which look like pinpricks of light on or near the same plane. They are often called the Galilean moons to honor Galileo, who discovered these great Jovian moons in 1610. In their order from Jupiter, these moons are Io, Europa, Ganymede and Callisto.
These moons circle Jupiter around the Jovian equator. In cycles of six years, we view Jupiter’s equator edge-on. So, in 2015, we got to view a number of mutual events involving Jupiter’s moons through a high-powered telescope. Click here or here or here for more details.
Although Jupiter’s axial tilt is only 3o out of perpendicular relative to the ecliptic (Earth’s orbital plane), Jupiter’s axis will tilt enough toward the sun and Earth so that the farthest of these four moons, Callisto, will NOT pass in front of Jupiter or behind Jupiter for a period of about three years, starting in late 2016. During this approximate 3-year period, Callisto will remain “perpetually” visible, alternately swinging “above” and “below” Jupiter.
Click here for a Jupiter’s moons almanac, courtesy of Sky & Telescope.
Throughout December 2016, an imaginary line from Mars through Venus points in the direction of Mercury. The only problem is that Mercury might have set by the time Mars becomes visible. In that case, draw your imaginary line to the horizon, using Mars and Venus. Then the following evening, look at this spot on the horizon for Mercury. Read more.
Mercury in west at dusk/nightfall. Mercury transitioned from the morning to the evening sky on October 27, 2016. This month, in December, Mercury will finally climb high enough from the glare of sunset to view in the evening sky from both the Northern Hemisphere and the Southern Hemisphere.
Possibly, some of you caught the thin waxing crescent moon near Mercury after sunset November 30.
Try viewing Mercury after sunset for a few weeks, centered on or near December 10. Mercury is tricky. If you look too soon, Mercury will be lost in the twilight glare; if you look too late, it will have followed the sun beneath the horizon. Watch for Mercury low in the sky, and near the sunset point on the horizon, seeking for this hidden treasure around 45 to 60 minutes after sunset. Remember, binoculars are always helpful for any Mercury search. Good Luck!
Click here for recommended almanacs; they can give you Mercury’s setting time in your sky.
What do we mean by bright planet? By bright planet, we mean any solar system planet that is easily visible without an optical aid and that has been watched by our ancestors since time immemorial. In their outward order from the sun, the five bright planets are Mercury, Venus, Mars, Jupiter and Saturn. These planets actually do appear bright in our sky. They are typically as bright as – or brighter than – the brightest stars. Plus, these relatively nearby worlds tend to shine with a steadier light than the distant, twinkling stars. You can spot them, and come to know them as faithful friends, if you try.
From late January, and through mid-February, 5 bright planets were visible at once in the predawn sky. This image is from February 8, 2016. It’s by Eliot Herman in Tucson, Arizona. View on Flickr.
Bottom line: In December 2016, three of the five bright planets appear in the evening sky at dusk/nightfall: Mercury, Venus and Mars. Jupiter reigns as the sole morning planet, whereas Saturn is lost in the sun’s glare.
Easily locate stars and constellations with EarthSky’s planisphere.
Don’t miss anything. Subscribe to EarthSky News by email
from EarthSky http://ift.tt/IJfHCr