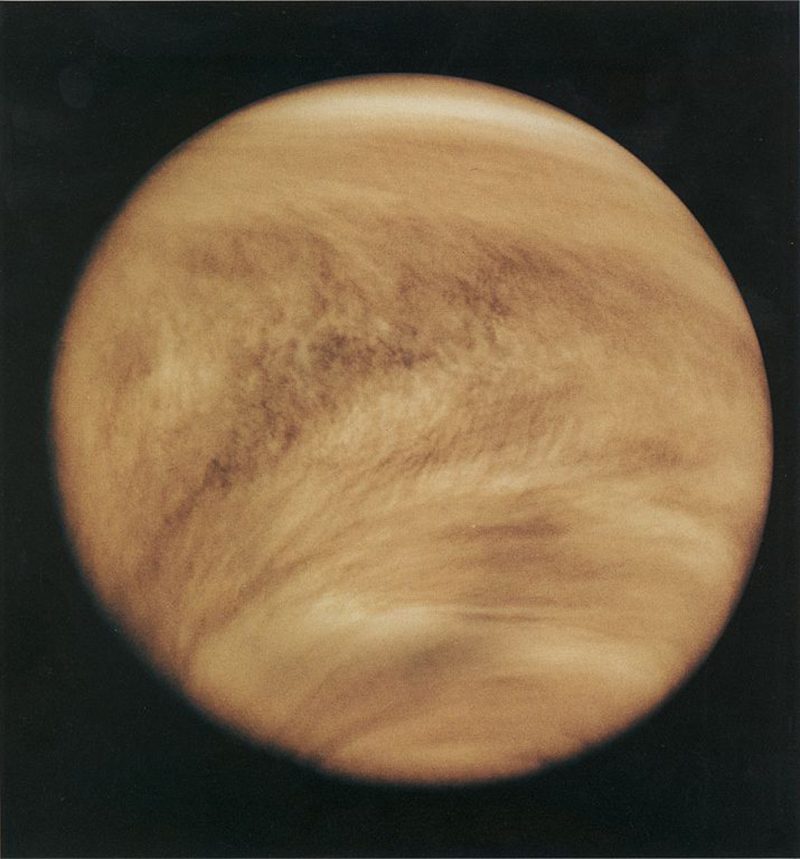
Composite image of Venus’ atmosphere from the Japanese probe Akatsuki (Venus Climate Orbiter). Dark patches in the atmosphere are still unexplained, but appear to affect the planet’s albedo and climate. Image via Institute of Space And Astronautical Science/Japan Aerospace Exploration Agency/University of Wisconsin-Madison.
Despite being Earth’s closest planetary neighbor, Venus is still literally shrouded in mystery. Although multiple spacecraft have orbited and landed on this hellish world, the extreme conditions make such visits, the surface ones at least, very brief. But one of Venus’ most interesting anomalies is higher up: odd dark patches in the upper atmosphere that still haven’t been explained.
Now, a new study shows that these patches – called “unknown absorbers” – appear to be linked to Venus’ climate and albedo.
The peer-reviewed study was published in The Astronomical Journal on August 26, 2019.
The patches are composed of tiny particles that soak up most of the ultraviolet and some of the visible light from the sun, affecting the planet’s albedo and energy budget.
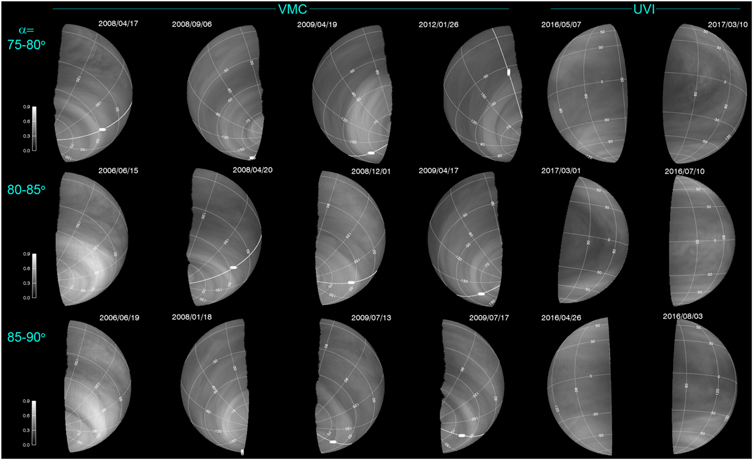
Albedo changes in the top cloud layers of Venus’ atmosphere, as seen by Venus Express and Akatsuki between 2006 and 2017. Image via Yeon Too Lee et al/The Astronomical Journal.
These changes in the reflectivity of Venus’ perpetual cloud cover then affect Venus’ weather patterns and climate. Just like Earth, Venus’ weather is driven by solar radiation. As outlined in the new study, scientists now have a better idea of how that weather is influenced by changing reflectivity in the clouds. The researchers used a suite of satellites to monitor the long-term variations in ultraviolet light. As Sanjay Limaye, a planetary scientist at University of Wisconsin–Madison, explained:
The difference between Earth and Venus is that on Earth most of the energy from the sun is absorbed at ground level while on Venus most of the heat is deposited in the clouds.
Venus’ albedo had been observed to diminish by about half between 2006 and 2017, before then returning to normal. This affected the upper atmosphere, including variations in the “super-rotation,” which is driven by winds exceeding 200 miles per hour (322 kph). This is evidence for a link between solar heating and the powerful gusts that underpin the dynamics of the planet’s upper atmosphere. According to Mark Bullock of the Southwest Research Institute:
What really struck me about this paper is that it shows that Venus’ climate has decadal-long climate variations, just like the Earth. Even more amazing, the strength of the climate oscillation on Venus is much greater than Earth’s long-term variations.
Venus as seen in ultraviolet by the Pioneer-Venus Orbiter in 1979. Image via NASA/Phys.org.
Limaye added:
That is a striking result. It suggests that something is changing. We can see the change in brightness. If the albedo is changing, something is driving those changes. The question is, what is the cause?
While it has been shown that the patches can affect Venus’ climate and albedo, it still isn’t known exactly what they are. Various theories have been postulated, as Yeon Joo Lee, senior author of the new paper, noted:
The particles that make up the dark splotches, have been suggested to be ferric chloride, allotropes of sulfur, disulfur dioxide and so on, but none of these, so far, are able to satisfactorily explain their formation and absorption properties.
Lee posed further questions about Venus’ atmospheric dynamics:
Is solar ultraviolet light impacting Venus’ cloud cover? Are cosmic rays – subatomic particles from space that continuously rain down on all the planets – affecting cloud cover by triggering cloud nucleation? Would the planetary sulfuric dioxide affect the formation of sulfuric acid cloud?
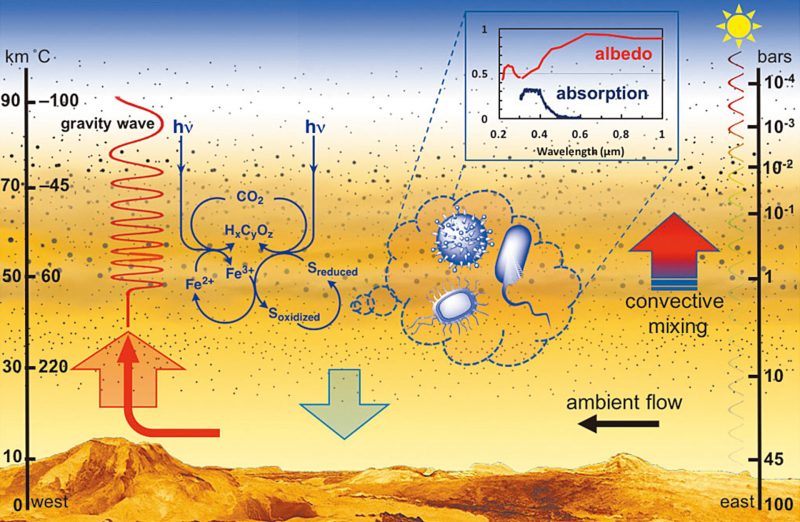
The most tantalizing possibility to explain the dark patches is that they are composed of microorganisms, similar to ones that inhabit Earth’s upper atmosphere. Image via Limaye et al, doi: 10.1089/ast.2017.1783/Sci-News.
But there is another possibility – also mentioned by no less than biophysicist Harold Morowitz and astronomer Carl Sagan – that the particles in the patches could be microscopic life. Yes, microbes, floating in the upper atmosphere of the hottest planet in the solar system. This may sound far-fetched, especially for Venus, but Limaye himself noted that observations indicate the particles are about the same size and have the same light-absorbing properties as microorganisms found in Earth’s atmosphere. This isn’t proof of life, not yet anyway, but it is a tantalizing thought. Conditions in the upper atmosphere of Venus are actually quite hospitable temperature- and pressure-wise, with more water vapor available.
An earlier study by Limaye revisited this old idea. As he noted:
Venus shows some episodic dark, sulfuric rich patches, with contrasts up to 30-40% in UV, and muted in longer wavelengths. These patches persist for days, changing their shape and contrasts continuously and appear to be scale dependent. The patches could be something akin to the algae blooms that occur routinely in the lakes and oceans of Earth.
Whatever the explanation is, as of now there are still a lot of questions.

Another mission will be needed to solve the mystery of Venus’ dark patches, perhaps like the proposed Venus Atmospheric Maneuverable Platform (VAMP). Image via Northrop Grumman.
The only way to definitively solve this mystery will be to return to Venus, perhaps with specialized CubeSats or the Venus Atmospheric Maneuverable Platform (VAMP). According to Limaye:
One possibility for sampling the clouds of Venus is on the drawing board – the Venus Atmospheric Maneuverable Platform (VAMP) – a craft that flies like a plane but floats like a blimp and could stay aloft in the planet’s cloud layer for up to a year gathering data and samples. Such a platform could include instruments like Raman Lidar, meteorological and chemical sensors, and spectrometers. It could also carry a type of microscope capable of identifying living microorganisms.
Bottom line: Scientists have found that unusual dark patches in Venus’ atmosphere affect the planet’s climate, but they don’t know what those patches actually are. Some studies suggest they may be composed of microbes.
Source: Venus’ Spectral Signatures and the Potential for Life in the Clouds
Via University of Wisconsin-Madison News
from EarthSky https://ift.tt/2zQXq7H
Composite image of Venus’ atmosphere from the Japanese probe Akatsuki (Venus Climate Orbiter). Dark patches in the atmosphere are still unexplained, but appear to affect the planet’s albedo and climate. Image via Institute of Space And Astronautical Science/Japan Aerospace Exploration Agency/University of Wisconsin-Madison.
Despite being Earth’s closest planetary neighbor, Venus is still literally shrouded in mystery. Although multiple spacecraft have orbited and landed on this hellish world, the extreme conditions make such visits, the surface ones at least, very brief. But one of Venus’ most interesting anomalies is higher up: odd dark patches in the upper atmosphere that still haven’t been explained.
Now, a new study shows that these patches – called “unknown absorbers” – appear to be linked to Venus’ climate and albedo.
The peer-reviewed study was published in The Astronomical Journal on August 26, 2019.
The patches are composed of tiny particles that soak up most of the ultraviolet and some of the visible light from the sun, affecting the planet’s albedo and energy budget.
Albedo changes in the top cloud layers of Venus’ atmosphere, as seen by Venus Express and Akatsuki between 2006 and 2017. Image via Yeon Too Lee et al/The Astronomical Journal.
These changes in the reflectivity of Venus’ perpetual cloud cover then affect Venus’ weather patterns and climate. Just like Earth, Venus’ weather is driven by solar radiation. As outlined in the new study, scientists now have a better idea of how that weather is influenced by changing reflectivity in the clouds. The researchers used a suite of satellites to monitor the long-term variations in ultraviolet light. As Sanjay Limaye, a planetary scientist at University of Wisconsin–Madison, explained:
The difference between Earth and Venus is that on Earth most of the energy from the sun is absorbed at ground level while on Venus most of the heat is deposited in the clouds.
Venus’ albedo had been observed to diminish by about half between 2006 and 2017, before then returning to normal. This affected the upper atmosphere, including variations in the “super-rotation,” which is driven by winds exceeding 200 miles per hour (322 kph). This is evidence for a link between solar heating and the powerful gusts that underpin the dynamics of the planet’s upper atmosphere. According to Mark Bullock of the Southwest Research Institute:
What really struck me about this paper is that it shows that Venus’ climate has decadal-long climate variations, just like the Earth. Even more amazing, the strength of the climate oscillation on Venus is much greater than Earth’s long-term variations.
Venus as seen in ultraviolet by the Pioneer-Venus Orbiter in 1979. Image via NASA/Phys.org.
Limaye added:
That is a striking result. It suggests that something is changing. We can see the change in brightness. If the albedo is changing, something is driving those changes. The question is, what is the cause?
While it has been shown that the patches can affect Venus’ climate and albedo, it still isn’t known exactly what they are. Various theories have been postulated, as Yeon Joo Lee, senior author of the new paper, noted:
The particles that make up the dark splotches, have been suggested to be ferric chloride, allotropes of sulfur, disulfur dioxide and so on, but none of these, so far, are able to satisfactorily explain their formation and absorption properties.
Lee posed further questions about Venus’ atmospheric dynamics:
Is solar ultraviolet light impacting Venus’ cloud cover? Are cosmic rays – subatomic particles from space that continuously rain down on all the planets – affecting cloud cover by triggering cloud nucleation? Would the planetary sulfuric dioxide affect the formation of sulfuric acid cloud?
The most tantalizing possibility to explain the dark patches is that they are composed of microorganisms, similar to ones that inhabit Earth’s upper atmosphere. Image via Limaye et al, doi: 10.1089/ast.2017.1783/Sci-News.
But there is another possibility – also mentioned by no less than biophysicist Harold Morowitz and astronomer Carl Sagan – that the particles in the patches could be microscopic life. Yes, microbes, floating in the upper atmosphere of the hottest planet in the solar system. This may sound far-fetched, especially for Venus, but Limaye himself noted that observations indicate the particles are about the same size and have the same light-absorbing properties as microorganisms found in Earth’s atmosphere. This isn’t proof of life, not yet anyway, but it is a tantalizing thought. Conditions in the upper atmosphere of Venus are actually quite hospitable temperature- and pressure-wise, with more water vapor available.
An earlier study by Limaye revisited this old idea. As he noted:
Venus shows some episodic dark, sulfuric rich patches, with contrasts up to 30-40% in UV, and muted in longer wavelengths. These patches persist for days, changing their shape and contrasts continuously and appear to be scale dependent. The patches could be something akin to the algae blooms that occur routinely in the lakes and oceans of Earth.
Whatever the explanation is, as of now there are still a lot of questions.
Another mission will be needed to solve the mystery of Venus’ dark patches, perhaps like the proposed Venus Atmospheric Maneuverable Platform (VAMP). Image via Northrop Grumman.
The only way to definitively solve this mystery will be to return to Venus, perhaps with specialized CubeSats or the Venus Atmospheric Maneuverable Platform (VAMP). According to Limaye:
One possibility for sampling the clouds of Venus is on the drawing board – the Venus Atmospheric Maneuverable Platform (VAMP) – a craft that flies like a plane but floats like a blimp and could stay aloft in the planet’s cloud layer for up to a year gathering data and samples. Such a platform could include instruments like Raman Lidar, meteorological and chemical sensors, and spectrometers. It could also carry a type of microscope capable of identifying living microorganisms.
Bottom line: Scientists have found that unusual dark patches in Venus’ atmosphere affect the planet’s climate, but they don’t know what those patches actually are. Some studies suggest they may be composed of microbes.
Source: Venus’ Spectral Signatures and the Potential for Life in the Clouds
Via University of Wisconsin-Madison News
from EarthSky https://ift.tt/2zQXq7H