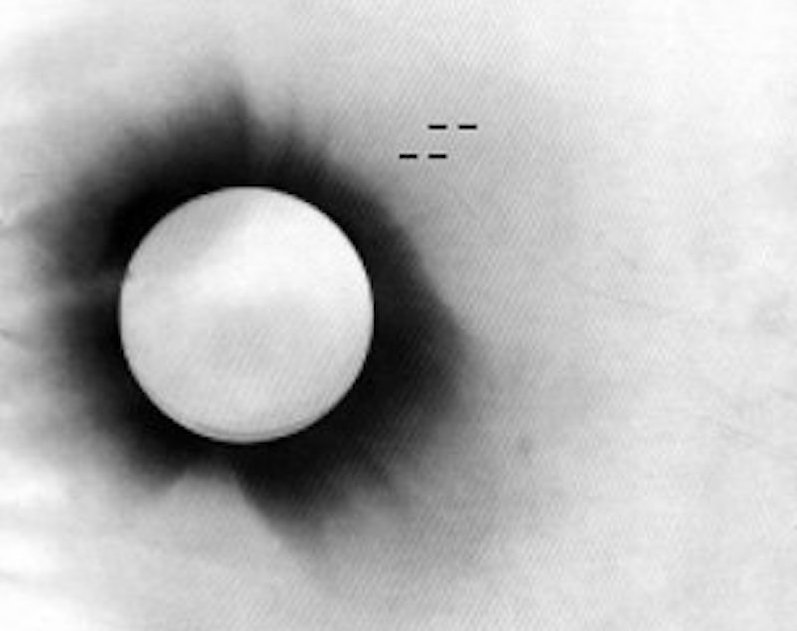
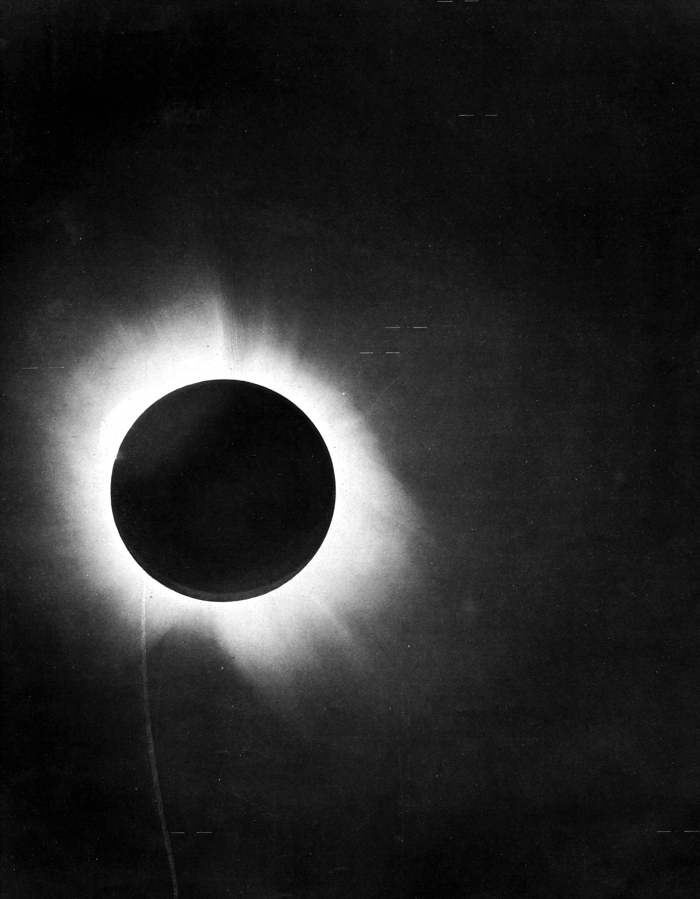
One of Sir Arthur Eddington’s photographs of the total solar eclipse of May 29, 1919. Eddington’s observations during this eclipse proved Einstein’s prediction of the bending of light around the sun. Notice the tick marks around stars near the eclipsed sun. It was the precise measurement of the positions of these stars with respect to the edge of the sun that proved Einstein’s theory. Image via Wikimedia Commons.
May 29, 1919. Today is the 100th anniversary of a total solar eclipse used to test Albert Einstein’s revolutionary theory of gravity, known as general relativity. Einstein himself was relatively unknown at the time. He’d proposed general relativity in 1915, and scientists had been intrigued by the entirely new way of thinking about gravity – for example, the idea that mass causes space to curve – but no one had proven Einstein correct. Then, on May 29, 1919, an expedition of English scientists – led by Sir Arthur Eddington – traveled to the island of Principe off the west coast of Africa to observe a total solar eclipse. The scientists’ measurements during the eclipse showed that, astoundingly, Einstein’s predictions were correct. Stars could be seen at the edge of the sun during the eclipse, while the moon blocked the sun’s light. The stars’ locations appeared displaced, due to the fact that their light had to travel to us, not on a straight path, but on the curved space around the sun, as described by Einstein.
Later that year – on November 6, 1919, in London – England’s Astronomer Royal Frank Dyson presented the results at a joint meeting of the Royal Astronomical Society and the Royal Society. Dyson said “there can be no doubt” that measurements made during the May 29, 1919, solar eclipse “confirm Einstein’s prediction.” In a recent story celebrating the 100th anniversary of this legendary solar eclipse, Caltech physicist Sean Carroll explained to NBCNews:
General relativity was the poster child for being a crazy, new, hard-to-understand theory, with dramatic implications for the nature of reality. And yet you could see [the results]; you could photograph it. So people got caught up in that excitement.
And so Albert Einstein was catapulted to rock star fame, to a status in popular culture he has retained ever since.
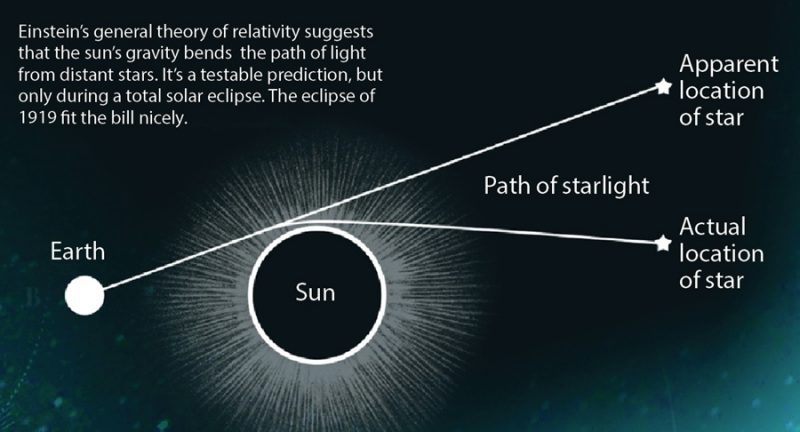
Diagram showing what the English astronomers measured in 1919. They saw stars that should have been hidden behind the sun located to one side of the sun. Why? Because – just as Einstein’s theory said it should – light bends in the presence of mass, in this case the mass of a star, our sun. Rather than traveling a straight path, the light of distant stars was forced to travel a curved path on the curved space near the sun. Image via GSFC/NASA/DiscoverMagazine.com.
Einstein’s general theory of relativity underlies our most basic modern cosmology, our way of looking at the universe as a whole. Before Einstein, scientists relied on Isaac Newton’s theory of gravity, and Newton’s way of looking at gravity is still valid and is still taught to physics students. Einstein’s theory is a refinement of scientists’ understanding of gravity … and what a mind-blowing refinement! Einstein proposed that mass causes space to curve. So, for example, although there appears to be a “force” (as described by Newton) that causes our Earth to be pulled towards the sun by gravity, in fact, there’s no such force. According to Einstein, Earth is simply traveling in curved space around the sun.
Einstein’s general theory of relativity not only explains the motion of Earth and the other planets in our solar system. In our modern cosmology, it also describes extreme examples of curved space, such as that around black holes. And it helps to describe the history and expansion of the universe as a whole.
In the century since the 1919 total solar eclipse, Einstein’s relativity theory has been proven again and again, in many different ways. You might have seen the recent first-ever photo of a black hole?. It also proved, once again, that Einstein was right.
Read more: Black hole image confirms Einstein’s relativity theory
Read more: Clocks, gravity and the limits of relativity
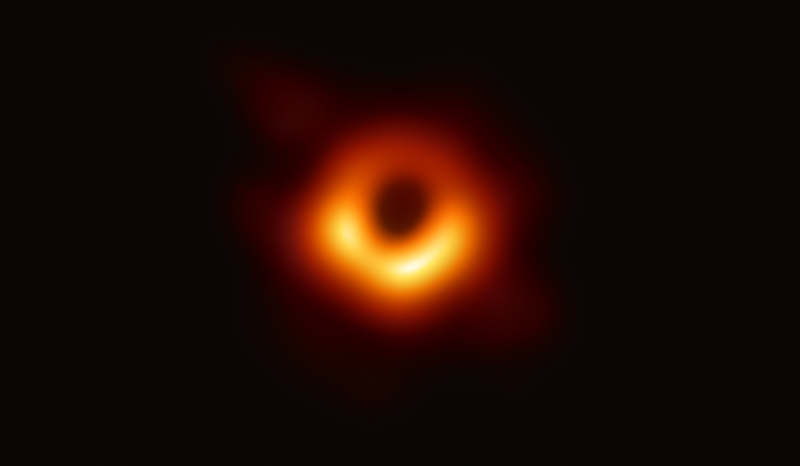
This image captured people’s imaginations earlier this year, when it was first released: the first-ever real photo of a giant black hole, in the center of galaxy M87. This image also proves Einstein’s theory, which predicted the observations from M87 with unerring accuracy. Image via Event Horizon Telescope Collaboration.
The Royal Astronomical Society (RAS) recently spoke of modern-day practical applications of Einstein’s theory:
The theory fundamentally changed our understanding of physics and astronomy, and underpins critical modern technologies such as the satellite-based Global Positioning System (GPS).
The theory of relativity is essential for the correct operation of GPS systems, which in turn are relied on in many common applications including vehicle satellite navigation (SatNav) systems, weather forecasting, and disaster relief and emergency services. However, the world had to wait decades before the applications of such a blue skies result could be realized.
The RAS also said that celebrations are underway across the globe to commemorate 100 years since the U.K.-led expedition confirmed Einstein’s theory. It said:
A series of public events in the U.K. and around the world will mark this seminal anniversary.
… Celebratory activities will be taking place in the U.K., Portugal, Principe, Sobral and around the world: more information on all of the events can be found on the Eclipse 1919 events page.
Mike Cruise, President of the Royal Astronomical Society, said:
A century ago astronomers confirmed the general theory of relativity – in the process transforming our understanding of the universe forever. The work of Einstein and Eddington is an amazing example of international collaboration in the aftermath of the first world war, and a visible demonstration of how science can overcome barriers in these turbulent times.
In November the RAS and Royal Society will host a conference and public event marking the 100th anniversary of the announcement of the results. The commemoration forms part of the centenary of the International Astronomical Union, founded in 1919, with more than 200 schools around the world signed up to explore the role of gravity in astronomy.
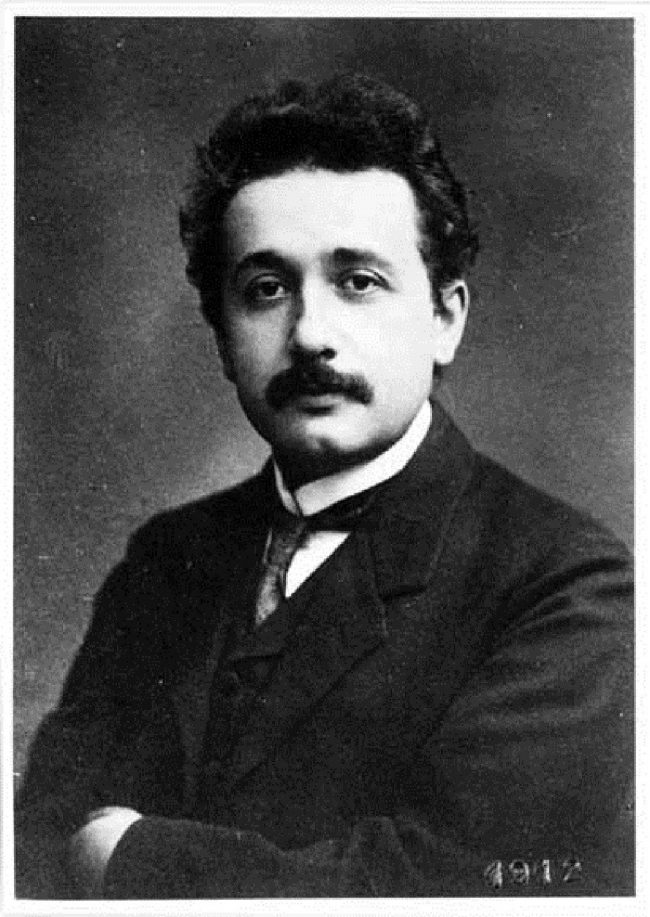
Albert Einstein in 1912.
Bottom line: On May 29, 1919, astronomer Sir Arthur Eddington verified Einstein’s general theory of relativity by observing the apparent deflection of stars from their normal positions during a solar eclipse. This happens because, according to Einstein’s theory, the path of light is bent by gravity when it travels close to a massive object like our sun.
Via RAS, NBCNews, DiscoverMagazine.com
from EarthSky http://bit.ly/2I513Lf
One of Sir Arthur Eddington’s photographs of the total solar eclipse of May 29, 1919. Eddington’s observations during this eclipse proved Einstein’s prediction of the bending of light around the sun. Notice the tick marks around stars near the eclipsed sun. It was the precise measurement of the positions of these stars with respect to the edge of the sun that proved Einstein’s theory. Image via Wikimedia Commons.
May 29, 1919. Today is the 100th anniversary of a total solar eclipse used to test Albert Einstein’s revolutionary theory of gravity, known as general relativity. Einstein himself was relatively unknown at the time. He’d proposed general relativity in 1915, and scientists had been intrigued by the entirely new way of thinking about gravity – for example, the idea that mass causes space to curve – but no one had proven Einstein correct. Then, on May 29, 1919, an expedition of English scientists – led by Sir Arthur Eddington – traveled to the island of Principe off the west coast of Africa to observe a total solar eclipse. The scientists’ measurements during the eclipse showed that, astoundingly, Einstein’s predictions were correct. Stars could be seen at the edge of the sun during the eclipse, while the moon blocked the sun’s light. The stars’ locations appeared displaced, due to the fact that their light had to travel to us, not on a straight path, but on the curved space around the sun, as described by Einstein.
Later that year – on November 6, 1919, in London – England’s Astronomer Royal Frank Dyson presented the results at a joint meeting of the Royal Astronomical Society and the Royal Society. Dyson said “there can be no doubt” that measurements made during the May 29, 1919, solar eclipse “confirm Einstein’s prediction.” In a recent story celebrating the 100th anniversary of this legendary solar eclipse, Caltech physicist Sean Carroll explained to NBCNews:
General relativity was the poster child for being a crazy, new, hard-to-understand theory, with dramatic implications for the nature of reality. And yet you could see [the results]; you could photograph it. So people got caught up in that excitement.
And so Albert Einstein was catapulted to rock star fame, to a status in popular culture he has retained ever since.
Diagram showing what the English astronomers measured in 1919. They saw stars that should have been hidden behind the sun located to one side of the sun. Why? Because – just as Einstein’s theory said it should – light bends in the presence of mass, in this case the mass of a star, our sun. Rather than traveling a straight path, the light of distant stars was forced to travel a curved path on the curved space near the sun. Image via GSFC/NASA/DiscoverMagazine.com.
Einstein’s general theory of relativity underlies our most basic modern cosmology, our way of looking at the universe as a whole. Before Einstein, scientists relied on Isaac Newton’s theory of gravity, and Newton’s way of looking at gravity is still valid and is still taught to physics students. Einstein’s theory is a refinement of scientists’ understanding of gravity … and what a mind-blowing refinement! Einstein proposed that mass causes space to curve. So, for example, although there appears to be a “force” (as described by Newton) that causes our Earth to be pulled towards the sun by gravity, in fact, there’s no such force. According to Einstein, Earth is simply traveling in curved space around the sun.
Einstein’s general theory of relativity not only explains the motion of Earth and the other planets in our solar system. In our modern cosmology, it also describes extreme examples of curved space, such as that around black holes. And it helps to describe the history and expansion of the universe as a whole.
In the century since the 1919 total solar eclipse, Einstein’s relativity theory has been proven again and again, in many different ways. You might have seen the recent first-ever photo of a black hole?. It also proved, once again, that Einstein was right.
Read more: Black hole image confirms Einstein’s relativity theory
Read more: Clocks, gravity and the limits of relativity
This image captured people’s imaginations earlier this year, when it was first released: the first-ever real photo of a giant black hole, in the center of galaxy M87. This image also proves Einstein’s theory, which predicted the observations from M87 with unerring accuracy. Image via Event Horizon Telescope Collaboration.
The Royal Astronomical Society (RAS) recently spoke of modern-day practical applications of Einstein’s theory:
The theory fundamentally changed our understanding of physics and astronomy, and underpins critical modern technologies such as the satellite-based Global Positioning System (GPS).
The theory of relativity is essential for the correct operation of GPS systems, which in turn are relied on in many common applications including vehicle satellite navigation (SatNav) systems, weather forecasting, and disaster relief and emergency services. However, the world had to wait decades before the applications of such a blue skies result could be realized.
The RAS also said that celebrations are underway across the globe to commemorate 100 years since the U.K.-led expedition confirmed Einstein’s theory. It said:
A series of public events in the U.K. and around the world will mark this seminal anniversary.
… Celebratory activities will be taking place in the U.K., Portugal, Principe, Sobral and around the world: more information on all of the events can be found on the Eclipse 1919 events page.
Mike Cruise, President of the Royal Astronomical Society, said:
A century ago astronomers confirmed the general theory of relativity – in the process transforming our understanding of the universe forever. The work of Einstein and Eddington is an amazing example of international collaboration in the aftermath of the first world war, and a visible demonstration of how science can overcome barriers in these turbulent times.
In November the RAS and Royal Society will host a conference and public event marking the 100th anniversary of the announcement of the results. The commemoration forms part of the centenary of the International Astronomical Union, founded in 1919, with more than 200 schools around the world signed up to explore the role of gravity in astronomy.
Albert Einstein in 1912.
Bottom line: On May 29, 1919, astronomer Sir Arthur Eddington verified Einstein’s general theory of relativity by observing the apparent deflection of stars from their normal positions during a solar eclipse. This happens because, according to Einstein’s theory, the path of light is bent by gravity when it travels close to a massive object like our sun.
Via RAS, NBCNews, DiscoverMagazine.com
from EarthSky http://bit.ly/2I513Lf