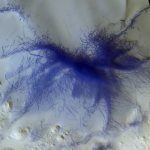
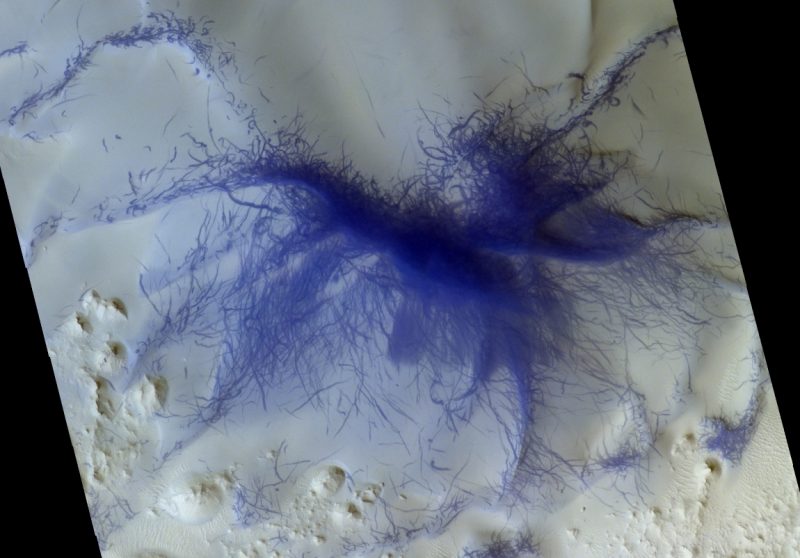
A “frenzy” of dust devil tracks in the Terra Sabaea region of Mars, as seen by TGO. The image is a color-composite representation where features that are bluer compared to the average color of Mars are shown in bright blue hues. Image via ESA/Roscosmos/CaSSIS, CC BY-SA 3.0 IGO.
Far from being just a cratered desert, Mars is a scenic and beautiful planet, with stunningly diverse landscapes. Many thousands of images have been taken by both orbiters and landers, with some of the most recent ones shown on this page. They are from the Trace Gas Orbiter (TGO), part of the European Space Agency’s ExoMars mission.
The new images include everything from surreal landscapes, water-formed minerals and 3D stereo views, to NASA’s InSight lander sitting on the surface.
The image of InSight is of particular significance – it’s the first time that a European orbiter has photographed a lander on the surface of Mars. TGO and InSight are also working together, as explained last month by Nicolas Thomas, CaSSIS Principal Investigator, from the University of Bern in Switzerland:
The ExoMars Trace Gas Orbiter is being used to relay data from InSight to Earth. Because of this function, to avoid uncertainties in communications, we had not been able to point the camera towards the landing site so far – we had to wait until the landing site passed directly under the spacecraft to get this image.
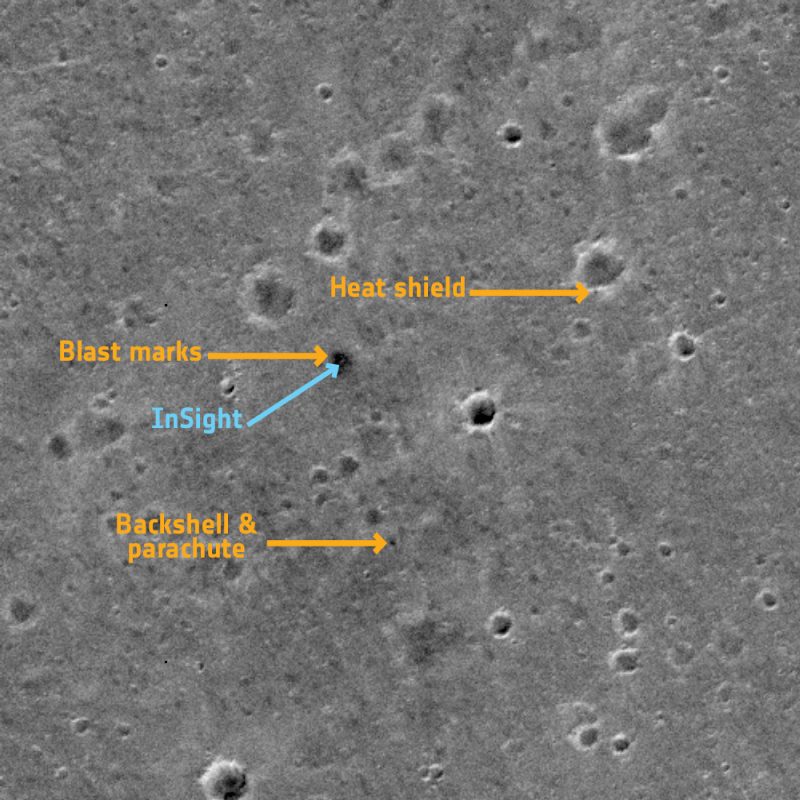
NASA’s InSight lander as seen from orbit by ESA’s Trace Gas Orbiter. Image via ESA/Roscosmos/CaSSIS, CC BY-SA 3.0 IGO.
The image from TGO – in the Elysium Planitia region – covers an area of about 2.25 x 2.25 km in size; at that scale, InSight just looks like a bright dot on the relatively flat landscape. A dark patch surrounds the lander, caused by the retro rockets as the lander touched down. The heat shield and back shell are also visible in the image.
Various rovers have also been photographed from orbit, and even their wheel tracks can be seen. InSight is a stationary lander however, so it will always remain in the same spot.
The CaSSIS system can also monitor the region surrounding InSight, including keeping watch for things like meteorite impacts – another great way that completely different missions, from different countries, can work together in Mars exploration.
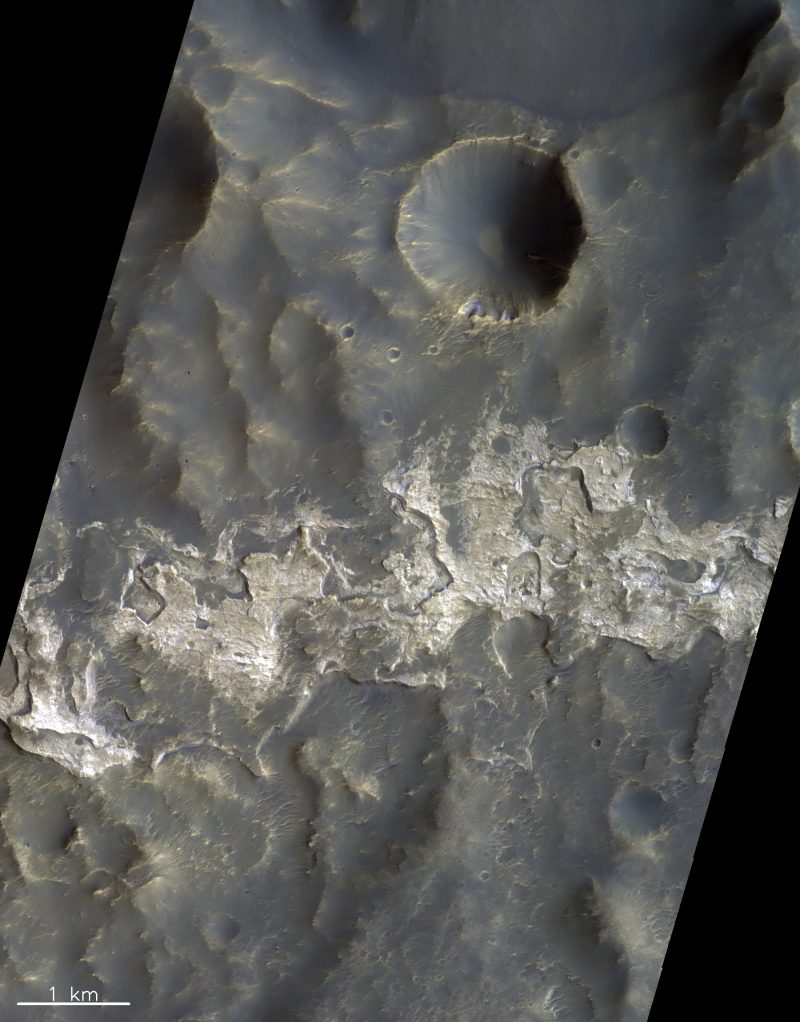
Sulphate deposits in Columbus Crater in the southern hemisphere of Mars. Image via ESA/Roscosmos/CaSSIS, CC BY-SA 3.0 IGO.
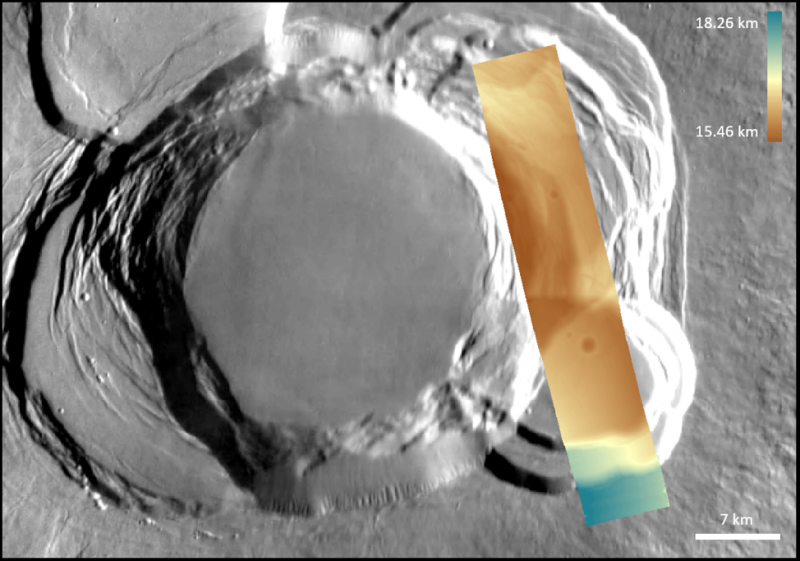
Digital terrain model of the volcanic caldera on Ascraeus Mons, in the Tharsis region. Image via ESA/Roscosmos/CaSSIS.
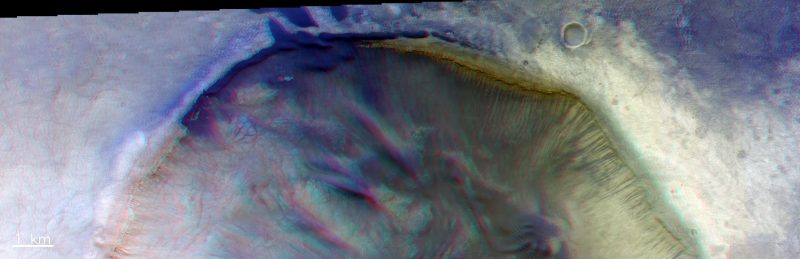
3-D view of dunes cascading over the edge of Green Crater in the Noachis Terra region. Image via ESA/Roscosmos/CaSSIS, CC BY-SA 3.0 IGO.
CaSSIS will also be used when the next part of the ExoMars mission arrives in 2021 – the Rosalind Franklin rover, for both imaging and data relay.
The new image of InSight is just one of many new images released; others cover a wide variety of landscape features, such as layered deposits in the polar regions, dynamic dunes and the effects of converging dust devils. The 3-D stereo images bring an extra sense of reality to the images, so that it is almost like actually being there. Color-composite images can better highlight the differences in surface features, helping scientists find regions that have been altered by water in the past and guide future exploration missions. All of these are valuable, as explained by Thomas:
The InSight landing site image is just one of many really high quality images that we have been receiving. All of the images we’re sharing today represent some of the best from the last few months. We’re also really pleased with the digital terrain models.
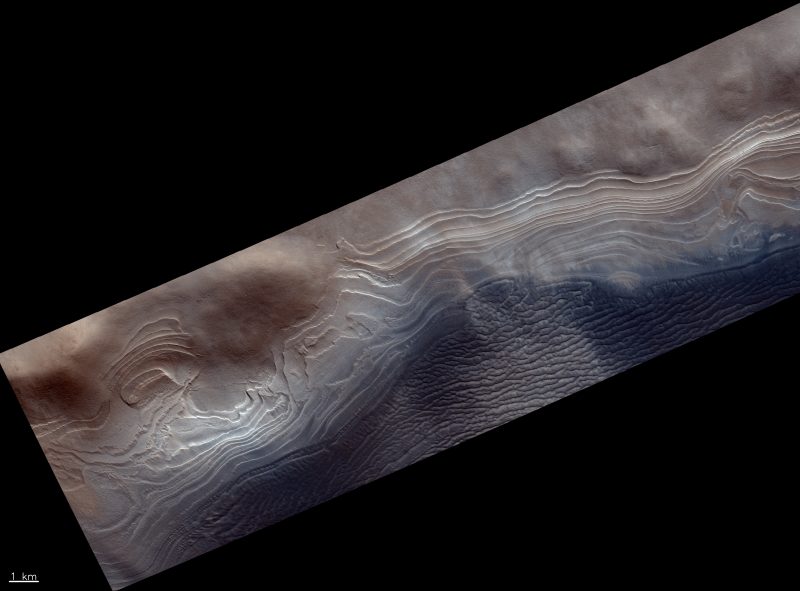
South polar layered terrains in Burroughs Crater near the south polar cap. Image via ESA/Roscosmos/CaSSIS, CC BY-SA 3.0 IGO.
As also noted by Håkan Svedhem, ESA’s TGO project scientist:
This stunning image showcase really demonstrates the scientific potential we have with TGO’s imaging system. Over the course of the mission we’ll be able to investigate dynamic surface processes, including those that might also help to constrain the atmospheric gas inventory that TGO’s spectrometers have been analyzing, as well as characterise future landing sites.
TGO’s primary mission is to search for trace gases in the martian atmosphere – including methane, which could be a sign of either active geology or biology. Oddly, it hasn’t found any methane yet, although the gas has been confirmed previously by the Curiosity rover and multiple telescopes on Earth. The answer may lie in the fact that Curiosity documented a seasonal variation in the methane at its location in Gale Crater. TGO may have just looked at the wrong time, but it will continue to monitor the atmosphere in the months and years ahead.
The entire TGO image library can be seen here.
Bottom line: This fantastic collection of new images from TGO – like others – helps to show Mars as it really is, a world of diverse landscapes that in some ways are reminiscent of Earth, while also uniquely alien.
from EarthSky https://ift.tt/2WJ6pBr
A “frenzy” of dust devil tracks in the Terra Sabaea region of Mars, as seen by TGO. The image is a color-composite representation where features that are bluer compared to the average color of Mars are shown in bright blue hues. Image via ESA/Roscosmos/CaSSIS, CC BY-SA 3.0 IGO.
Far from being just a cratered desert, Mars is a scenic and beautiful planet, with stunningly diverse landscapes. Many thousands of images have been taken by both orbiters and landers, with some of the most recent ones shown on this page. They are from the Trace Gas Orbiter (TGO), part of the European Space Agency’s ExoMars mission.
The new images include everything from surreal landscapes, water-formed minerals and 3D stereo views, to NASA’s InSight lander sitting on the surface.
The image of InSight is of particular significance – it’s the first time that a European orbiter has photographed a lander on the surface of Mars. TGO and InSight are also working together, as explained last month by Nicolas Thomas, CaSSIS Principal Investigator, from the University of Bern in Switzerland:
The ExoMars Trace Gas Orbiter is being used to relay data from InSight to Earth. Because of this function, to avoid uncertainties in communications, we had not been able to point the camera towards the landing site so far – we had to wait until the landing site passed directly under the spacecraft to get this image.
NASA’s InSight lander as seen from orbit by ESA’s Trace Gas Orbiter. Image via ESA/Roscosmos/CaSSIS, CC BY-SA 3.0 IGO.
The image from TGO – in the Elysium Planitia region – covers an area of about 2.25 x 2.25 km in size; at that scale, InSight just looks like a bright dot on the relatively flat landscape. A dark patch surrounds the lander, caused by the retro rockets as the lander touched down. The heat shield and back shell are also visible in the image.
Various rovers have also been photographed from orbit, and even their wheel tracks can be seen. InSight is a stationary lander however, so it will always remain in the same spot.
The CaSSIS system can also monitor the region surrounding InSight, including keeping watch for things like meteorite impacts – another great way that completely different missions, from different countries, can work together in Mars exploration.
Sulphate deposits in Columbus Crater in the southern hemisphere of Mars. Image via ESA/Roscosmos/CaSSIS, CC BY-SA 3.0 IGO.
Digital terrain model of the volcanic caldera on Ascraeus Mons, in the Tharsis region. Image via ESA/Roscosmos/CaSSIS.
3-D view of dunes cascading over the edge of Green Crater in the Noachis Terra region. Image via ESA/Roscosmos/CaSSIS, CC BY-SA 3.0 IGO.
CaSSIS will also be used when the next part of the ExoMars mission arrives in 2021 – the Rosalind Franklin rover, for both imaging and data relay.
The new image of InSight is just one of many new images released; others cover a wide variety of landscape features, such as layered deposits in the polar regions, dynamic dunes and the effects of converging dust devils. The 3-D stereo images bring an extra sense of reality to the images, so that it is almost like actually being there. Color-composite images can better highlight the differences in surface features, helping scientists find regions that have been altered by water in the past and guide future exploration missions. All of these are valuable, as explained by Thomas:
The InSight landing site image is just one of many really high quality images that we have been receiving. All of the images we’re sharing today represent some of the best from the last few months. We’re also really pleased with the digital terrain models.
South polar layered terrains in Burroughs Crater near the south polar cap. Image via ESA/Roscosmos/CaSSIS, CC BY-SA 3.0 IGO.
As also noted by Håkan Svedhem, ESA’s TGO project scientist:
This stunning image showcase really demonstrates the scientific potential we have with TGO’s imaging system. Over the course of the mission we’ll be able to investigate dynamic surface processes, including those that might also help to constrain the atmospheric gas inventory that TGO’s spectrometers have been analyzing, as well as characterise future landing sites.
TGO’s primary mission is to search for trace gases in the martian atmosphere – including methane, which could be a sign of either active geology or biology. Oddly, it hasn’t found any methane yet, although the gas has been confirmed previously by the Curiosity rover and multiple telescopes on Earth. The answer may lie in the fact that Curiosity documented a seasonal variation in the methane at its location in Gale Crater. TGO may have just looked at the wrong time, but it will continue to monitor the atmosphere in the months and years ahead.
The entire TGO image library can be seen here.
Bottom line: This fantastic collection of new images from TGO – like others – helps to show Mars as it really is, a world of diverse landscapes that in some ways are reminiscent of Earth, while also uniquely alien.
from EarthSky https://ift.tt/2WJ6pBr