The Green New Deal debate is in part about the absence of details

This is a re-post from Yale Climate Connections by Bud Ward

The ambitious, and some would say wholly unrealistic and impractical, Green New Deal (GND) pending as a non-binding “sense of the Senate” resolution deserves credit for having raised the visibility of the clearly urgent climate change issue, not only across Washington, D.C., but across the U.S. overall.

That’s an important and critically valuable first step, given that the issue has been all but deep-sixed by the abject undercutting of it by the Trump administration.

Commentary

So much has climate change moved toward, if not actually on to, the center stage that some savants can realistically foresee its becoming a full-fledged “issue” in the 2020 presidential and congressional elections. That would be in stark contrast to the 2016 presidential campaign, during which climate change went virtually ignored throughout the primary season and the general election.

An issue, yes. But perhaps also a wedge issue, with the GND and its amateurish flawed introduction having set the table and given the President and those steadfastly rejecting climate science a ready target for their trumped-up ire … a gift of “irresistible talking points,” as a New York Times September 24 editorial called it.

Beyond bestowing on the climate change issue the air of seriousness and urgency that scientists clearly warn it demands, GND and the pro- and con-brouhaha surrounding it provide a real service in putting forth what one of its original cosponsors described as, in effect, an RFP … a request for proposals.

Those many widely and wildly rejecting the climate change elements of the GND – keep in mind, the resolution as written ventures also into critical issues well beyond climate change – track pretty closely with those who for too long refused to acknowledge the overwhelming body of scientific evidence on the climate. That’s a familiar pattern: First challenge the evidence and then, when that approach becomes unsustainable, challenge the proposed cures. Funny how that happens.

There may too be other ways in which the history on these kinds of issues appears bound to repeat itself. The last time a “sense of the Senate” climate resolution was considered on the floor was in 1997. Who can forget the “Byrd-Hagel” resolution, passed 95-0 in rejecting the then-administration’s efforts to move forward on the Kyoto Protocol? Or, more importantly, forget the lessons to be drawn from that experience?

Led by the then-senators from West Virginia and Nebraska, that effort expressed the Senate’s opposition to proceeding with binding greenhouse gas emissions initiatives for developed countries (read U.S.) unless developing countries (read China, Russia, India) did the same. It became an albatross, a lead weight, for years to come, hobbling three administrations in their efforts to take action, and becoming a weapon of choice for those wanting to douse any climate change anxieties.

Columbia University adjunct law visiting scholar Susan Biniaz, of the Sabin Center for Climate Change Law, wrote in January that “By its terms, the Byrd-Hagel Resolution applied not only to the Kyoto Protocol but also to any subsequent climate agreement.” It helps to keep in mind that such historical comparisons are seldom perfect fits. It’s fair to acknowledge that there are both similarities and dissimilarities between the then of Byrd-Hagel and the now of Markey-Ocasio Cortez, the lead Senate and House sponsors.

But think about it. That “nonbinding” single-chamber congressional vote more than two decades ago is unlikely to have slipped from the memory of, let’s say, Senate Majority Leader Mitch McConnell (R-Ky), whose coal-focused steadfast opposition to advancing climate actions is part of his DNA. One can fairly wonder if and to what extent the newer and younger breed of senators and representatives also carry the torch, or the scars, left by that Byrd-Hagel vote.

In addressing a wide and critically important range of social and economic issues – higher education for all Americans, pay inequities, job guarantees, secure retirements, housing – the sweeping GND (remember it’s only an RFP) likely is written to enlist some supporters whose motivations aren’t primarily the sustainability of a livable planet. And it may do so. At the same time, of course, it runs the risk of weighing down a proposal for which a plan for attacking global warming might have proved a sufficient burden on its own.

There are of course, and as always, devil’s theories that might apply. Perhaps the canny McConnell, in proposing a full Senate floor vote, is laying a trap, one he hopes will drive a wedge not only among some 2020 congressional candidates defending, or seeking, seats in “red” or pro-coal states, but also among the would-be Democratic presidential candidates. There are early signs that one or both may be happening.

Perhaps the initial apparent coolness to the GND resolution by the likes of House Speaker Nancy Pelosi (D-Ca) and leading Senate office holders – think Dianne Feinstein (also D-Ca) – are such indicators. And add to that the apparent early hesitancy from would-be leading Democratic presidential candidates Amy Klobuchar (D-Mn) and as-yet unannounced Sherrod Brown (D-Ohio).

In its lengthy February 24 editorial somewhat reservedly, somewhat fully, endorsing the Green New Deal, The New York Times chose as a headline “What’s Green? What’s New? What’s the Deal?” That seemed pretty much on-target, echoing the thoughts of many who want, deeply want, some “solution” to the challenging risks that climate change presents. The Times’s sub-headline under that headline: “A dream? Maybe. But it’s better than the climate nightmare we’re living.”

True. No argument there. But is that really where the bar should be set? Isn’t it just too low? What if the ambitious, and some will say unreachable, goals set in the GND inadvertently end up harming prospects for progress in futile pursuit of what some may see as perfection? Possible? Yes.

But once more, look back to history for context. What if John F. Kennedy in that inaugural address had thrown out the challenge to get half-way to the Moon? That’s likely what we would have accomplished, rather than the full-blown societal mobilization, as experts say the climate challenge now demands.

It’s crazy. It’s complex. It’s so far at this point from being an actual legislative proposal, let alone a bill or a law, that GND may best be judged a success if it succeeds only by the measure of a simple formula: GND = RFP. All good ideas welcome, and those rejecting the GND as a whole or its individual climate-related components, must be asked to answer: If not this, then what?

It’s their turn now.


from Skeptical Science https://ift.tt/2HZcGF9
Major study uncovers ‘sea change’ in world’s understanding of Atlantic conveyor belt

This is a re-post from Carbon Brief by Daisy Dunne

An international research programme has uncovered data that could transform scientists’ understanding of the Atlantic Ocean current – a circulation pattern that plays a central role in determining weather across the world.

The research, published in Science, challenges the long-held view that the strength of the “Atlantic Meridional Overturning Circulation” (AMOC) is primarily driven by processes in the Labrador Sea, which is in the north-west Atlantic.

Instead, the project finds that – over a 21-month period – the strength of the AMOC was most linked to processes in waters between Greenland and Scotland, more than 1,000 miles away in the north-east Atlantic.

The research is “very useful for our understanding of how climate change could affect the AMOC because it points us in the direction of which regions and processes might be particularly important for maintaining the overturning circulation”, a scientist tells Carbon Brief.

Conveyor belt

The AMOC – which is sometimes referred to as the “Atlantic conveyor belt” – is a large-scale ocean current that moves warm, salty water from the tropics to regions further north, such as western Europe.

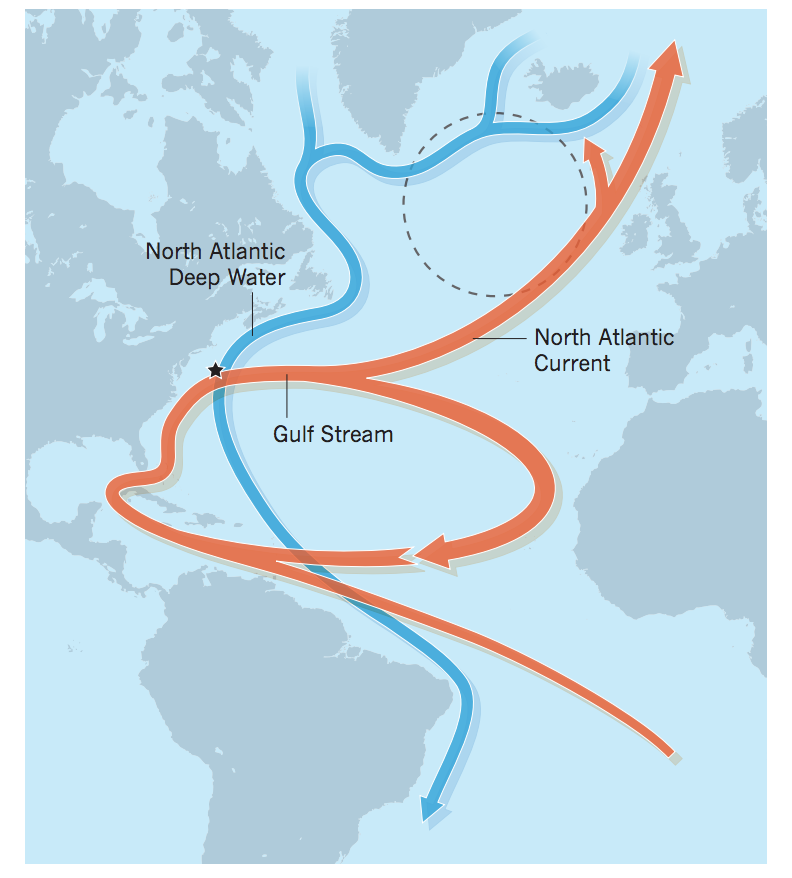
The graphic below shows the two main parts of the AMOC. The first is the flow of warm, salty water in the upper layers of the ocean northwards from the Gulf of Mexico (red line). This is made up of the “Gulf Stream” to the south and the “North Atlantic current” further north.

The second is the cooling and freshening of water in the high latitudes of the Atlantic, which then sinks and returns southwards towards the equator at much deeper depths (blue line).

The Atlantic Meridional Overturning Circulation. Source: Praetorius (2018)

The warm water that the AMOC carries northwards releases heat into the atmosphere, which means it plays a crucial role in keeping western Europe warm. Without it, winters in the UK could be around 5C colder.

Scientists fear that climate change could be causing the AMOC to “slow down”. Last year, two studies published in Nature found that the AMOC had slowed by 15% since the mid-20th century. Further AMOC slowdown has been linked to an increased risk of intense storms in Europe and faster sea level rise in parts of the US, among other problems.

But to fully understand how climate change could affect the AMOC, scientists need to get a clearer picture of what drives the ocean current, says Dr Penny Holliday, a principal research scientist at the UK’s National Oceanography Centre and UK lead of the Overturning in the Subpolar North Atlantic Programme (OSNAP).

OSNAP, which was launched in 2014, involves more than 100 researchers from the UK, US, Canada, China, France, Germany and the Netherlands. It takes continuous measurements in the northern part of the AMOC – where warm water sinks and travels back towards the tropics – in order to get a better idea of what drives this “overturning”.

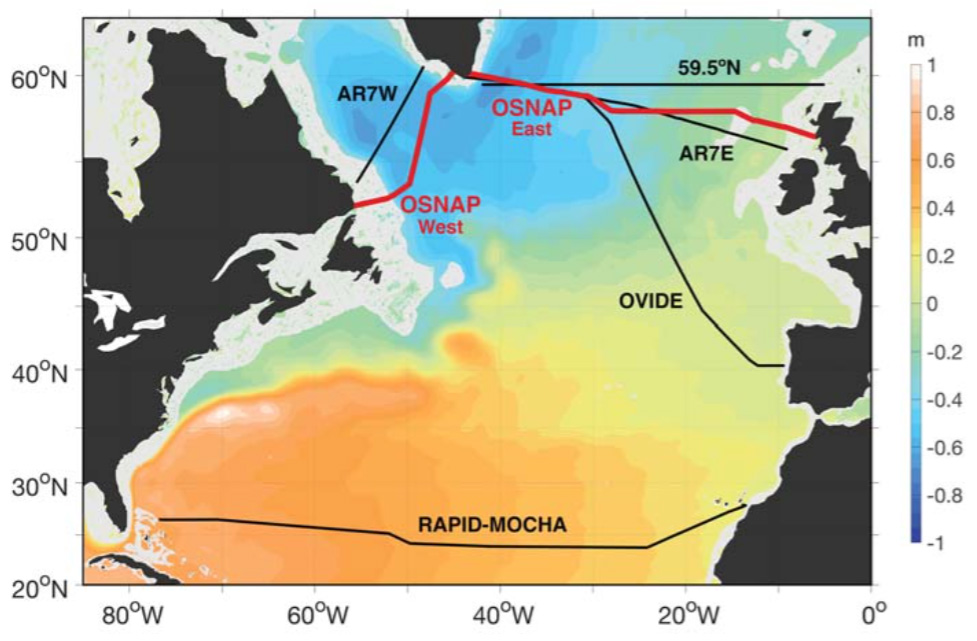
To do this, it has deployed two arms: “OSNAP East”, which extends from the Labrador Sea off the north-east coast of Canada to south-west Greenland, and “OSNAP West”, which reaches from south-east Greenland to the coast of Scotland. (The location of each arm is shown in red on the map below. The Labrador Sea is situated close to “AR7W”.)

Map showing The Overturning in the Subpolar North Atlantic Programme (OSNAP) array (red). Also shown is the location of the RAPID array, the OVIDE array and a Canadian monitoring programme (“AR7W”). Colour represents ocean depth. Source: Lozier et al. (2019)

The Overturning in the Subpolar North Atlantic Programme (OSNAP) array (red). Also shown is the location of the RAPID array, the OVIDE array and a Canadian monitoring programme (“AR7W”). Colour represents ocean depth. Source: Lozier et al. (2019)

Each arm is made up of an array of measuring instruments – which enable the researchers to gather continuous measures of the strength of the ocean current, says Holliday:

“It consists of a whole load of moorings, which are ways in which we string instruments between the seafloor and the sea surface in the deep ocean. So there’s an anchor at the bottom and along that wire we string instruments that can measure various things like the speed of the water, the velocity of the water, temperature and the salinity.”

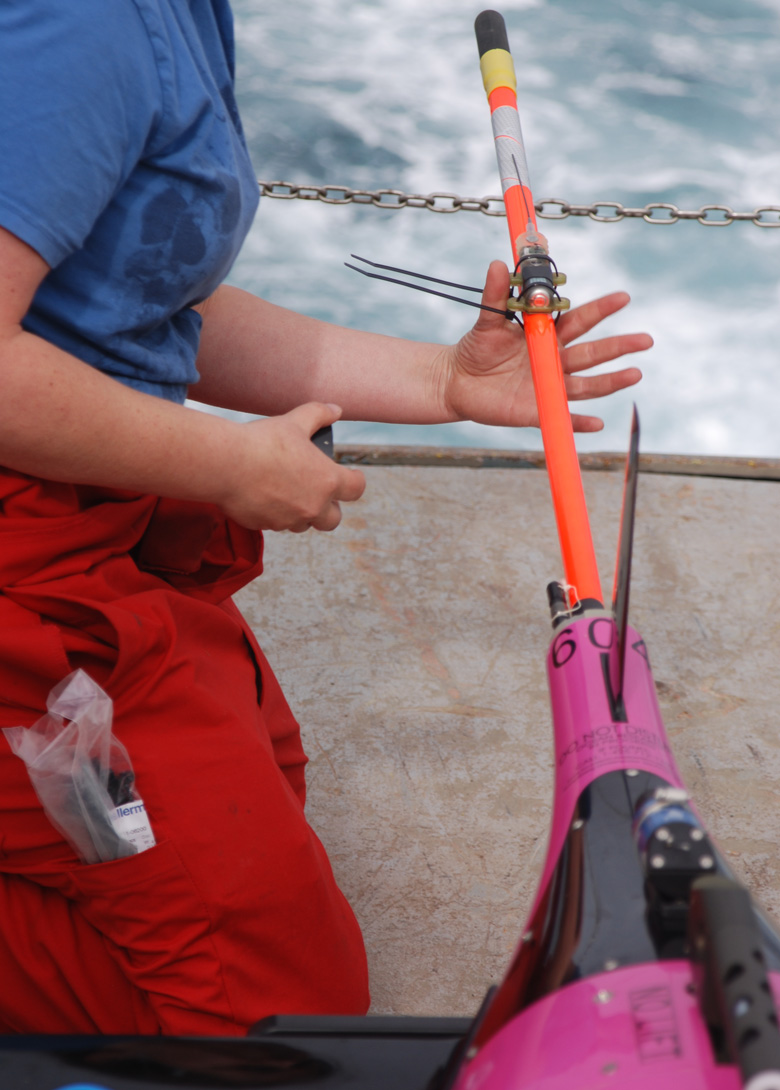
Photo of Scottish Association for Marine Science technician Karen Wilson performs final preparation of a Seaglider prior to deployment. Iceland Basin, July 2014. Source: Heather Furery, Woods Hole Oceanographic Institution

Scottish Association for Marine Science technician Karen Wilson performs final preparation of a Seaglider prior to deployment. Iceland Basin, July 2014. Source: Heather Furery, Woods Hole Oceanographic Institution

In the parts of the ocean that the moorings cannot reach, the researchers rely on Argo floats and gliders, she says:

“[Argo floats] drift around the ocean and, every 10 days, they surface and transmit their location and their data and then sink back to 2,000m. They give temperature and salinity data. The other part of the array are these things called “gliders” which are a bit like floats, but they have wings so that they can glide down to the deep ocean and glide back up again.”

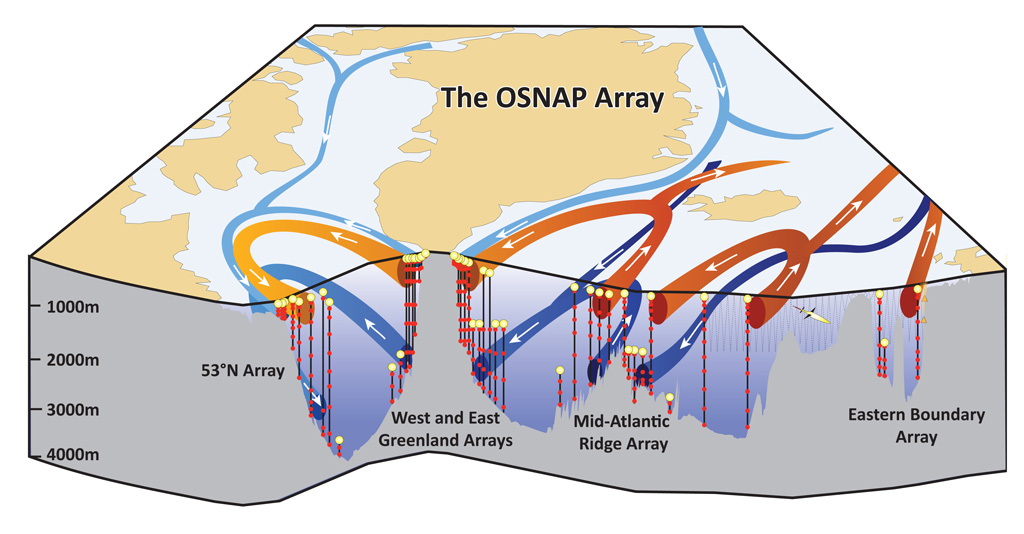
A diagram of the layout of the measuring arrays deployed by the programme is shown below.

Schematic diagram of the Overturning in the Subpolar North Atlantic Programme (OSNAP) array. Central land mass is Greenland. Source: OSNAP

Schematic diagram of the Overturning in the Subpolar North Atlantic Programme (OSNAP) array. Central land mass is Greenland. Source: OSNAP

(There are several other long-term international projects monitoring different parts of the AMOC. These include the RAPID project, which has deployed an array of instruments reaching from Florida to Morocco (shown on the first map), and the National Ocean and Atmospheric Administration’s (NOAASouth AMOC monitoring programme, which reaches from South Africa to South America.)

Abandoning Labrador

The new study details the results of the first 21-month observing period of the OSNAP. One key finding is that the long-held view that the Labrador Sea was a key site in determining the strength of the AMOC could be incorrect, Holliday explains:

“We found that the mean and the variations in the strength of the overturning circulation is dominated by processes happening between Greenland and Scotland – we call it the ‘OSNAP east’ part. And, actually, the overturning that takes place in the Labrador Sea is rather small and doesn’t contribute to the month-to-month changes.”

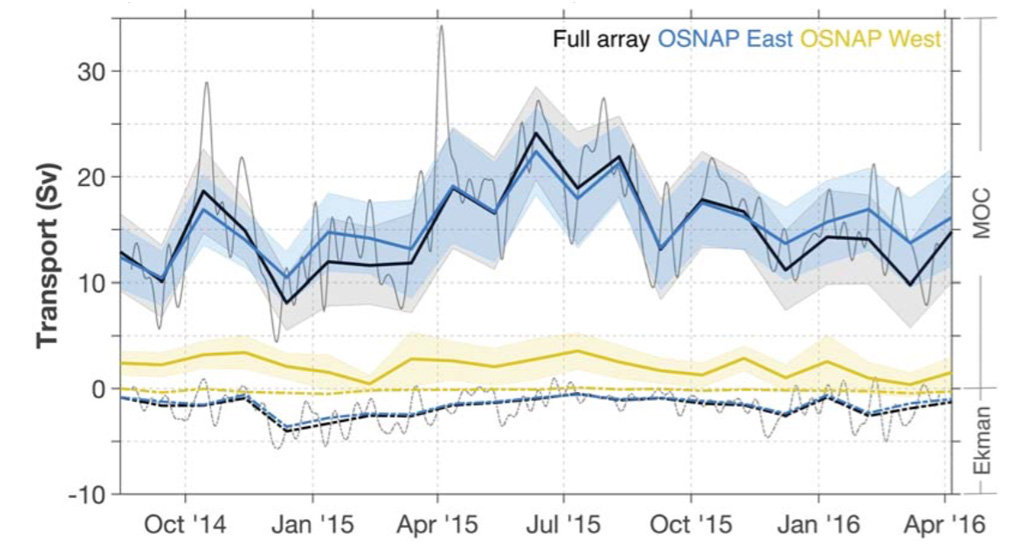
This finding is shown on the graph below, where the black line represents the overturning circulation across the entire array, the blue line shows overturning in OSNAP east region and the yellow line shows overturning in the OSNAP west region (where the Labrador Sea is).

Line graph The meridional overturning circulation (MOC) across the entire array from October 2014 to April 2016 (black) is shown against the overturning circulation when split between OSNAP East (blue) and OSNAP west (yellow), measured in “Sverdrups” (Sv). Thin black line shows day-to-day changes in overturning. Grey shading represents uncertainty. “Ekman” shows the smaller influence of wind on heat transport. Source: Lozier et al. (2019)

The meridional overturning circulation (MOC) across the entire array from October 2014 to April 2016 (black) is shown against the overturning circulation when split between OSNAP East (blue) and OSNAP west (yellow), measured in “Sverdrups” (Sv). Thin black line shows day-to-day changes in overturning. Grey shading represents uncertainty. “Ekman” shows the smaller influence of wind on heat transport. Source: Lozier et al. (2019)

The graph shows how waters around OSNAP east play a major role in determining the strength of the AMOC, Holliday says:

“The fact that the blue and the black line is really close together is saying that the OSNAP east region is dominating the [A]MOC and its variability.”

The findings represent an “exciting” step forward in scientists’ understanding of the AMOC, says Prof David Thornalley, a researcher of the AMOC from University College London, who is not involved in the OSNAP. He tells Carbon Brief:

“This finding is very useful for our understanding of how climate change could affect the AMOC because it points us in the direction of which regions and processes might be particularly important for maintaining the overturning circulation. We can then focus on examining how susceptible these regions and processes are to climate change.”

Still a slowdown?

The findings suggest that changes to the Labrador Sea may have a played a smaller role in the AMOC slowdown observed over the past few decades than previously thought, says Prof Benoit Thibodeau, a researcher of the AMOC from the University of Hong Kong, who is also not involved in OSNAP. He tells Carbon Brief:

“This is not a total surprise as some studies already suggested that the linkage between convection in the Labrador Sea and the AMOC was weak. This…suggests that processes in the Labrador Sea do not seems to play an important role in the 20th century weakening of the AMOC and that we should pay more attention to the Irminger basin and the Nordic Seas when trying to apprehend potential consequences of climate change on the ocean circulation.”

Though the findings could cause scientists to refocus their studies, this does not mean that previous research projecting further weakening of the AMOC over the 21st century as a result of climate change is incorrect, Thornalley says:

“This paper is not really questioning the overall concept that warming and increased freshwater input at high latitudes is likely going to lead to a weaker AMOC. I think that is a pretty robust result most – pretty much all – scientists would agree with. However, this study does potentially alter our thoughts on exactly how it will weaken and what regions are the most critical.”

The findings are “very interesting” – but it could be too soon to draw conclusions, says Levke Caesar, a PhD student studying the AMOC from the Potsdam Institute for Climate Impact Research (PIK). She tells Carbon Brief:

“The time series is way too short to revise our understanding of the relative importance of the different convection sites. These first results rather stress the importance of continuing these measurements to connect the variability on such short time scales to that on the intra-annual to decadal scale.”

The results highlight how important long-term data collection is to fully understanding the impact of climate change on the AMOC, says Prof Monika Rhein, an oceanographer from the Institute for Environmental Physics at Bremen University, Germany, who is also not involved in OSNAP. In a Perspectives article accompanying the new research, she writes:

“Only long-term continuous time series can provide the much-needed benchmark to evaluate the climate model simulations. The promising results from the OSNAP array, its proximity to the Labrador Sea, and the questions raised about the processes causing AMOC variability provide excellent incentives to continue the OSNAP array for the next decades.”

Lozier, M. S. et al. (2019) A sea change in our view of overturning in the subpolar North Atlantic, Science, doi/10.1126/science.aaw3111


from Skeptical Science https://ift.tt/2I0aRrA

New research, March 18-24, 2019

A selection of new climate related research articles is shown below. This post has separate sections for: Climate Change, Climate Change Impacts, Climate Change Mitigation, and Other Papers.

Climate change mitigation

Climate change communication

The growth of climate change misinformation in US philanthropy: evidence from natural language processing (open access)

Just don't call it climate change: climate-skeptic farmer adoption of climate-mitigative practices (open access)

Climate Policy

Power, coalitions and institutional change in South African climate policy

How effective is the European Union energy label? Evidence from a real-stakes experiment (open access)

Energy production

Effect of oil spills on infant mortality in Nigeria

Effects on power system operations of potential changes in wind and solar generation potential under climate change (open access)

What explains India's embrace of solar? State-led energy transition in a developmental polity

Creating a “family tree” on fertilizer inventory use in life cycle assessment of oil palm: visualization of earlier studies and its implications

Household energy transition in Sahelian cities: An analysis of the failure of 30 years of energy policies in Bamako, Mali

Futurizing politics and the sustainability of real-world experiments: what role for innovation and exnovation in the German energy transition?

Bioenergy development and the implications for the social wellbeing of Indigenous peoples in Canada

Simulating impacts of real-world wind farms on land surface temperature using the WRF model: physical mechanisms

Examining the trends of 35 years growth of key wind turbine components

Change to hydropower development in Bhutan and Nepal

Colombian energy planning - Neither for energy, nor for Colombia

Of mills and mines: an intercategorical critique of the hidden harms of natural resource boom and bust cycles in U.S. history

Emission savings

A Swedish comment on ‘review: the availability of life-cycle studies in Sweden’ (open access)

Avoiding CO2 capture effort and cost for negative CO2 emissions using industrial waste in chemical-looping combustion/gasification of biomass (open access)

Climate changes yet business as usual: a parable of sustainable rural cities in Chiapas, Mexico

Climate change mitigation options among farmers in South Asia (open access)

Exploring the role of normative, financial and environmental information in promoting uptake of energy efficient technologies

Energy efficiency of residential buildings in the European Union – An exploratory analysis of cross-country consumption patterns

Mapping of cultivated organic soils for targeting greenhouse gas mitigation (open access)

The 4p1000 initiative: Opportunities, limitations and challenges for implementing soil organic carbon sequestration as a sustainable development strategy

Climate change

Temperature, precipitation, wind

South Asian perspective on temperature and rainfall extremes: A review

Variability of extreme precipitation over Texas and its relation with climatic cycles

Extreme events

Forecasting high-impact weather in landfalling tropical cyclones using a Warn-on-Forecast system (open access)

Forcings and feedbacks

Characterising the seasonal and geographical variability in tropospheric ozone, stratospheric influence and recent changes (open access)

Cryosphere

Patterns of spatio-temporal paraglacial response in the Antarctic Peninsula region and associated ecological implications

Resolving the influence of temperature forcing through heat conduction on rock glacier dynamics: a numerical modelling approach (open access)

Potential Influence of a Developing La Niña on the Sea-Ice Reduction in the Barents–Kara Seas

Potential faster Arctic sea ice retreat triggered by snowflakes' greenhouse effect (open access)

Contributions of the cryosphere to mountain communities in the Hindu Kush Himalaya: a review (open access)

Hydrosphere

Spatiotemporal variations of extreme sea levels around the South China Sea: assessing the influence of tropical cyclones, monsoons and major climate modes

Atmospheric and oceanic circulation

Monsoon Responses to Climate Changes—Connecting Past, Present and Future

Carbon and nitrogen cycles

Modelling the impacts of intensifying forest management on carbon budget across a long latitudinal gradient in Europe (open access)

Seasonal variations in the response of soil CO2 efflux to precipitation pulse under mild drought in a temperate oak (Quercus variabilis) forest

Climate change impacts

Mankind

How much does climate change add to the challenge of feeding the planet this century? (open access)

Assessment of extreme heat and hospitalizations to inform early warning systems

Climate change and public health: a study of vector-borne diseases in Odisha, India

Climate versus demographic controls on water availability across India at 1.5 °C, 2.0 °C and 3.0 °C global warming levels

Economic Impacts of Climate Change on Vegetative Agriculture Markets in Israel 

Climate Change Interactions with Agriculture, Forestry Sequestration, and Food Security (open access)

Climate change favors rice production at higher elevations in Colombia

Arabica coffee fruits phenology assessed through degree days, precipitation, and solar radiation exposure on a daily basis

Biosphere

Plant and sediment properties in seagrass meadows from two Mediterranean CO2 vents: Implications for carbon storage capacity of acidified oceans

Contrasting effects of acidification and warming on dimethylsulfide concentrations during a temperate estuarine fall bloom mesocosm experiment (open access)

Removal of intertidal grazers by human harvesting leads to alteration of species interactions, community structure and resilience to climate change

Frost controls spring phenology of juvenile Smith fir along elevational gradients on the southeastern Tibetan Plateau

Dispersal distances and migration rates at the arctic treeline in Siberia – a genetic and simulation-based study (open access)

Other papers

Palaeoclimatology

A new method for reconstructing past-climate trends using tree-ring data and kernel smoothing

Was the Arctic Ocean ice free during the latest Cretaceous? The role of CO2 and gateway configurations 


from Skeptical Science https://ift.tt/2UgQoVF

Cigarettes and alcohol: should we be communicating cancer risk in terms of cigarettes smoked?

The link between cancer and smoking is undeniable. If you smoke, the most important thing you can do to reduce your risk of cancer is to stop. And decades of research and policy action have made this fact clear.

But what about other risk factors for cancer? Could the well-known dangers of smoking be used to nudge people to think about alcohol as a health risk?

Research making headlines today has made attempts to find out, by asking: ‘How many cigarettes are in a bottle of wine?’

Based on statistical analysis the researchers say that drinking a bottle of wine a week carries the same lifetime cancer risk as smoking up to 10 cigarettes a week in women and 5 in men.

And the researchers, publishing their study in BMC Public Health,say this “provides a useful measure for communicating possible cancer risks that exploits successful historical messaging on smoking”.

How many cigarettes are in a bottle of wine?

The study was based on the risk of someone developing any form of cancer in their lifetime. The authors calculated that in people who don’t smoke, the extra risk of developing cancer at some point in their life caused by drinking10 units of alcohol per week was 1.0% for men and 1.4% for women.

UK alcohol guidelines say men and women shouldn’t drink more than 14 units a week on a regular basis. And 10 units of alcohol is equivalent to one 750ml bottle of wine.

This means that if 1,000 men and 1,000 women each drank one bottle of wine per week, around 10 extra men and 14 extra women may develop cancer during their lifetime.

They then calculated that the ‘cigarette equivalent’ of a bottle of wine per week – the number of cigarettes needed to have the same impact on lifetime risk as a bottle of wine. They concluded this would be 5 cigarettes for men and 10 for women.

This is an interesting way to make people think about the health effects of moderate drinking, but unpicking these figures brings a few things to light.

Putting alcohol and smoking head to head

First, this calculation includes the impact of alcohol and smoking on all types of cancer combined. Even though a few cancer types are linked to both smoking and alcohol, some are more strongly associated with one risk factor than the other.

Drinking alcohol increases the risk of mouth, upper throat (pharyngeal), oesophageal, voice box (laryngeal), breast, bowel and liver cancer. Whereas smoking is linked to at least 15 types of cancer, the most common being lung cancer.

Katrina Brown, Cancer Research UK’s statistical information and risk manager, says focusing on the result for all cancers combined might downplay the impact each risk factor has for individual cancer types.

“There are certainly downsides to comparing risk factors in this way,” says Brown.

These figures should be viewed more as illustrative rather than precise.

– Katrina Brown, Cancer Research UK

“Take lung cancer for example. For lung cancer, drinking a bottle of wine would not have the same effect as smoking 10 cigarettes, because smoking has a much bigger impact on lung cancer risk than drinking alcohol does.”

But the picture is different when talking about breast cancer. Of the cancers linked to alcohol, drinking causes more cases of breast cancer than any other type in the UK – because breast cancer is the most common of the alcohol-related cancer types. Stats from 2015 suggest that around 8 in 100 breast cancer cases were linked to alcohol. That’s why the researchers saw a bigger overall impact in women from that weekly bottle of wine, because the biggest cancer type linked with alcohol is by far more common in women than men.

So, communicating the risk of drinking alcohol, and the comparison between smoking and drinking, in a way that groups all cancers together might not be the most informative option.

“It’s particularly important to consider that some individuals might have a higher risk for specific cancers because of other risk factors like obesity, or genetics,” says Brown.

“It’s also possible that people are less accurate at estimating their intake of alcohol than of cigarettes, or vice-versa. That would impact the accuracy of the calculations which give those precise figures of 10 cigarettes versus 1 bottle of wine. So these figures should be viewed more as illustrative rather than precise.”

Let’s get some perspective

We also need to think about how people behave in real life. The researchers acknowledge the study didn’t account for other factors which can cause cancer, like age and obesity. And the potential for misinterpretation is something the researchers are also aware of.

“We must be absolutely clear that this study is not saying that drinking alcohol in moderation is in any way equivalent to smoking,” says Dr Theresa Hydes, lead researcher on the study.

“At an individual level, cancer risk represented by drinking or smoking will vary and for many individuals, the impact of ten units of alcohol (one bottle of wine) or five to ten cigarettes may be very different.”

So, depending on whether you’re a non-smoker or smoker, or how much you like a drink, reactions to today’s news may be different.

The average smoker in the UK smokes 11 cigarettes per day. And people who smoke are also more likely to drink. In that case, they may be smoking and drinking at the same time, which for some cancer types causes more harm than doing either one alone. Again, the researchers did acknowledge this.

Smoking is still worse

Smoking causes over four times the number of cancer cases that alcohol does in the UK. Using smoking as a risk comparison may also give the impression that people can substitute one risk factor for another.

“We don’t want people saying, ‘if I don’t drink that bottle of wine tonight, I can smoke 10 cigs instead’,” says Brown.

Brown also suggests there could be a risk of normalising smoking if it’s pitched against a behaviour that’s more socially acceptable.

“Improving understanding of other risk factors shouldn’t come at the price of reducing the perceived danger of smoking, because there’s no other risk factor that’s as bad as smoking.”

What do you think?

Not everyone who drinks alcohol will develop cancer. But when we look at the whole population, people who drink alcohol, even at low levels, are more likely to develop cancer than people who don’t. And that’s a really important thing for the public to know.

Finding sensible and informative ways of communicating cancer risk is extremely valuable and this study offers an interesting new way to try and put risk in context. But as is often the case with communicating health risks, it also shows how hard it can be. It’s likely that this research will get people thinking about the long-term effects moderate drinking can have on our health, and that’s definitely a good thing.

Professor David Spiegelhalter, Winton Professor of the Public Understanding of Risk in the Statistical Laboratory at the University of Cambridge, told the Science Media Centre: “If cigarette-equivalents were to be used to communicate the cancer risk of alcohol consumption, it is vital that their impact is properly evaluated to check they do not produce unreasonable concern.”

So maybe explaining cancer risk in this way is only useful if the public thinks it is?

We asked our followers on Twitter what they thought, and it appears they found the comparison useful.

But these responses still paint the overall picture of cancer risk as enormously complicated and incredibly nuanced. The researchers set out to answer ‘how many cigarettes are in a bottle of wine?’, which they did. How this number might now affect the way people view drinking remains to be seen.

Gabi


from Cancer Research UK – Science blog https://ift.tt/2uvNJZQ

Inflammation and cancer: unravelling a 150-year-old mystery

Barrett's oesophagus tissue sample

Inflammation is one of the body’s most powerful weapons. It’s our reaction to bacteria and toxins, marked by an avalanche of immune cells and chemicals that take down the enemy and allow our wounds to heal.

But as well as preventing infections and repairing injuries, inflammation can also cause collateral damage. The masses of blood cells, antibodies, enzymes and other chemicals arriving at the scene cause a chain reaction, often affecting the tissues surrounding those they’re trying to protect.

And for people with long-term inflammatory conditions, a prolonged state of inflammation can sometimes cause irreparable damage, and sometimes leads to cancer.

Inflammation is a major culprit in cancer

The link between inflammation and cancer was first made more than 150 years ago. And it’s now thought that up to 1 in 4 cancers globally are linked to the condition.

Knowing that cancers linked to inflammation, such as oesophageal and lung cancer, are among those hardest to treat, we’ve dedicated £20 million as part of our Grand Challenge scheme to uncover the root cause. And the team of experts from the US, UK, Canada and Israel that are tackling this challenge, led by Professor Thea Tlsty, aim to ultimately find better ways to detect and treat these cancers.

“Understanding how inflammation can lead to cancer is the fundamental nature of this challenge,” says Dr Stuart McDonald, a lead researcher on the team from Barts Cancer Institute in London who studies an inflammatory condition of the food pipe, called Barrett’s oesophagus.

“The inflamed tissues don’t show any obvious signs that they’re going to develop into cancer, but a switch can occur, taking them towards cancer. And this is the part that we don’t understand,” explains McDonald.

But delving into these tissues, scientists think they might have uncovered some clues as to what’s going on.

The supporting environment could help cancers grow

According to McDonald and others working on the Grand Challenge project, the answers might not lie in the cancer cells themselves. Instead, the environment surrounding the tumour, and the supporting web of cells and proteins that hold this habitat together, called the stroma, could have a part to play.

Until now, McDonald’s work has focused on the lining of the oesophagus, where most cancers occur. But for this project, he’s now able to study the stroma too, enabling him to hear both sides of the conversation, and understand how each part contributes to cancer growth.

“There’s some nice evidence to suggest that when you target the stroma, you can revert an invasive cancer into a non-invasive one,” says McDonald.

So far, these results have only been seen in mice, but if scientists can translate this knowledge to people it may be possible to develop treatments that could revert tumours back to normal tissue.

New technology is uncovering cancer targets

One researcher who has played a key role in studying how the stroma affects cancer is Professor Donald Ingber from the Wyss Institute for Biologically Inspired Engineering at Harvard University in the US. His pioneering early work in the 1980s forms the basis for how mistakes in the development of normal stromal tissue can lead to cancer.

As part of the team taking on this Grand Challenge, Ingber’s role is to build on the foundations of his early work and use the latest technologies to bring about new discoveries.

This includes the so-called ‘organ-on-a-chip’ technology developed by Ingber’s team at the Wyss Institute.

Formed from a network of tiny channels housed in what looks like a clear computer memory stick, the chip allows researchers to recreate what goes on inside an organ in a controlled lab environment.

For example, they can take cells that line the human intestine or lungs, called epithelial cells, and grow them on one side of a porous membrane, with stromal cells grown on the other. They can then exert physical pressures on the chip to represent real life situations, such as the breathing motions of the lung. All the while, providing a liquid lifeline in the form of an artificial blood supply that flows across the cells as it would in the body.

Lung cancer on a chip

Lung cancer cells (green) grow within healthy lung tissue (red) in the lung cancer chip, used to model and study how tumours grow. Credit: Wyss Institute at Harvard University

“We plan on taking pre-cancerous epithelial cells from patients and combining them with their own pre-cancerous stromal cells on the chip to recreate what tissues look like before they turn to cancer,” explains Ingber. “We can then replace the pre-cancerous stromal cells with normal stromal cells and see if that reverts the tissues back to normal.”

This meticulous approach will be mirrored across the team, with each group adding their expertise in the hunt for detection and treatment targets.

“This process is universal to all the team members, but each of us have our own particular specialities we can use to provide these targets,” says McDonald. So, while Ingber’s lab is focused on organs-on-chips, McDonald will be studying clinical samples.

This collaborative and convergent approach will generate a whole host of targets. The challenge then is to pick out the most important ones and work out how to attack them.

Sniffing out new cancer targets

Dr Kole Roybal, from the University of California, San Francisco, is leading a team that will be engineering human immune cells, called T cells, to ‘sniff out’ the signs of cancer.

According to Ingber, Roybal will be putting seeker molecules on the surface of these cells so that they find the targets identified by other team members, potentially helping them home in on cancerous cells. They could then “release signals that may help prevent progression or avert cancer entirely”, suggests Ingber.

McDonald hopes this will lead to new therapies using the targets he and others discover throughout the project.

But these developments will take time, and nothing is guaranteed. McDonald adds that some of the difficulties posed by these theoretical new therapies could take “more than the length of one Grand Challenge project” to solve. But there are other goals along the way that could ease the burden on cancer patients.

Changing the patient pathway

Desiree Basila, who in 2007 was diagnosed with a breast condition that can turn into cancer, called ductal carcinoma in situ (DCIS), is a patient advocate on the team from San Francisco.

“One of the big pieces of the project is trying to stratify risks,” she explains. “We’re trying to see which biological situations are going to lead to aggressive cancer and need to be treated. And then those which may be atypical but won’t lead to cancer.”

Desiree Basila

My great hope is that this project can help us know when treatment is really necessary, and if it is, provide treatment that improves both quantity and quality of life – Desiree Basila, patient advocate

This is critical for Basila, who turned down aggressive treatment for her condition, which is being studied in greater detail as part of another Grand Challenge project. She believes that softer approaches are needed to treat cancers.

“Scientists may be thrilled by their work when they can extend life by three months, but from a patient’s perspective, a lot of the time they spend three months suffering horrible side effects,” she says. “My great hope is that this project can help us know when treatment is really necessary, and if it is, provide treatment that improves both quantity and quality of life.”

McDonald shares this vision for cancer treatment, with one of his main goals being to identify who’s at risk and who doesn’t need to undergo therapy.

“I want to have the basis of a predictive model for how the stroma changes over time and what this means for cancer risk. That way we can get patients who are not at risk of cancer out of the clinic and free up resources for those that are at risk.”

This aspiration is shared by Ingber, who sees huge potential in the opportunity to prevent cancers through this work.

“If we can develop therapies that prevent progression, that’s an easier target to go after,” he says. “Once you have cancer, it’s really hard to reverse that, but if you stall it when it’s just at the inflammatory stage, maybe we can normalise it.

“By treating these patients early, you would be preventing cancer from ever forming, and that would be the goal.”

It’s ambitions like these that the Grand Challenge scientists are striving for.

Basila sees a world “where medicine is shared decision making and where patients have a voice in their own care – making decisions from a place of understanding, rather than fear”.

For patients with long-term inflammatory conditions, having the means to find out more about the risks associated with their condition would be a huge achievement to better manage their treatment. Now it’s down to the research to light the way.

Carl Alexander is a senior science media officer at Cancer Research UK


from Cancer Research UK – Science blog https://ift.tt/2V262kW

Here’s a solar system being born

Fuzzy concentric rings, the inner one more distinct and brighter, around an orange dot.

ALMA image of the dusty disk around the young star DM Tau. You can see 2 concentric rings, where planets may be forming. Image via ALMA.

Japanese astronomers reported this month on their observations of the formation sites of planets around a young star resembling our sun. The star is DM Tau, located 470 light-years away in the direction of our constellation Taurus the Bull. The astronomers observed it using the ALMA telescope in the Atacama Desert of northern Chile. DM Tau is about half the mass of our sun. It’s estimated to be 3 to 5 million years old, in contrast to our sun’s 4.6 billion years. The astronomers spied two rings of dust around the star, at distances comparable to our sun’s asteroid belt and the orbit of the planet Neptune. The rings at these distances suggest we’re seeing the formation of a planetary system similar to our own.

The peer-reviewed Astrophysical Journal published these results in November 2018. The astronomers presented them this month at the annual meeting of the Astronomical Society of Japan.

Tomoyuki Kudo of the National Astronomical Observatory of Japan (NAOJ) led the research. He said:

Previous observations inferred two different models for the disk around DM Tau. Some studies suggested the radius of the ring is about where the solar system’s asteroid belt would be. Other observations put the size out where Neptune would be. Our ALMA observations provided a clear answer: both are right. DM Tau has two rings, one at each location.

The researchers said they also found a bright patch in the outer ring. This indicates a local concentration of dust, which would be a possible formation site for a planet like Uranus or Neptune. Jun Hashimoto, a researcher at the Astrobiology Center, Japan, commented:

We are also interested in seeing the details in the inner region of the disk, because the Earth formed in such an area around the young sun. The distribution of dust in the inner ring around DM Tau will provide crucial information to understand the origin of planets like Earth.

Flat, wide tan dust rings, image very similar to the ALMA image but oblique.

Artist’s concept of the disk around the young star DM Tau. Planets such as our Earth – and the other planets in our solar system – are thought to have formed in a dusty disk like this one. Image via NAOJ.

Botton line: Astronomers have spied 2 rings of dust – the possible birthplace of planets, similar to those in our solar system – around the young sunlike star DM Tau.

Source: A Spatially Resolved au-scale Inner Disk around DM Tau

Via ALMA


from EarthSky https://ift.tt/2FCL2Lh

How coyote pups get used to humans

2 half-grown doglike animals with big ears followed by bigger one.

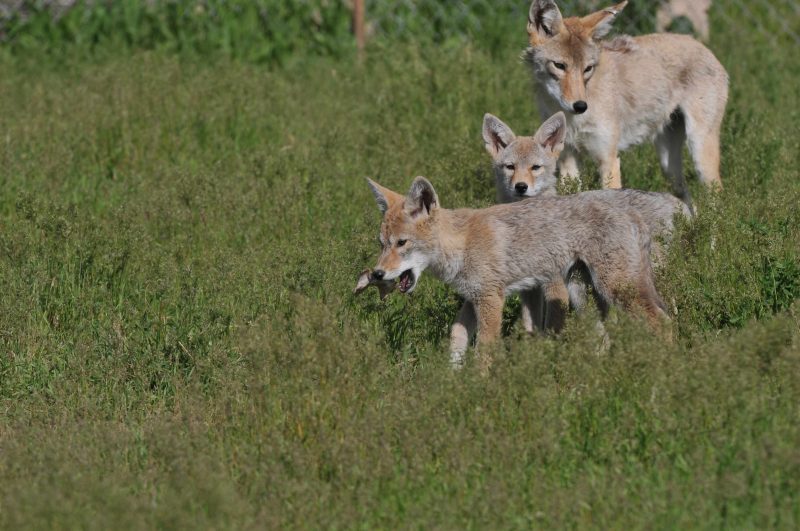
Seven-week-old coyote pups walk through the research facility in Utah as the mother follows. The first pup carries a bone in its mouth. Image via USDA National Wildlife Research Center/Steve Guymon.

As coyotes are moving into urban environments across North America, many human residents – whether they like it or not – are having to get used to them. Meanwhile, how are coyotes habituating to people?

A new study, published December 2018 in the peer-reviewed journal Ecology and Evolution, suggests that coyotes can habituate to humans quickly and that habituated parents pass this fearlessness on to their offspring.

Doglike animal, big ears, fluffy tail, stepping off curb onto a sidewalk.

Image via Connar L’Ecuyer via National Park Service/Flickr.

Until the 20th century, coyotes lived mostly in the U.S. Great Plains. But when wolves were hunted almost to extinction in the early 1900s, coyotes lost their major predator, and their range began to expand.

With continuing landscape changes, coyotes are now increasingly making their way into suburban and urban environments — including New York City, Los Angeles and cities in the Pacific Northwest — where they live, mainly off rodents and small mammals, without fear of hunters.

The aim of the new study, was to understand how a skittish, rural coyote can sometimes transform into a bold, urban one — a shift that can exacerbate negative interactions among humans and coyotes. University of Washington biologist Christopher Schell is the first author of the study, Schell said in a statement:

Instead of asking, ‘Does this pattern exist?’ we’re now asking, ‘How does this pattern emerge?’.

A key factor, the researchers suggest, might be parental influence. Coyotes pair for life, and both parents contribute equally to raising the offspring. This may be because of the major parental investment required to raise coyote pups, and the evolutionary pressure to guard them from larger carnivores.

The new study observed eight coyote families at the U.S. Department of Agriculture’s Predator Research Facility in Utah during their first and second breeding seasons. These coyotes are raised in a fairly wild setting, with minimal human contact and food scattered across large enclosures.

Four cute puppies in grassy area with large mother coyote in background.

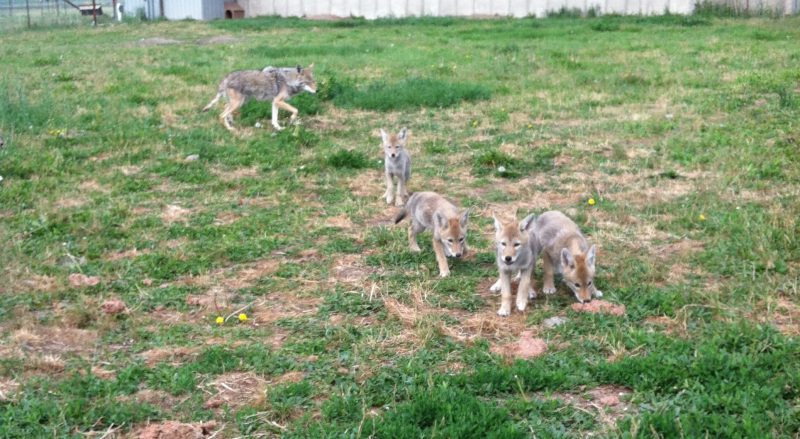
Five-week-old coyote pups eat food rations during the experiment. These second-litter pups were born in 2013 to more-experienced parents, and were more likely to approach a human. Image via USDA National Wildlife Research Center/Christopher Schell.

But during the experiment researchers occasionally placed all the food near the entrance of the enclosure and had a human researcher sit just outside, watching any approaching coyotes, from five weeks to 15 weeks after the birth of the litter. Then they documented how soon the coyotes would venture toward the food. Schell said:

For the first season, there were certain individuals that were bolder than others, but on the whole they were pretty wary, and their puppies followed. But when we came back and did the same experiment with the second litter, the adults would immediately eat the food – they wouldn’t even wait for us to leave the pen in some instances.

Parents became way more fearless, and in the second litter, so, too, were the puppies.

In fact, the most cautious pup from the second-year litter ventured out more than the boldest pup from the first-year litter. Schell said:

The discovery that this habituation happens in only two to three years has been corroborated, anecdotally, by evidence from wild sites across the nation. We found that parental effect plays a major role.

He added:

Even if it’s only 0.001 percent of the time, when a coyote threatens or attacks a person or a pet, it’s national news, and wildlife management gets called in. We want to understand the mechanisms that contribute to habituation and fearlessness, to prevent these situations from occurring.

Bottom line: A new study suggests coyotes puppies learn from their parents how to habituate to humans.

Source: Parental habituation to human disturbance over time reduces fear of humans in coyote offspring

Via University of Washington


from EarthSky https://ift.tt/2OvSZ9d