A Green New Deal must not sabotage climate goals

Recently, 626 organizations—mostly environmental groups, including 350.org and Greenpeace USA—sent a letter to Congress urging lawmakers to consider a number of principles when crafting climate legislation like a Green New Deal “to keep global warming below 1.5 degrees Celsius (2.7 degrees Fahrenheit).” Broadly, there were six major principles in the letter: Halt all fossil fuel leasing, phase out all fossil fuel extraction, end fossil fuel and other dirty energy subsidies; transition power generation to 100 percent renewable energy; expand public transportation and phase out fossil-fuel vehicles; harness the full power of the Clean Air Act; ensure a just transition led by impacted communities and workers; and uphold indigenous rights.

These are generally wise goals, but some concerns about the details caused eight major environmental groups—including the Sierra Club, the Natural Resources Defense Council, and the Environmental Defense Fund—to decline to sign the letter. As one national environmental group spokesperson put it, “the details matter… There is some language that gave us some concern.”

To meet climate targets, we need every tool in the chest. Meeting the Paris climate agreement targets of limiting global warming to less than 1.5 degrees Celsius of global warming above pre-industrial temperatures—or even a more dangerous but more feasible 2 degrees Celsius—would require massive and immediate global action to reduce fossil fuel consumption and carbon pollution. Simply put, we’ve already burned through so much of our carbon budget that meeting those targets would take everything we’ve got. (We’ve already locked ourselves in to close to 1.5 degrees Celsius of warming, just based on greenhouse gas emissions to date.)

But the letter includes language that rules out some zero-carbon technologies. For example, it states, “in addition to excluding fossil fuels, any definition of renewable energy must also exclude all combustion-based power generation, nuclear, biomass energy, large scale hydro and waste-to-energy technologies. To achieve this, the United States must shift to 100 percent renewable power generation by 2035 or earlier.”

The listed energy sources all have pros and cons, and groups concerned about their non-climate environmental impacts could certainly make the case for eventually phasing out each one. But the United States currently gets about 32 percent of its electricity generation from natural gas, 30 percent from coal, 20 percent from nuclear, 7 percent from hydroelectricity, 6 percent from wind, and 1 percent from solar, in round numbers. (The remaining few percent come from miscellaneous energy sources such as geothermal, landfill gas, wood, and others.) Were nuclear and hydroelectric power to be eliminated as energy sources at the same time as all fossil fuels, that means that the United States would have to replace its top four electricity sources (nearly 90 percent of its supply) within about 15 years.

Simply replacing all forms of fossil fuels alone (63 percent of the supply) with zero-carbon technologies within this short timeframe would already be an immense task. And the figures here are strictly referring to what it is required for electricity generation in the United States; they don’t even account for other voracious energy-consuming sectors like transportation—which bring the fossil-fuel share of the US economy up to 80 percent, plus another 9 percent from nuclear and 7 percent from hydroelectric power and biomass. Why make the already gargantuan task so much more difficult?

Germany provides a cautionary tale for environmental groups. The country implemented what it called an “Energiewende” (energy transition) strategy that prioritized the phase-out of nuclear power over replacing fossil fuels, despite its goal of achieving a low-carbon energy supply. For example, in the year 2000, 50 percent of Germany’s electricity was supplied by coal compared to 29 percent from nuclear power and 7 percent from renewables. In 2015, the share was 46 percent coal, 15 percent nuclear, and 33 percent renewables. In other words, the country’s coal consumption has remained nearly unchanged since the turn of the century—from 50 percent coal to 46 percent coal. Instead, Germany’s rapid deployment of renewable energy has primarily replaced its nuclear power plants.

There are certainly legitimate objections to nuclear power, but it is nevertheless a zero-carbon energy source. If we consider climate change an urgent, existential threat and if we want to meet the Paris climate targets, then eliminating fossil fuels must be our first priority. Only after fossil fuels have been replaced can we consider doing the same to other zero-carbon energy sources.

Click here to read the rest


from Skeptical Science http://bit.ly/2sY1Vdt

New research, January 21-27, 2019

A selection of new climate related research articles is shown below.

Climate change

Temperature, precipitation, wind

Addressing the relocation bias in a long temperature record by means of land cover assessment

Interannual Variability of Summer Surface Air Temperature over Central India: Implications for Monsoon Onset (open access)

Skilful seasonal prediction of Korean winter temperature (open access)

Evaluation of ENACTS‐Rwanda; A New Multi‐Decade, High‐Resolution Rainfall and Temperature Dataset: Climatology

Assessment of temperature and rainfall changes in the Karoun River basin

Volta basin precipitation and temperature climatology: evaluation of CORDEX-Africa regional climate model simulations

Effects of Arctic stratospheric ozone changes on spring precipitation in the northwestern United States (open access)

How well the downscaled CMIP5 models able to reproduce the monsoon precipitation over seven homogeneous zones of India?

Evaluation and Future Projection of Chinese Precipitation Extremes using Large Ensemble High-Resolution Climate Simulations (open access)

Is equatorial Africa getting wetter or drier? Insights from an evaluation of long‐term, satellite‐based rainfall estimates for western Uganda

Spatial patterns and time distribution of Central European extreme precipitation events between 1961 and 2013

Atmospheric moisture measurements explain increases in tropical rainfall extremes

Analysis of near-surface wind speed change in China during 1958–2015

Extreme events

Drought and famine in India, 1870‐2016

Dynamical downscaling the impact of spring Western US land surface temperature on the 2015 flood extremes at the Southern Great Plains: effect of domain choice, dynamic cores and land surface parameterization

Possible causes of the flooding over South China during the 2015/16 winter

Wetland loss impact on long term flood risks in a closed watershed

Incorporating inland flooding into hurricane evacuation decision support modeling

Reexamining the decadal change of tropical cyclogenesis over the South China Sea around the mid‐1990s

Physical–Statistical Model for Summer Extreme Temperature Events over South Korea (open access)

Forcings and feedbacks

On the diurnal, weekly, and seasonal cycles and annual trends in atmospheric CO2 at Mount Zugspitze, Germany, during 1981–2016 (open access)

The role of anthropogenic aerosol forcing in inter‐decadal variations of summertime upper‐tropospheric temperature over East Asia (open access)

Dynamically controlled ozone decline in the tropical mid-stratosphere observed by SCIAMACHY (open access)

An evaluation of Australia as a major source of dust

Diagnosing the impacts of Northern Hemisphere surface albedo biases on simulated climate (open access)

Cryosphere

Four decades of Antarctic Ice Sheet mass balance from 1979–2017

Changes in the mountain glaciers of continental Russia during the twentieth to twenty-first centuries

Quantifying the developed and developing worlds' carbon reduction contributions to Northern Hemisphere cryosphere change

Characterizing the behaviour of surge- and non-surge-type glaciers in the Kingata Mountains, eastern Pamir, from 1999 to 2016 (open access)

Monitoring changes in forestry and seasonal snow using surface albedo during 1982–2016 as an indicator (open access)

Sensitivity of active-layer freezing process to snow cover in Arctic Alaska (open access)

Hydrosphere 

Long-term trend detection and spatiotemporal analysis of groundwater levels using GIS techniques in Lower Bhavani River basin, Tamil Nadu, India

Sea-level rise impacts on longitudinal salinity for a low-gradient estuarine system

Radiation, surface temperature and evaporation over wet surfaces

Atmospheric and oceanic circulation

Interdecadal change of the middle‐upper tropospheric land‐sea thermal contrast in the late 1990s and the associated Northern Hemisphere hydroclimate

Prediction of ocean surface trajectories using satellite derived vs. modeled ocean currents

Indian summer monsoon: Extreme events, historical changes, and role of anthropogenic forcings

The influence of mixing on the stratospheric age of air changes in the 21st century (open access)

Carbon and nitrogen cycles

Interpreting eddy covariance data from heterogeneous Siberian tundra: land-cover-specific methane fluxes and spatial representativeness (open access)

Ecosystem carbon response of an Arctic peatland to simulated permafrost thaw

On the role of climate modes in modulating the air–sea CO2 fluxes in eastern boundary upwelling systems (open access)

Drainage enhances modern soil carbon contribution but reduces old soil carbon contribution to ecosystem respiration in tundra ecosystems

Detection of Fossil and Biogenic Methane at Regional Scales Using Atmospheric Radiocarbon (open access)

Early season N2O emissions under variable water management in rice systems: source-partitioning emissions using isotope ratios along a depth profile (open access)

Large-scale predictions of salt-marsh carbon stock based on simple observations of plant community and soil type (open access)

Global nitrous oxide emissions from pasturelands and rangelands: Magnitude, spatio‐temporal patterns and attribution

Have synergies between nitrogen deposition and atmospheric CO2 driven the recent enhancement of the terrestrial carbon sink?

Climate change impacts 

Mankind

Predicting the impact of climate change on severe wintertime particulate pollution events in Beijing using extreme value theory

Responses of water insecure coastal communities of Tanzania to climate change impacts. Is it incremental or transformative adaptation?

Estimating investments in knowledge and planning activities for adaptation in developing countries: an empirical approach

Modeling spatial climate change landuse adaptation with multi-objective genetic algorithms to improve resilience for rice yield and species richness and to mitigate disaster risk (open access)

Impacts of global warming on confined livestock systems for growing-fattening pigs: simulation of heat stress for 1981 to 2017 in Central Europe (open access)

The impact of extreme weather events on livestock populations: the case of the 2011 drought in Mexico

Biosphere

A new process-based model for predicting autumn phenology: How is leaf senescence controlled by photoperiod and temperature coupling?

The effects of local climate on the correlation between weather and seed production differ in two species with contrasting masting habit

Effects of girdling on stem CO2 efflux and its temperature sensitivity in Chinese fir and sweetgum trees

Redefining temperate forest responses to climate and disturbance in the eastern United States: New insights at the mesoscale

Global patterns of body size evolution in squamate reptiles are not driven by climate

Climate‐driven convergent evolution of plumage colour in a cosmopolitan bird

Growing season and radial growth predicted for Fagus sylvatica under climate change

Patterns of modern pollen and plant richness across northern Europe

Climate change mitigation

Climate change communication

Internet Memes, Media Frames, and the Conflicting Logics of Climate Change Discourse

How Aware Are Other Nations of Climate Change? Analyzing Germans’ Second-Order Climate Change Beliefs About Chinese, US American and German People

Public trust in energy suppliers’ communicated motives for investing in wind power

Canadian Weathercasters’ Current and Potential Role as Climate Change Communicators

Climate Policy

Whither the forest transition? Climate change, policy responses, and redistributed forests in the twenty-first century

Tax incentives to modernize the energy efficiency of the housing in Spain

Energy production

The bright side of PV production in snow-covered mountains

Projected climate change impacts on Indiana’s Energy demand and supply

Emission savings

Quantifying barriers to decarbonization of the Russian economy: real options analysis of investment risks in low-carbon technologies

Simulating growth-based harvest adaptive to future climate change (open access)

Assessing the carbon and climate benefit of restoring degraded agricultural peat soils to managed wetlands

Heterogeneity of grassland soil respiration: Antagonistic effects of grazing and nitrogen addition

Geoengineering

Assessing the terrestrial capacity for Negative Emission Technologies in Ireland

CO2 leakage can cause loss of benthic biodiversity in submarine sands (open access)

Other papers

Palaeoclimatology

Flooding of the Caspian Sea at the intensification of Northern Hemisphere Glaciations

Vegetation and climate during the penultimate interglacial of the northeastern Russian Arctic: the Lake El'gygytgyn pollen record

Heinrich events show two-stage climate response in transient glacial simulations (open access)

Variations of the global annual mean surface temperature during the past 2000 years: results from the CESM1

Other environmental issues 

The short-term effects of air pollutants on hospitalizations for respiratory disease in Hefei, China


from Skeptical Science http://bit.ly/2HULOHE

Smokeless tobacco: 5 common questions about ‘heat not burn’ products answered 

Heated tobacco device

’Heat not burn’ or ‘heated tobacco’ products are electronic devices that, unlike e-cigarettes, contain tobacco leaf and heat it to a high temperature, without setting it alight.

This difference is important. Because the devices contain tobacco, they come with all the long-term health concerns of tobacco. And with the tobacco industry investing heavily in research, development and marketing of these new products, understanding what’s in them is vital.

So how do they work? And are they safe? We caught up with Dr Ed Stephens, a researcher at the University of St Andrews, whose work has compared the health impact of tobacco, e-cigarettes and heat not burn products, to find out more.

What’s in heated tobacco?

Heated tobacco products work by using electricity to heat sticks of tobacco, producing a vapour that’s inhaled. The vapour contains nicotine, chemicals and other tobacco particles that are also found in traditional tobacco smoke.

“I don’t like the term heat not burn,” says Stephens. “The word ‘burn’ has two meanings. The first is to light something so that it catches fire and continues to combust until the fuel runs out, like a candle or a cigarette. The second is to heat something until it chars around the edges – like when you leave a cake in the oven for too long and it chars. Switch the oven off and the charring stops. Heat not burn products don’t burn like a cigarette, but the tobacco is ‘cooked’ and may even char. So it would be better called heat not combust.”

The devices heat tobacco to 350C (662F), far lower than traditional cigarettes that burn at temperatures up to 900C (1,652F), but still high enough for harmful chemicals to be released into the vapour.

Is heated tobacco safe?

There’s some evidence, largely from research funded by the tobacco industry, that heat not burn products may be less harmful than smoking. Studies suggest that the vapour from the devices contains lower levels of harmful chemicals compared to cigarette smoke. But those chemicals were still present at higher levels than usually found in e-cigarettes.

And importantly, unlike nicotine replacement therapies or e-cigarettes, heat not burn products still contain tobacco, so we don’t recommend people start using heated tobacco products.

“They are tobacco products and we do know the long-term effects of tobacco, including at least 15 types of cancer,” says Stephens.

It’s too soon to know how using heat not burn products will affect someone’s health in the long term. Research looking at these tobacco products is still in its early stages and is mostly funded by the tobacco industry, rather than independent researchers. This means the results may be less reliable, as the tobacco industry wants to promote their new products and has a long history of distorting their harm.

Is heated tobacco the same as an e-cigarette?

No. The big difference is that heat not burn products contain tobacco leaf, whereas e-cigarettes don’t.

On top of that, e-cigs don’t always contain nicotine. But heat not burn products always will.

There’s a lot of evidence to suggest that e-cigarettes are far less harmful than smoking, as well as having the potential to help people quit smoking tobacco. But this evidence isn’t there for heated tobacco products.

Can heated tobacco help people quit smoking?

So far there’s no evidence that switching to heated tobacco products helps people to quit cigarette smoking.

If you’re looking to stop smoking, or stop using any form of tobacco, you’re around three times more likely to quit using NHS Stop Smoking Services compared to going it alone. These services can discuss the different options available and provide support to give you the best possible chance of quitting. If medication hasn’t worked for you in the past, they can also help you try an e-cigarette to quit.

How popular is heated tobacco?

In 2017, it was estimated that 1.7% of adults in Great Britain had tried a heated tobacco product. This compares to 19% of adults who had tried an e-cigarette.

“In a country like Japan, use of heat not burn products is relatively high,” says Stephens. “But in Japan, nicotine-containing e-cigarettes are illegal, whereas in the UK they have been actively promoted by public health bodies. This may be one reason that heat not burn is less popular in the UK. They’re also more expensive than e-cigarettes, and much newer to the market.”

But Stephens warns that the tobacco industry will try to push these products more aggressively all over the world. “The tobacco industry’s long-term future depends on the success of heat not burn and e-cigarettes, so they’re going to throw loads of money at this in any way they can.”

The lowdown on heat not burn

Stephens says there are still a lot of unanswered questions about the short and long-term health impacts of using heated tobacco, and that longer-term studies are needed.  But even if these products are less harmful than cigarettes, he wouldn’t recommend them.

“If a relative of mine was a smoker, I would advise them to try the conventional route of nicotine replacement therapy, preferably with support from a Stop Smoking Service, to quit,” says Stephens. “And if that didn’t work, I’d suggest they try an e-cigarette and seek support at a Stop Smoking Service.”

Emily Whiteside is a policy officer at Cancer Research UK


from Cancer Research UK – Science blog http://bit.ly/2SqcvZa

Will you catch the moon and Saturn before sunrise February 2?

Have you seen Saturn yet? It’s just now returning to the east before sunup. Before dawn on February 2, 2019, see if you can catch the slender waning crescent moon near Saturn. Watch for the twosome to appear low in the southeast as darkness gives way to dawn (90 to 75 minutes before sunrise).

Can’t spot ’em? Try using the brilliant planets Venus and Jupiter as guides. A line between these two bright worlds will point to the moon and Saturn near the sunrise point on the horizon. That’ll be true no matter where you are on the globe.

EarthSky lunar calendars are cool! They make great gifts. Order now. Going fast!

For the most favorable view of the moon and Saturn, from anywhere worldwide, find an unobstructed horizon in the direction of sunrise. From northerly latitudes in particular, the moon and Saturn will be nestling low in the morning twilight. Bring along binoculars if you have them, especially if your viewing conditions are less than ideal.

The rising times of the moon and Saturn will vary around the world. At more southerly latitudes, the moon and Saturn rise before dawn’s first light; and at more northerly latitudes, the moon and Saturn come up closer to sunrise. Click here to find out the rising times for the U.S. or Canada.

Or try this link for their rising times for U.S. and Canada locations, plus other spots worldwide.

Although Saturn is as bright as a 1st-magnitude star, this planet’s luster will appear tarnished by the early morning twilight, especially as seen from far northerly latitudes (for example, Canada or Alaska). If you can spot the thin moon, but not Saturn, binoculars might help you glimpse nearby Saturn in the glow of dawn.

The featured sky chart at the top of this post is especially made for mid-northern North American latitudes. However, from virtually everyplace worldwide, the moon and Saturn snuggle up quite close together on the sky’s dome before sunrise February 2. As viewed from North America, the moon sits below Saturn on February 2 before sunrise. However – on February 2 in Asia, Australia and New Zealand – the moon hovers above Saturn in the morning sky.

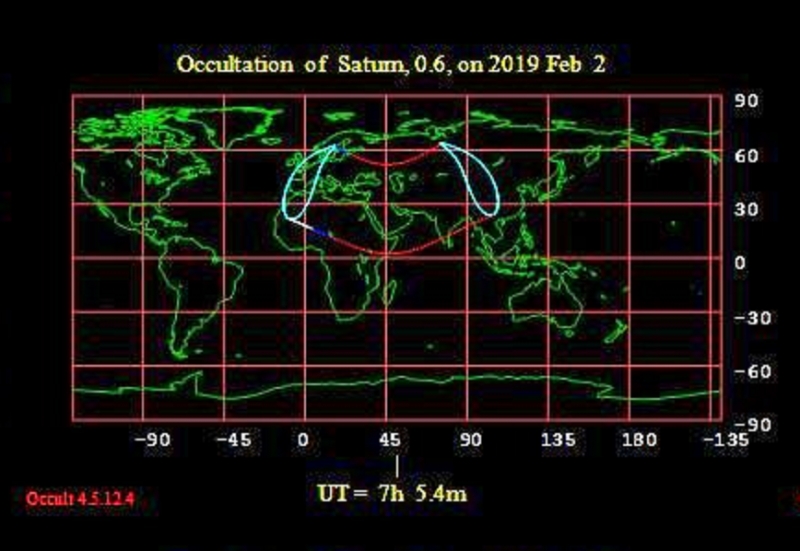
And, from a very small swath in Europe and Africa, you may see the moon but not Saturn before sunup on January 2. Where will Saturn be? It’ll be behind the moon, temporarily. This event is called an occultation of Saturn.

Worldwide map with lines showing where occultation will occur.

The occultation of Saturn on February 2, 2019, takes place in a predawn/dawn sky from a very small section of the world. The area between the red lines has the occultation taking place in the daytime. The blue depicts morning twilight and white represents a predawn sky. Map via IOTA.

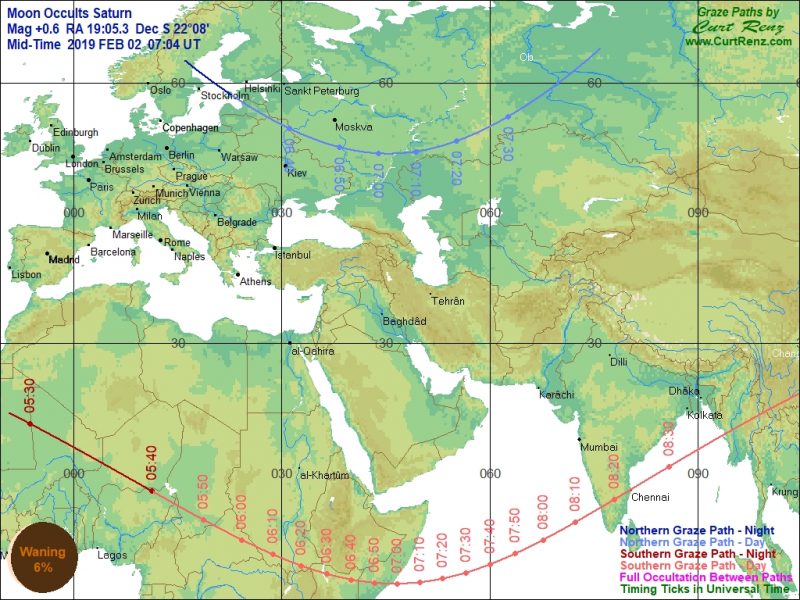
For instance, as seen from Berlin, Germany, on February 2, 2019, the moon will occult Saturn from 6:51 a.m. to 7:38 a.m. Central European Time. On the map below, via Curt Renz, the occultation takes place in a dark sky to the north or above the dark red line at the bottom left (running through western Africa), and to the south or below the dark blue line at the upper left (running just north of Stockholm, Sweden).

Map of Europe, the Middle East, and part of Africa with lines showing zone of occultation.

Map of the February 2, 2019 occultation of Saturn by the moon. The moon will pass in front of Saturn, as seen before sunrise, only in limited parts of Europe and northwest Africa. Image via Curt Renz.

Slice of moon on the right with tiny ringed Saturn just past the left edge, telescopic view.

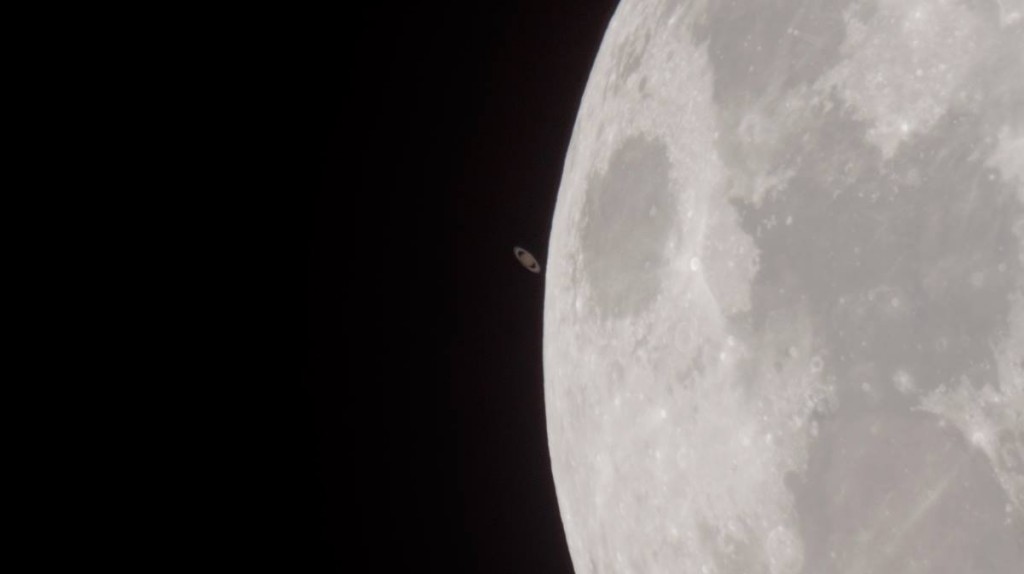
This is what an occultation of Saturn has to offer. It’s Saturn and the moon (r) shortly after an occultation – May 14, 2014 – as seen from Western Australia. Photo by Colin Legg Photography.

In 2019, the moon will occult Saturn every month from now through November. But you have to reside at just the right place on Earth to witness any one of these occultations.

This time around – on February 2, 2019 – it’ll be a slender waning crescent moon that occults Saturn, with Saturn disappearing behind the moon’s illuminated side and then reappearing on the moon’s dark side. The moon’s phase will increase with each monthly occultation of Saturn, until the full moon occults Saturn on July 16, 2019. Click here for more information.

Chart with many views of Saturn with rings at different angles.

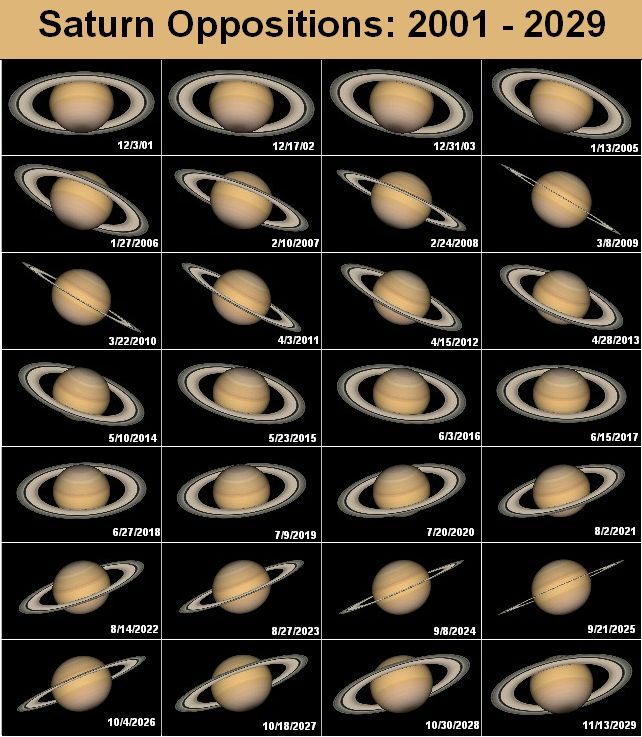
Saturn is just now returning to the east before dawn. Throughout 2019 – or any year – the tilt of Saturn’s rings will have a great impact on this world’s overall brightness. In years when Saturn’s rings are edge-on as seen from Earth (2009 and 2025), Saturn appears considerably dimmer than in years when Saturn’s rings are maximally titled toward Earth (2017 and 2032). In 2019, Saturn’s rings aren’t maximally inclined, but they’re still highly inclined toward Earth. Image via Wikimedia Commons.

Bottom line: Before sunrise on February 2, 2019, try your luck catching the moon and Saturn beneath the two dazzling morning planets, Venus and Jupiter!


from EarthSky http://bit.ly/2HMZiVZ

Speedy comet approaching Earth’s vicinity

Star field with small fuzzy green spot.

Comet C/2018 Y1 (Iwamoto) is seen at the bottom of this beautiful image by Rolando Ligustri. Used with permission.

A new celestial visitor – a comet – was discovered by Japanese astronomer Masayuki Iwamoto in late 2017. It’ll provide nice opportunities for astrophotographers, as it will pass close to a couple of Messier objects in February 2019. It’s a fast-moving comet that will be closest to Earth on February 12, 2019, at around 2:57 p.m. ET (19:57 UTC; translate to your time zone). The celestial visitor will safely pass by Earth at some 28 million miles (45 million km). The comet has been designated C/2018 Y1 (Iwamoto).

This comet is fast! Comet C/2018 Y1 (Iwamoto) is traveling through space at the amazing speed of 147,948 miles per hour (238,099 km/h) or 66 km per second, relative to Earth.

The best nights for observing the comet (with binoculars and small telescopes) should be on February 11 and 12.  Preliminary estimates suggest the newly found comet might reach a brightness or magnitude between 7 and 7.8 , which means it should be easily seen with small telescopes and binoculars. It will not be visible to the eye alone.

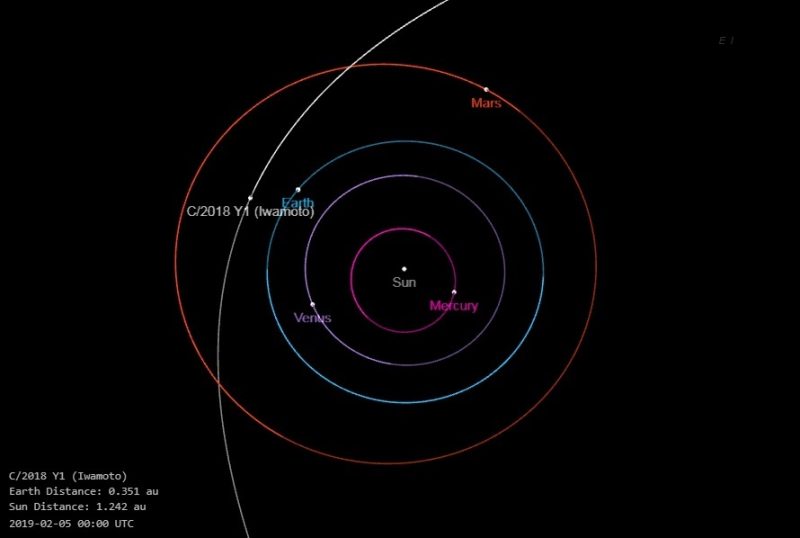
Long arc-shaped partial orbit crossing nearly circular planetary orbits.

A closer look at comet C/2018 Y1 (Iwamoto)’s orbit. Image via NASA/JPL.

During closest approach to Earth, comet Iwamoto will be located in front of the constellation Leo the Lion, which is visible late at night at this time of year.

Astrophotographers might be able to capture this comet passing close to some galaxies, as seen from our perspective. See the illustrations below:

Star chart.

Late on the night of Saturday, February 2, 2019, Comet C/2018 Y1 (Iwamoto) passes close to M104 (Sombrero Galaxy), providing a nice opportunity to astrophotographers. Illustration by Eddie Irizarry using Stellarium.

On February 2, 2019, comet Iwamoto passes close to Messier 104 (Sombrero Galaxy), while by February 10, 2019, the celestial visitor will appear passing very close to Messier 95, a galaxy in the constellation Leo.

Star chart.

Facing east on February 10, 2019 at around 10 p.m. CT as seen from the central US. Comet C/2018 Y1 (Iwamoto) will pass close to some galaxies in Leo, especially Messier 95. Illustration by Eddie Irizarry using Stellarium.

Star chart with comet's path on it.

Location of comet C/2018 Y1 (Iwamoto) from February 10 to 12, 2019.  Binoculars should provide a nice view of the fuzzy patch of light, while telescopes might allow seeing a hint of a green color. Facing east at 10 p.m. CT as seen from central U.S. Illustration by Eddie Irizarry using Stellarium.

The comet was detected in images taken on December 18, 2018.

Star field with big fuzzy green spot.

Comet C/2018 Y1 (Iwamoto) looks great in this image taken on January 17, 2019, by Rolando Ligustri.

We will keep you updated …

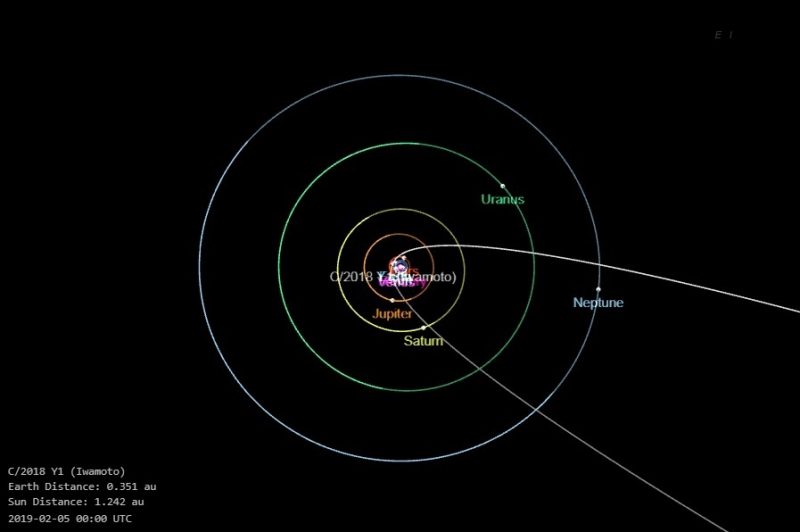
Comet's orbit zooming in from far distance, whipping around the sun, and heading back out.

The orbit of comet C/2018 Y1 (Iwamoto) is very elliptical (elongated). Its orbit suggests this comet came from the Oort cloud of comets surrounding our solar system.

Bottom line: A new comet soon to be within reach of binoculars and small telescopes is heading toward a February 2019 encounter with the sun and Earth. It’ll pass Earth safely on February 11-12.

EarthSky lunar calendars are cool! They make great gifts. Order now. Going fast!


from EarthSky http://bit.ly/2Sn8mSb

Zodiacal light back in the west after sunset

A dark horizon and graying sky, with a lighted cone extending up from the horizon.

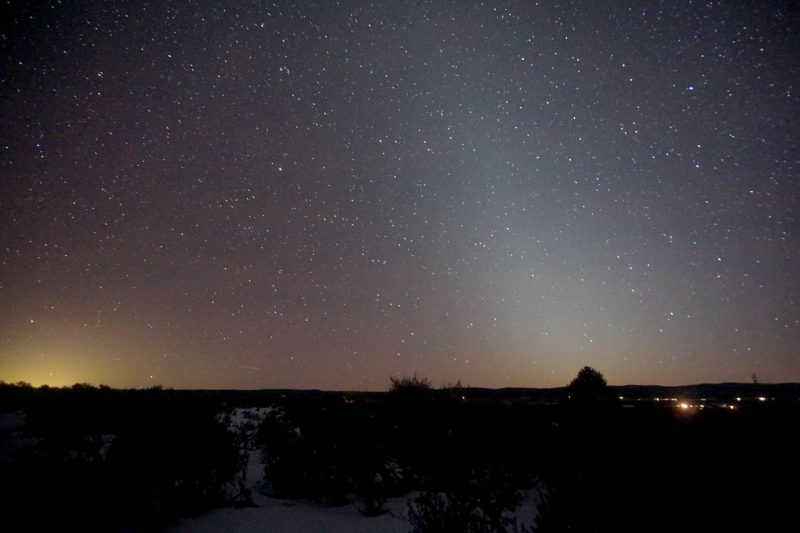
View larger at EarthSky Community Photos. | That lighted cone in the west after sunset, visible in dark skies after all traces of twilight have disappeared, is the zodiacal light. Mike Lewinski in Tres Piedras, New Mexico caught it on January 27, 2019 while creating this timelapse video. The video is great, because it shows you how the zodiacal light will appear, after twilight disappears. Mike wrote: “As we near the cross-quarter day, the zodiacal light has returned to the western sky at sunset (in the fall it is in the eastern sky before sunrise) … Last night, I noticed it with the unaided eye.” Thank you, Mike!

Read more: What is the zodiacal light?


from EarthSky http://bit.ly/2Rv84ro

Groundhog Day is an astronomy holiday

Small furry animal standing upright.

Image via kidskonnect.

Ah, Groundhog Day. Punxsutawney Phil – called the world’s most beloved seasonal prognosticator by his handlers in Punxsutawney, Pennsylvania – might or might not see his shadow on this Groundhog Day 2019. This U.S. and Canadian tradition comes every year on February 2. It has its roots in astronomy, in the sense that it’s a seasonal festival, tied to the movement of Earth around the sun. It’s a great excuse to go outside and enjoy some revelry during the winter months.

We all know the rules of Groundhog Day. On February 2, a groundhog is said to forecast weather by looking for his shadow. If it’s sunny out, and he sees it, we’re in for six more weeks of winter. On the other hand, a cloudy Groundhog Day is supposed to forecast an early spring.

Of course, it can’t be cloudy, or sunny, everywhere at once. And many towns in the U.S. and Canada have their own local groundhogs and local traditions for Groundhog Day.

Men in dark winter coats and hats, one holding a groundhog; crowd watching.

… the great weather prognosticator. See Phil on the left? Image via Wikimedia Commons.

Punxsutawney Phil, the great weather prognosticator. By far the most famous of the February 2 shadow-seeking groundhogs is Punxsutawney Phil in Punxsutawney, in western Pennsylvania, which calls itself:

… original home of the great weather prognosticator, His Majesty, the Punxsutawney Groundhog.

Since 1887, members of the Punxsutawney Groundhog Club have held public celebrations of Groundhog Day. Punxsutawney is where Bill Murray was in the movie Groundhog Day. From the looks of things … a good time is had by all.

How accurate is Phil? NOAA’s National Climatic Data Center says Phil’s forecasts have shown no predictive skill in recent years.

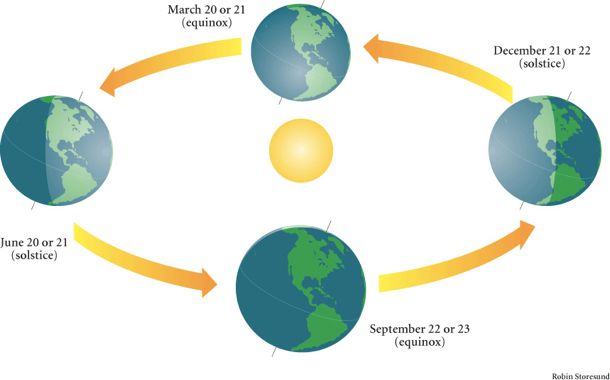
Diagram showing Earth's positions at the equinoxes and solstices.

The equinox is an event that takes place in Earth’s orbit around the sun.

Groundhog Day has its roots in astronomy. What you might not know is that Groundhog Day is really an astronomical holiday.

It’s an event that takes place in Earth’s orbit around the sun, as we move between the solstices and equinoxes. In other words, Groundhog Day falls more or less midway between the December solstice and the March equinox. Each cross-quarter day is actually a collection of dates, and various traditions celebrate various holidays at this time. February 2 is the year’s first cross-quarter day.

Of course, the division of the year into segments is common to many cultures. Our ancestors were more aware of the sun’s movements across the sky than we are, since their plantings and harvests depended on it.

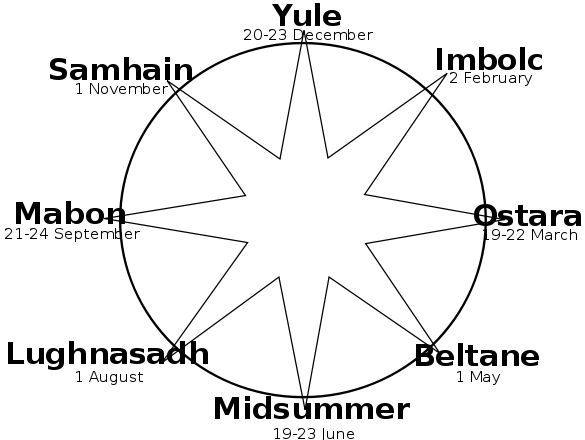
Wheel with eight-point star in it, the points labeled with pagan holiday names.

Neo-pagan wheel of the year. Image via Wikimedia Commons.

Groundhog Day in various cultures. In the Celtic calendar, the year is also divided into quarter days (equinoxes and solstices) and cross-quarter days on a great neo-pagan wheel of the year. Thus, just as February 2 is marked by the celebration of Candlemas by some Christians, such as the Roman Catholics, in contemporary paganism, this day is called Imbolc and is considered a traditional time for initiations.

The celebration of Groundhog Day came to America along with immigrants from Great Britain and Germany. The tradition can be traced to early Christians in Europe, when a hedgehog was said to look for his shadow on Candlemas Day.

Try this old English rhyme:

If Candlemas Day be fair and bright, winter will have another flight. But if it be dark with clouds and rain, winter is gone and will not come again.

Or here’s another old saying:

Half your wood and half your hay, you should have on Candlemas Day.

In Germany it used to be said:

A shepherd would rather see a wolf enter his stable on Candlemas Day than see the sun shine.

There, a badger was said to watch for his shadow.

A friend on Facebook said that, in Portugal, people have a poem about February 2 related to the Lady of Candles. Here’s the poem:

Quando a Senhora das Candeias está a rir está o inverno para vir, quando está a chorar está o inverno a acabar. [Translation: If Our Lady of Candles smiles (Sun) the winter is yet to come, if she cries (Rain) the winter is over.]

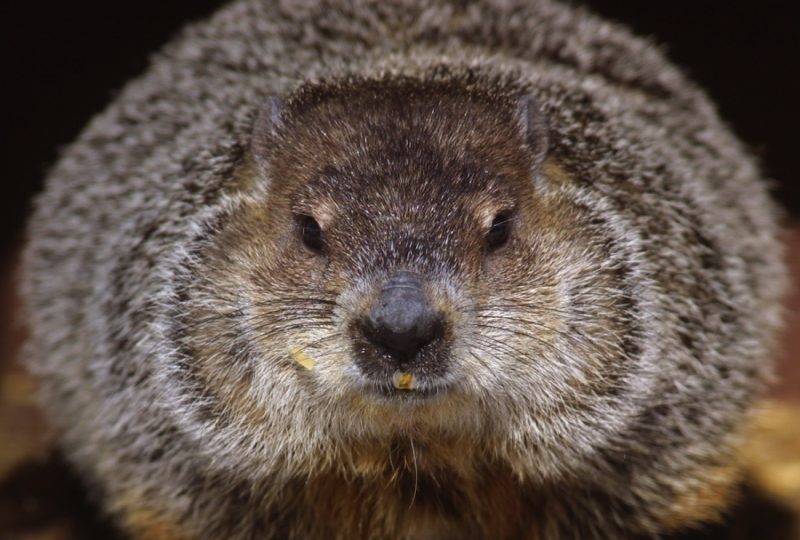
Closeup of furry, round groundhog's face with black nose and small eyes.

Cloudy, one of the groundhogs at Brookfield Zoo in Brookfield, Illinois. contemplates an exit from her wooden home on Groundhog Day. Photo via Tim Boyle/Newsmakers.

One final note. It’s supposed to be bad luck to leave your Christmas decorations up after Groundhog Day.

The National Geographic Society once studied the groundhog and found him right only one out of every three times. But what the heck? It’s all in good fun.

So, you may celebrate with a real groundhog and a real shadow – or just pause a moment on this day to reflect on the passing of the seasons.

Enjoying EarthSky so far? Sign up for our free daily newsletter today!

Bottom line: February 2 is Groundhog Day. It’s a celebration with roots in astronomy, in the sense that it’s a seasonal festival, approximately halfway between a solstice and an equinox. Astronomers call it a cross-quarter day.

EarthSky lunar calendars are cool! They make great gifts. Order now. Going fast!


from EarthSky http://bit.ly/2RwgT43