Story of the Week... Editorial of the Week... Toon of the Week... Quote of the Week... SkS in the News... Coming Soon on SkS... Climate Feedback Reviews... SkS Week in Review... Poster of the Week...
Story of the Week...
Protest by 16-year-old Greta Thunberg snowballs to last day of World Economic Forum
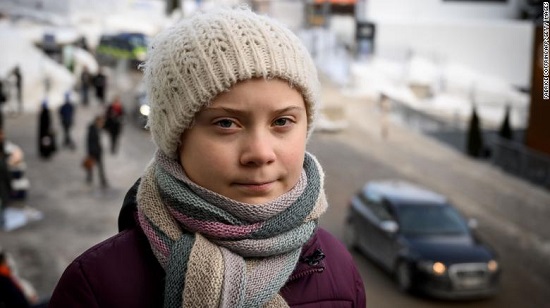
Swedish youth climate activist Greta Thunberg at the World Economic Forum in Davos, eastern Switzerland. Photograph: Fabrice Coffrini/AFP/Getty Images
The 16-year-old activist behind the fast-growing School Strikes 4 Climate Action has taken her campaign to the streets of Davos, to confront world leaders and business chiefs about the global emissions crisis.
Greta Thunberg, whose solo protest outside Sweden’s parliament has snowballed across the globe, will join a strike by Swiss schoolchildren in the ski resort on Friday – the final day of the World Economic Forum.
Thunberg travelled by train for 32 hours to reach Davos, and spent Wednesday night camped with climate scientists on the mountain slopes – where temperatures plunged to -18C.
Having already addressed the UN Climate Change COP 24 conference, Thunberg is rapidly becoming the voice for a generation who are demanding urgent action to slow the rise in global temperatures.
As she travelled down Davos’s funicular railway from the Arctic Base Camp – while more than 30,000 students were striking in Belgium - Thunberg said the rapid growth of her movement was “incredible”.
“There have been climate strikes, involving students and also adults, on every continent except Antarctica. It has involved tens of thousands of children.”
Teenage activist takes School Strikes 4 Climate Action to Davos by Graeme Wearden & Damian Carrington, Environment, Guardian, Jan 24, 2019
Editorial of the Week...
This Could Be The Biggest Scandal Of The Climate Change Era
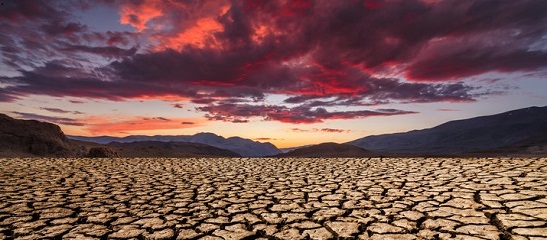
The world is headed for up to 5 degrees Celsius (9 F) of global warming above pre-industrial levels by 2100, which would lead to devastating consequences for billions of people. Credit: Anton Petrus via Getty Images
Governments and businesses habitually set out emergency response plans to protect their economies, jobs, cities and other crucial assets from potential disaster. Yet when it comes to climate change ― the biggest, most urgent threat the world faces ― there is no emergency plan.
On the issue of our lifetime, countries can agree very little. The World Economic Forum’s Global Risks Report 2019 published last Tuesday found that increasing divisions between the world’s major powers is the most urgent global risk we face because it stymies vital collective action on climate change.
Instead of action, we see delays, rejections and avoidance, as December’s United Nations climate summit in Katowice, Poland, so acutely reminded us. The event, which brought together world leaders, scientists, campaigners and the private sector, settled most of the rules needed to ensure countries follow the climate pledges they have made to date. What it failed to do is push countries to step up their targets for cutting greenhouse gas emissions ― currently the only viable way to prevent climate breakdown. The Middle East, the U.S. and Russia refused to even welcome landmark scientific predictions on climate change, signaling their intention to continue blocking progress.
This Could Be The Biggest Scandal Of The Climate Change Era, Opinion by Sandrine Dixson-Declève & Anders Wijkman, Huffington Post, Jan 23, 2019
Toon of the Week...
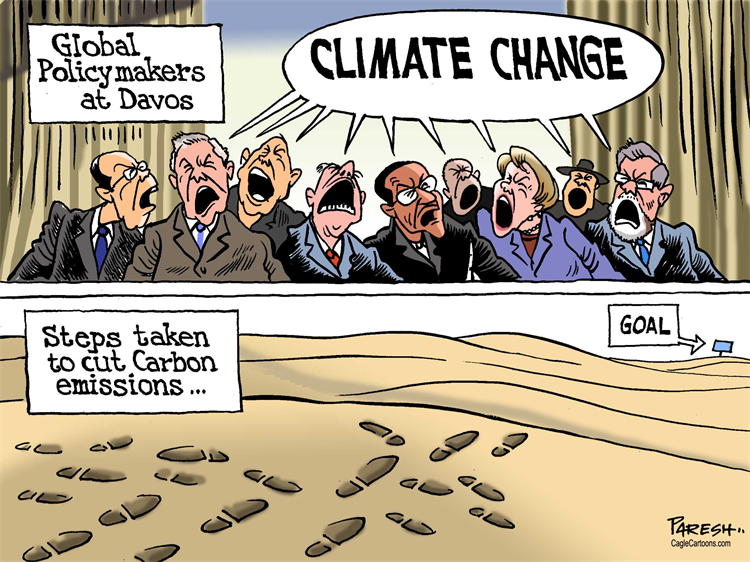
Hat tip to Stop Climate Denial Facebook page.
Quotes of the Week...
But the tone has shifted. The feeling is more dire. I don’t know what kids are supposed to do with the sobering fact that their planet is changing for the worse.
According to Laura Kastner, a clinical psychologist and professor in the psychology department and the department of psychiatry and behavioral sciences at the University of Washington, the way to teach kids about environmental issues is not by overwhelming them with data or presenting them with projected outcomes they can see no way of changing. It’s by being realistic with kids and also teaching them agency and action.
It’s what Kastner describes as the “both-and.” The idea of first acknowledging that, yes, climate change is happening, and there are things we can do to help. “We really are going to have to deal with this, and there is so much to do, so let’s get to work,” she said. “We want to be responsible and smart and informed about what’s happening, and we want to be hopeful and agentic.”
Heather Price, an atmospheric chemist, climate scientist and chemistry instructor at North Seattle College, who has presented climate science to members of Congress, says that whenever she gives a talk about rising temperatures, ocean acidification and mass extinctions, she always spends at least a quarter of her time discussing the areas where scientists see hope and how people are already altering the trajectory. For example, the capacity of renewable energy in the United Kingdom has surpassed that of fossil fuels for the first time, and in the United States, electric car sales were up 81 percent in 2018 over sales in 2017. Price knows the science is depressing. “But,” she says, “it’s not on the science side where the good things are happening. It’s on the mitigation, on the solutions.”
Ways to help kids cope with — and help combat — climate change by Ronit Feinglass Plank, Lifestyles, Washington Post, Jan 22, 2019
SkS in the News...
[To be added.]
Coming Soon on SkS...
[To be added.]
Climate Feedback Reviews...
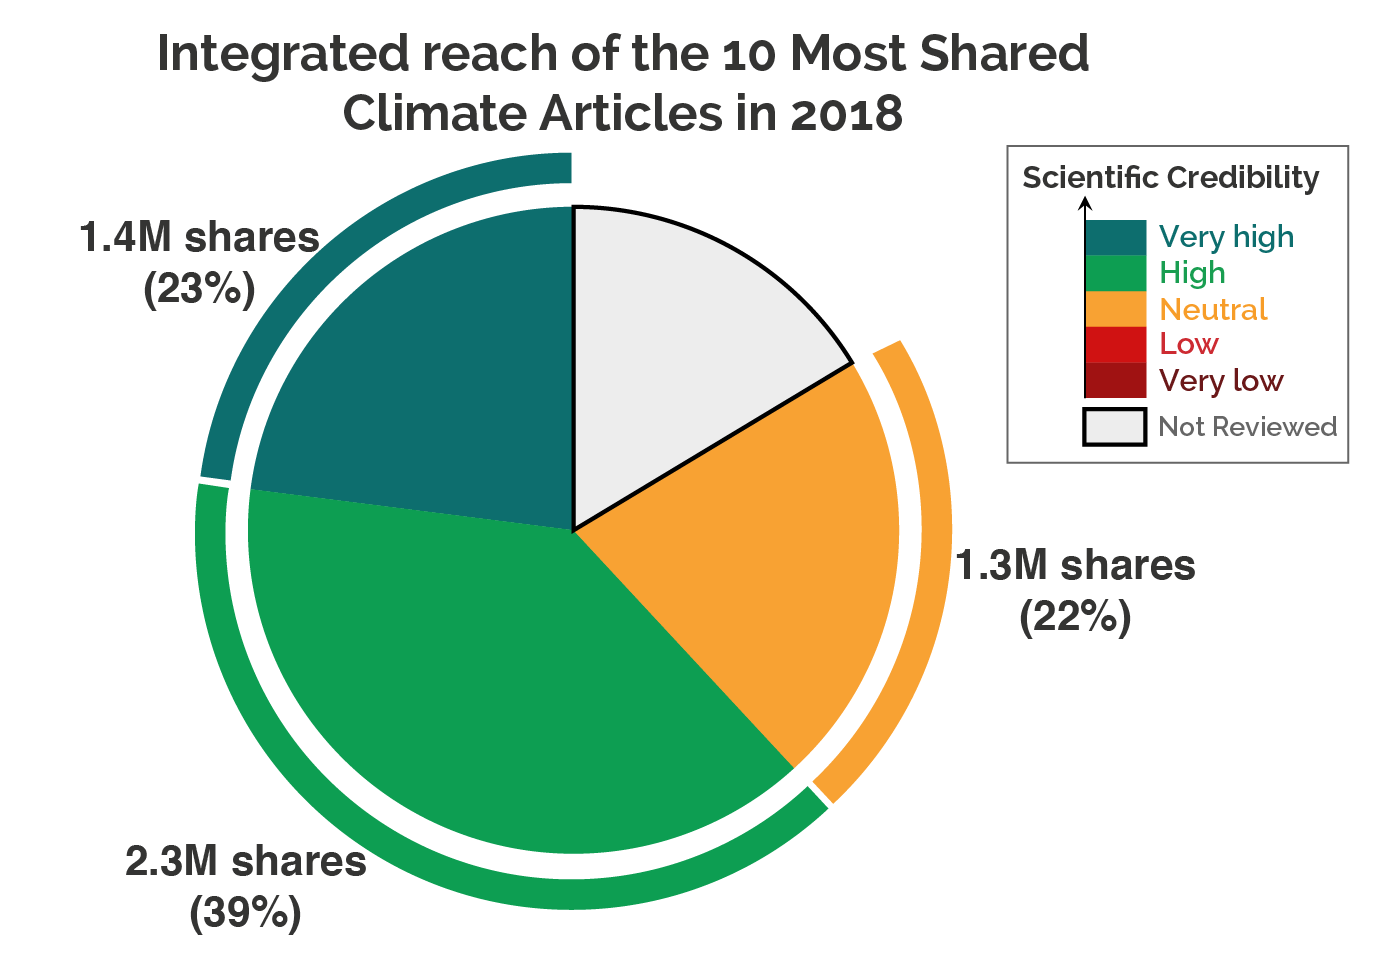
How credible were 2018’s most popular climate articles?
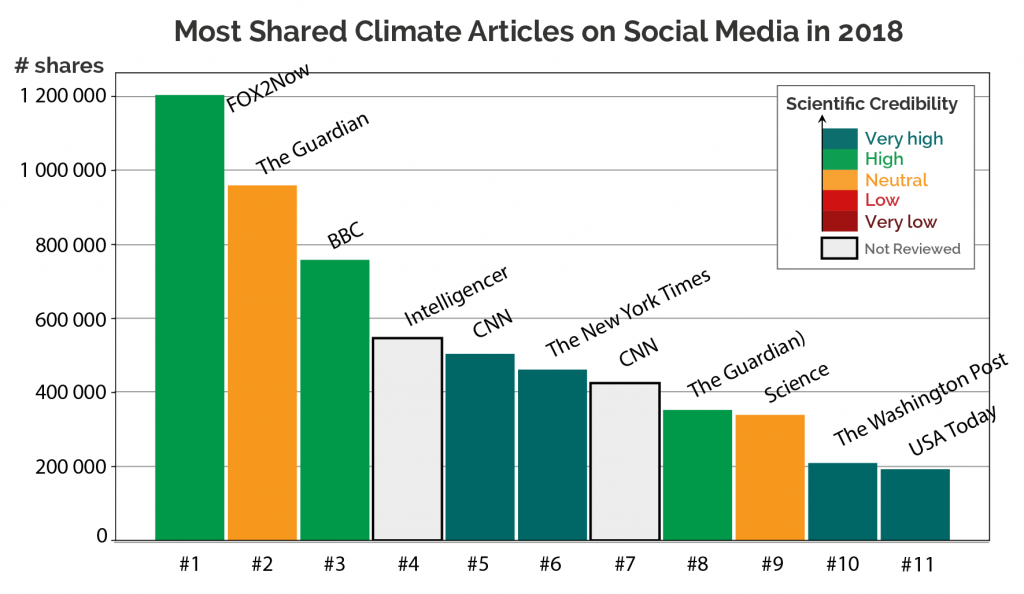
Summary
To investigate whether last year’s most “viral” climate change stories misled the people who read them, we asked scientists to evaluate a list of top articles (as we did last year). In November, we searched Buzzsumo for the climate articles[1] with the most shares and interactions—as many as 1.2 million in the top spot—selecting the top 10 that focused on verifiable statements about climate science. (One more story entered the list in December.) Two stories did not receive any reviews, but all the evaluations and comments we collected can be found below.
Compared to last year’s top 10, there is a notable lack of low credibility stories. Two stories garnered mixed reviews from scientists. In one case, this was an article detailing false claims about sea level rise made by politicians, in which some reviewers felt the article simply wasn’t clear enough in its corrections. But there were no articles from partisan outlets presenting inaccurate rejections of climate system at the top in 2018. Instead, the list was dominated by major news outlets—with the exception of the top story, which was published by the local FOX station in St. Louis.
This leads to an interesting question we unfortunately cannot answer at this stage: is this improvement in the credibility of the most-shared articles the result of recent changes to social media algorithms or just chance?
Almost half of the stories in this list cover major IPCC and US National Climate Assessment reports released last year. It also seems clear that people are interested in learning about (or commenting on) the environmental impacts of diet. The #4 story of 2017 was about the greenhouse gas emissions associated with beef production, and two of 2018’s top stories are on the same topic.
Several of the remaining stories featured dramatic headlines on events related to climate trends—things like winter warm spells at the North Pole or the 400th consecutive month warmer than the 20th century average. The most popular story (titled “NASA releases time-lapse of the disappearing Arctic polar ice cap”) was actually an article on the 2017 global surface temperature ranking that included a NASA animation of Arctic sea ice changes over the years.
SkS Week in Review...
Poster of the Week...
from Skeptical Science http://bit.ly/2TibJKO
Story of the Week... Editorial of the Week... Toon of the Week... Quote of the Week... SkS in the News... Coming Soon on SkS... Climate Feedback Reviews... SkS Week in Review... Poster of the Week...
Story of the Week...
Protest by 16-year-old Greta Thunberg snowballs to last day of World Economic Forum
Swedish youth climate activist Greta Thunberg at the World Economic Forum in Davos, eastern Switzerland. Photograph: Fabrice Coffrini/AFP/Getty Images
The 16-year-old activist behind the fast-growing School Strikes 4 Climate Action has taken her campaign to the streets of Davos, to confront world leaders and business chiefs about the global emissions crisis.
Greta Thunberg, whose solo protest outside Sweden’s parliament has snowballed across the globe, will join a strike by Swiss schoolchildren in the ski resort on Friday – the final day of the World Economic Forum.
Thunberg travelled by train for 32 hours to reach Davos, and spent Wednesday night camped with climate scientists on the mountain slopes – where temperatures plunged to -18C.
Having already addressed the UN Climate Change COP 24 conference, Thunberg is rapidly becoming the voice for a generation who are demanding urgent action to slow the rise in global temperatures.
As she travelled down Davos’s funicular railway from the Arctic Base Camp – while more than 30,000 students were striking in Belgium - Thunberg said the rapid growth of her movement was “incredible”.
“There have been climate strikes, involving students and also adults, on every continent except Antarctica. It has involved tens of thousands of children.”
Teenage activist takes School Strikes 4 Climate Action to Davos by Graeme Wearden & Damian Carrington, Environment, Guardian, Jan 24, 2019
Editorial of the Week...
This Could Be The Biggest Scandal Of The Climate Change Era
The world is headed for up to 5 degrees Celsius (9 F) of global warming above pre-industrial levels by 2100, which would lead to devastating consequences for billions of people. Credit: Anton Petrus via Getty Images
Governments and businesses habitually set out emergency response plans to protect their economies, jobs, cities and other crucial assets from potential disaster. Yet when it comes to climate change ― the biggest, most urgent threat the world faces ― there is no emergency plan.
On the issue of our lifetime, countries can agree very little. The World Economic Forum’s Global Risks Report 2019 published last Tuesday found that increasing divisions between the world’s major powers is the most urgent global risk we face because it stymies vital collective action on climate change.
Instead of action, we see delays, rejections and avoidance, as December’s United Nations climate summit in Katowice, Poland, so acutely reminded us. The event, which brought together world leaders, scientists, campaigners and the private sector, settled most of the rules needed to ensure countries follow the climate pledges they have made to date. What it failed to do is push countries to step up their targets for cutting greenhouse gas emissions ― currently the only viable way to prevent climate breakdown. The Middle East, the U.S. and Russia refused to even welcome landmark scientific predictions on climate change, signaling their intention to continue blocking progress.
This Could Be The Biggest Scandal Of The Climate Change Era, Opinion by Sandrine Dixson-Declève & Anders Wijkman, Huffington Post, Jan 23, 2019
Toon of the Week...
Hat tip to Stop Climate Denial Facebook page.
Quotes of the Week...
But the tone has shifted. The feeling is more dire. I don’t know what kids are supposed to do with the sobering fact that their planet is changing for the worse.
According to Laura Kastner, a clinical psychologist and professor in the psychology department and the department of psychiatry and behavioral sciences at the University of Washington, the way to teach kids about environmental issues is not by overwhelming them with data or presenting them with projected outcomes they can see no way of changing. It’s by being realistic with kids and also teaching them agency and action.
It’s what Kastner describes as the “both-and.” The idea of first acknowledging that, yes, climate change is happening, and there are things we can do to help. “We really are going to have to deal with this, and there is so much to do, so let’s get to work,” she said. “We want to be responsible and smart and informed about what’s happening, and we want to be hopeful and agentic.”
Heather Price, an atmospheric chemist, climate scientist and chemistry instructor at North Seattle College, who has presented climate science to members of Congress, says that whenever she gives a talk about rising temperatures, ocean acidification and mass extinctions, she always spends at least a quarter of her time discussing the areas where scientists see hope and how people are already altering the trajectory. For example, the capacity of renewable energy in the United Kingdom has surpassed that of fossil fuels for the first time, and in the United States, electric car sales were up 81 percent in 2018 over sales in 2017. Price knows the science is depressing. “But,” she says, “it’s not on the science side where the good things are happening. It’s on the mitigation, on the solutions.”
Ways to help kids cope with — and help combat — climate change by Ronit Feinglass Plank, Lifestyles, Washington Post, Jan 22, 2019
SkS in the News...
[To be added.]
Coming Soon on SkS...
[To be added.]
Climate Feedback Reviews...
How credible were 2018’s most popular climate articles?
Summary
To investigate whether last year’s most “viral” climate change stories misled the people who read them, we asked scientists to evaluate a list of top articles (as we did last year). In November, we searched Buzzsumo for the climate articles[1] with the most shares and interactions—as many as 1.2 million in the top spot—selecting the top 10 that focused on verifiable statements about climate science. (One more story entered the list in December.) Two stories did not receive any reviews, but all the evaluations and comments we collected can be found below.
Compared to last year’s top 10, there is a notable lack of low credibility stories. Two stories garnered mixed reviews from scientists. In one case, this was an article detailing false claims about sea level rise made by politicians, in which some reviewers felt the article simply wasn’t clear enough in its corrections. But there were no articles from partisan outlets presenting inaccurate rejections of climate system at the top in 2018. Instead, the list was dominated by major news outlets—with the exception of the top story, which was published by the local FOX station in St. Louis.
This leads to an interesting question we unfortunately cannot answer at this stage: is this improvement in the credibility of the most-shared articles the result of recent changes to social media algorithms or just chance?
Almost half of the stories in this list cover major IPCC and US National Climate Assessment reports released last year. It also seems clear that people are interested in learning about (or commenting on) the environmental impacts of diet. The #4 story of 2017 was about the greenhouse gas emissions associated with beef production, and two of 2018’s top stories are on the same topic.
Several of the remaining stories featured dramatic headlines on events related to climate trends—things like winter warm spells at the North Pole or the 400th consecutive month warmer than the 20th century average. The most popular story (titled “NASA releases time-lapse of the disappearing Arctic polar ice cap”) was actually an article on the 2017 global surface temperature ranking that included a NASA animation of Arctic sea ice changes over the years.
SkS Week in Review...
Poster of the Week...
from Skeptical Science http://bit.ly/2TibJKO