Kevin Cowtan, Professor of Chemistry, University of York and Stephan Lewandowsky, Chair of Cognitive Psychology, University of Bristol
This article is republished from The Conversation under a Creative Commons license. Read the original article.
The record-breaking, El Niño-driven global temperatures of 2016 have given climate change deniers a new trope. Why, they ask, hasn’t it since got even hotter?
In response to a recent US government report on the impact of climate change, a spokesperson for the science-denying American Enterprise Institute think-tank claimed that “we just had […] the biggest drop in global temperatures that we have had since the 1980s, the biggest in the last 100 years.”
These claims are blatantly false: the past two years were two of the three hottest on record, and the drop in temperature from 2016 to 2018 was less than, say, the drop from 1998 (a previous record hot year) to 2000. But, more importantly, these claims use the same kind of misdirection as was used a few years ago about a supposed “pause” in warming lasting from roughly 1998 to 2013.
At the time, the alleged pause was cited by many people sceptical about the science of climate change as a reason not to act to reduce greenhouse pollution. US senator and former presidential candidate Ted Cruz frequently argued that this lack of warming undermined dire predictions by scientists about where we’re heading.
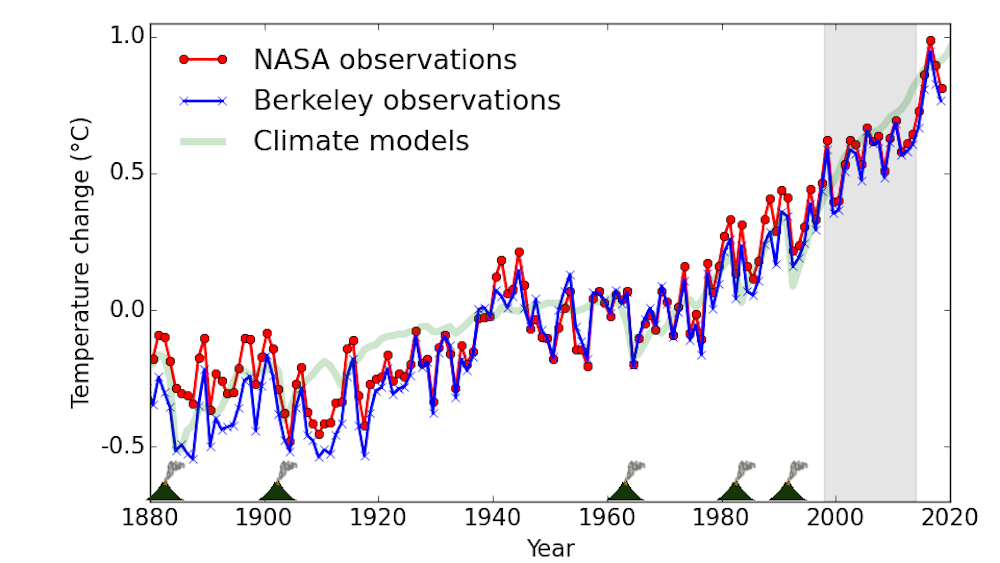
However, drawing conclusions on short-term trends is ill-advised because what matters to climate change is the decade-to-decade increase in temperatures rather than fluctuations in warming rate over a few years. Indeed, if short periods were suitable for drawing strong conclusions, climate scientists should perhaps now be talking about a “surge” in global warming since 2011, as shown in this figure:
 Global temperature observations compared to climate models. Climate-disrupting volcanoes are shown at the bottom, and the purported hiatus period is shaded. 2018 values based on year to date (YTD). NASA; Berkeley Earth; various climate models., Author provided
The “pause” or “hiatus” in warming of the early 21st century is not just a talking point of think-tanks with radical political agendas. It also features in the scientific literature, including in the most recent report of the Intergovernmental Panel on Climate Change and more than 200 peer-reviewed articles.
Research we recently published in Environmental Research Letters addresses two questions about the putative “pause”: first, is there compelling evidence in the temperature data alone of something unusual happening at the start of the 21st century? Second, did the rise in temperature lag behind projections by climate models?
In both cases the answer is “no”, but the reasons are interesting.
Reconstructing a historical temperature record from instruments designed for other purposes, such as weather forecasting, is not always easy. Several problems have affected temperature estimates for the period since 2000. The first of these was the fact that uneven geographical distribution of weather stations can influence the apparent rate of warming. Other factors include changes in the instruments used to measure ocean temperatures. Most of these factors were known at the time and reported in the scientific literature, but because the magnitudes of the effects were unknown, users of temperature data (from science journalists to IPCC authors) were in a bind when interpreting their results.
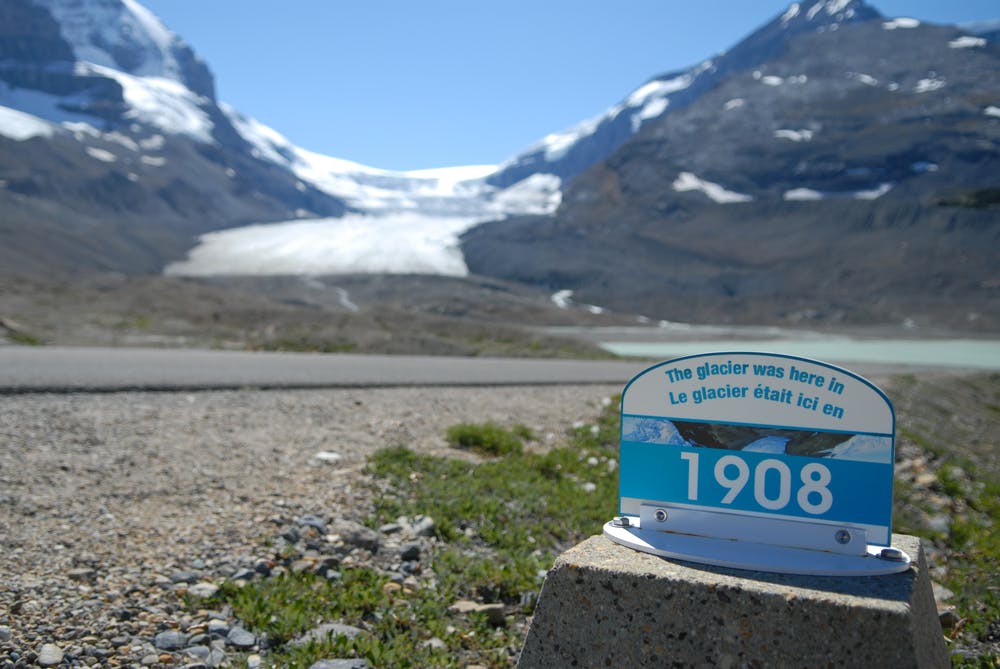
 ‘This glacier was here in 1908’: warming might fluctuate, but the long-term trend is clear. Matty Symons/Shutterstock
A more subtle problem arises when we ask whether a fluctuation in the rate of warming is a new phenomena, rather than the kind of variation we expect due to natural fluctuations of the climate system. Different statistical tests are needed to determine whether a phenomena is interesting depending on how the data are chosen. In a nutshell, if you select data based on them being unusual in the first place, then any statistical tests that seemingly confirm their unusual nature give the wrong answer. (The statistical issue here is similar to the fascinating but counterintuitive “Monty Hall problem”, which has caught out many mathematicians).
When the statistical test is applied correctly, the apparent slowdown in warming is no more significant than other fluctuations in the rate of warming over the past 40 years. In other words, there is no compelling evidence that the supposed “pause” period is different from other previous periods. Neither is the deviation between the observations and climate model projections larger than would be expected.
That’s not to say that such “wiggles” in the temperature record are uninteresting – several of our team are involved in further studies of these fluctuations, and the study of the “pause” has yielded interesting new insights into the climate system – for example, the role of changes in the Atlantic and Pacific oceans.
There are lessons here for the media, for the public, and for scientists.
For scientists, there are two lessons: first, when you get to know a dataset by using it repeatedly in your work, make sure you also still remember the limitations you read about when first downloading it. Second, remember that your statistical choices are always part of a cascade of decisions, and at least occasionally those decisions must be revisited.
For the public and the media, the lesson is to check claims about the data. In particular, when claims are made based on short periods or specific datasets, they are often designed to mislead. If someone claims the world hasn’t warmed since 1998 or 2016, ask them why those specific years – why not 1997 or 2014? Why have such short limits at all? And also check how reliable similar claims have been in the past.
The technique of misinformation is nicely described in a quote attributed to climate researcher Michael Tobis:
“If a large data set speaks convincingly against you, find a smaller and noisier one that you can huffily cite.”
Global warming didn’t stop in 1998. Don’t be fooled by claims that it stopped in 2016 either. There is only one thing that will stop global warming: cuts to greenhouse gas emissions.
from Skeptical Science http://bit.ly/2SntQi7
Kevin Cowtan, Professor of Chemistry, University of York and Stephan Lewandowsky, Chair of Cognitive Psychology, University of Bristol
This article is republished from The Conversation under a Creative Commons license. Read the original article.
The record-breaking, El Niño-driven global temperatures of 2016 have given climate change deniers a new trope. Why, they ask, hasn’t it since got even hotter?
In response to a recent US government report on the impact of climate change, a spokesperson for the science-denying American Enterprise Institute think-tank claimed that “we just had […] the biggest drop in global temperatures that we have had since the 1980s, the biggest in the last 100 years.”
These claims are blatantly false: the past two years were two of the three hottest on record, and the drop in temperature from 2016 to 2018 was less than, say, the drop from 1998 (a previous record hot year) to 2000. But, more importantly, these claims use the same kind of misdirection as was used a few years ago about a supposed “pause” in warming lasting from roughly 1998 to 2013.
At the time, the alleged pause was cited by many people sceptical about the science of climate change as a reason not to act to reduce greenhouse pollution. US senator and former presidential candidate Ted Cruz frequently argued that this lack of warming undermined dire predictions by scientists about where we’re heading.
However, drawing conclusions on short-term trends is ill-advised because what matters to climate change is the decade-to-decade increase in temperatures rather than fluctuations in warming rate over a few years. Indeed, if short periods were suitable for drawing strong conclusions, climate scientists should perhaps now be talking about a “surge” in global warming since 2011, as shown in this figure:
Global temperature observations compared to climate models. Climate-disrupting volcanoes are shown at the bottom, and the purported hiatus period is shaded. 2018 values based on year to date (YTD). NASA; Berkeley Earth; various climate models., Author provided
The “pause” or “hiatus” in warming of the early 21st century is not just a talking point of think-tanks with radical political agendas. It also features in the scientific literature, including in the most recent report of the Intergovernmental Panel on Climate Change and more than 200 peer-reviewed articles.
Research we recently published in Environmental Research Letters addresses two questions about the putative “pause”: first, is there compelling evidence in the temperature data alone of something unusual happening at the start of the 21st century? Second, did the rise in temperature lag behind projections by climate models?
In both cases the answer is “no”, but the reasons are interesting.
Reconstructing a historical temperature record from instruments designed for other purposes, such as weather forecasting, is not always easy. Several problems have affected temperature estimates for the period since 2000. The first of these was the fact that uneven geographical distribution of weather stations can influence the apparent rate of warming. Other factors include changes in the instruments used to measure ocean temperatures. Most of these factors were known at the time and reported in the scientific literature, but because the magnitudes of the effects were unknown, users of temperature data (from science journalists to IPCC authors) were in a bind when interpreting their results.
‘This glacier was here in 1908’: warming might fluctuate, but the long-term trend is clear. Matty Symons/Shutterstock
A more subtle problem arises when we ask whether a fluctuation in the rate of warming is a new phenomena, rather than the kind of variation we expect due to natural fluctuations of the climate system. Different statistical tests are needed to determine whether a phenomena is interesting depending on how the data are chosen. In a nutshell, if you select data based on them being unusual in the first place, then any statistical tests that seemingly confirm their unusual nature give the wrong answer. (The statistical issue here is similar to the fascinating but counterintuitive “Monty Hall problem”, which has caught out many mathematicians).
When the statistical test is applied correctly, the apparent slowdown in warming is no more significant than other fluctuations in the rate of warming over the past 40 years. In other words, there is no compelling evidence that the supposed “pause” period is different from other previous periods. Neither is the deviation between the observations and climate model projections larger than would be expected.
That’s not to say that such “wiggles” in the temperature record are uninteresting – several of our team are involved in further studies of these fluctuations, and the study of the “pause” has yielded interesting new insights into the climate system – for example, the role of changes in the Atlantic and Pacific oceans.
There are lessons here for the media, for the public, and for scientists.
For scientists, there are two lessons: first, when you get to know a dataset by using it repeatedly in your work, make sure you also still remember the limitations you read about when first downloading it. Second, remember that your statistical choices are always part of a cascade of decisions, and at least occasionally those decisions must be revisited.
For the public and the media, the lesson is to check claims about the data. In particular, when claims are made based on short periods or specific datasets, they are often designed to mislead. If someone claims the world hasn’t warmed since 1998 or 2016, ask them why those specific years – why not 1997 or 2014? Why have such short limits at all? And also check how reliable similar claims have been in the past.
The technique of misinformation is nicely described in a quote attributed to climate researcher Michael Tobis:
“If a large data set speaks convincingly against you, find a smaller and noisier one that you can huffily cite.”
Global warming didn’t stop in 1998. Don’t be fooled by claims that it stopped in 2016 either. There is only one thing that will stop global warming: cuts to greenhouse gas emissions.
from Skeptical Science http://bit.ly/2SntQi7