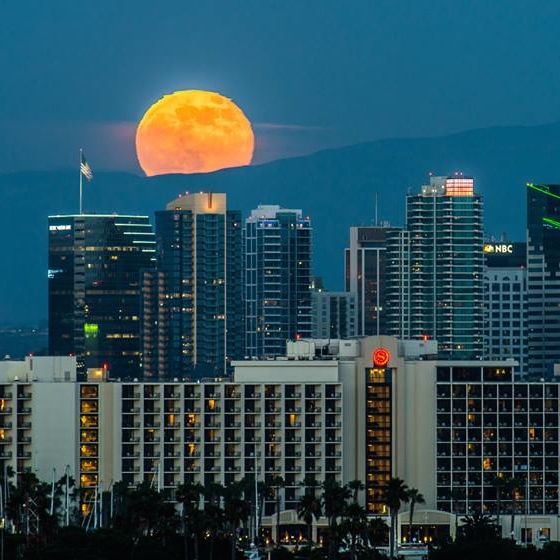
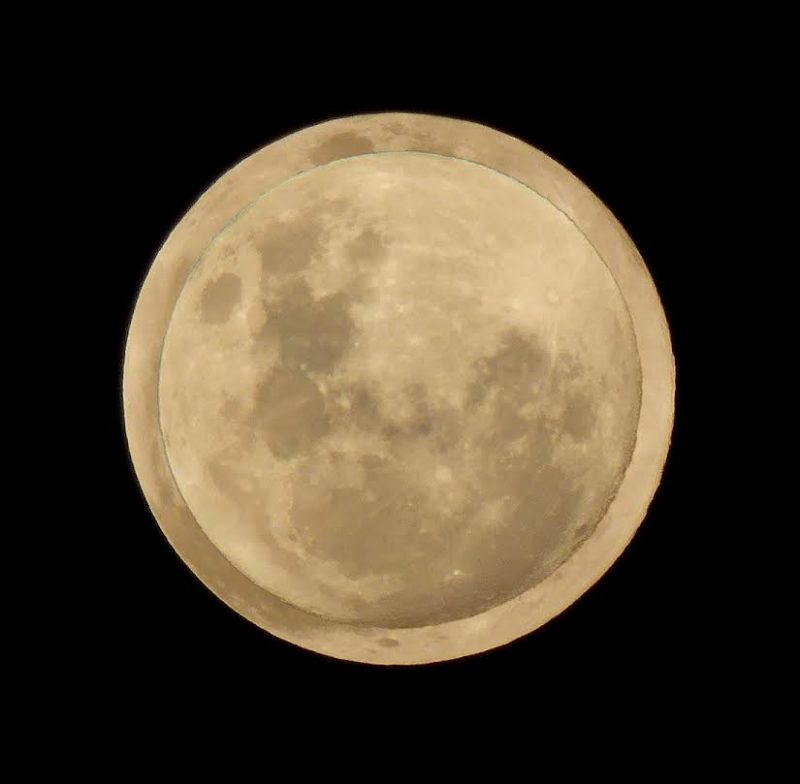
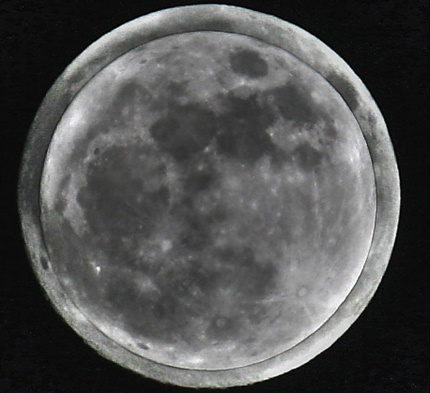
Apparent size of a full supermoon, or close moon, contrasted with a full micro-moon, or far moon. Image by Peter Lowenstein.
The last of 2018’s 13 full moons will fall on December 22. This full moon will rank as the 3rd-closest one of 2018, but it’s less than clear whether it should be dubbed a supermoon, mainly because commentators disagree on what constitutes a supermoon.
EarthSky lunar calendars are cool! They make great gifts. Order now. Going fast!
Who are the commentators, and what do they say? The International Astronomical Union (IAU) is the group generally recognized for naming and defining things in astronomy. But the IAU has been, so far, silent on the subject of supermoons, which, professional astronomers tend to call perigean full moons.
Meanwhile, Fred Espenak, the go-to astronomer on all things related to lunar and solar eclipses (Mr. Eclipse!), lists the full moons of January 2 and 31, plus December 22, 2018, as full moon supermoons in his post, full moon at perigee.
We might also consider the astrologer Richard Nolle. Whatever your thoughts or feelings are on astrology, Nolle is, after all, the person who coined the term supermoon. Of the 13 full moons that take place in 2018, he lists only the two January full moons as supermoons. The supermoon definition, as originally defined by Nolle, comes with ambiguity. That’s why there are different answers to the question of the number of supermoons in 2018.
Click here to learn more about Richard Nolle
Click here to learn more about Fred Espenak
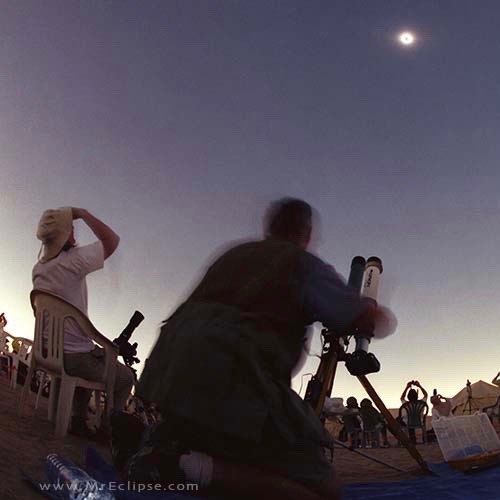
Astrophysicist Fred Espenak, aka Mr. Eclipse – a 30-year NASA veteran and world-renowned expert on eclipses – says the January 12, 2017, full moon is a supermoon in his post Moon in 2017.
We refer you to two different supermoon tables for the 21st century (2001 to 2100). Here is Richard Nolle’s table, and here is Fred Espenak’s table.
Richard Nolle lists only two full moon supermoons for 2018:
2018 January 2
2018 January 31
Meanwhile, Fred Espenak lists three full moon supermoons in 2018:
2018 January 2
2018 January 31
2018 December 22
Why are their lists different? It all goes back to the definition of the word supermoon.
Here’s one thing we all can agree on. Supermoons are based on lunar perigee and apogee. Each month, the moon comes closest to Earth at perigee and swings farthest away at apogee.
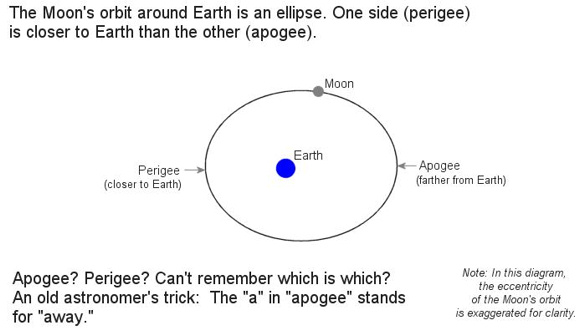
Image via NASA.
In his original definition, Richard Nolle defined a supermoon as:
… a new or full moon which occurs with the moon at or near (within 90% of) its closest approach to Earth in a given orbit.
If a new or full moon aligns with apogee, then it’s at 0% of its closest approach to Earth. On the other hand, if a new or full moon aligns with perigee, then it’s at 100% of its closest approach to Earth. That’s something we can all agree on.
But the phrase 90% of perigee is ambiguous. Read on.

A 2013 supermoon, as captured by EarthSky Facebook friend Anthony Lynch in Dublin, Ireland.
Nolle’s 90% is based on 2018’s closest perigee and farthest apogee. Looking at Richard Nolle’s list for all the supermoons in the 21st century, it appears that Richard Nolle bases his 90% figure on the year’s closest perigee and farthest apogee. Take the year 2018, for instance, whereby any new or full moon coming closer than 362,146.6 km qualifies as a supermoon.
This year, in 2018, the moon comes closest to Earth on January 1 (356,565 kilometers) and swings farthest away one fortnight (two weeks) later, on January 15 (406,464 kilometers). That’s a difference of 49,899 km (406,464 – 356,565 = 49,899 km). Ninety percent of 49,899 km equals 44,909.1 kilometers (0.9 x 49,899 = 44,909.1). Presumably, any new or full moon coming closer than 361,554.9 kilometers (406,464 – 44,909.1 = 361,554.9) would be “at or near (within 90% of) its closest approach to Earth.”
Farthest apogee (2018): 406,464 km
Closest perigee (2018): 356,565 km
Difference: 49,899 km
90% x 49,899 = 44,909.1 km
406,464 – 44,909.1 = 361,554.9 km = 90% of moon’s closest distance to Earth
Thus, figuring out “90% of the moon’s closest approach to Earth” by the year’s closest perigee and farthest apogee, any new or full moon swinging closer than 361,554.9 km to Earth in 2018 counts as a supermoon.
Since the full moon on December 22, 2018, only comes within 363,368 km of Earth, it doesn’t count as a supermoon on Richard Nolle’s list.
Espenak’s 90% based on perigee and apogee of each month’s orbit. Ironically, Fred Espenak’s full supermoon list might more strictly adhere to Richard Nolle’s definition (at least as it is written) than Richard Nolle himself does.
Once again, Richard Nolle describes a supermoon as:
… a new or full moon which occurs with the Moon at or near (within 90% of) its closest approach to Earth in a given orbit.
If given orbit can be taken to mean current monthly orbit, then the December 2018 full moon comes to within 94.8% of its closest approach to Earth relative to the most recent perigee and the upcoming apogee.
December 12, 2018 apogee: 405,177 km
December 24, 2018 perigee: 361,062 km
Difference: 44,115 km
December 12, 2018 apogee: 405,177 km
December 22, 2018 full moon: 363,368 km
Difference: 41,809 km
41,809/44,115 = 0.9477 (94.77%) = distance of the December 2018 full moon relative to the most recent apogee and upcoming perigee
Depending on what meaning we give to the words in a given orbit, we could say the December 12 apogee = 0% of the moon’s closest approach to Earth for this orbit, and the December 24 perigee = 100% of the moon’s closest approach to Earth.
That being the case, then the December full moon comes to within 94.8% of its closest approach to Earth for the month.
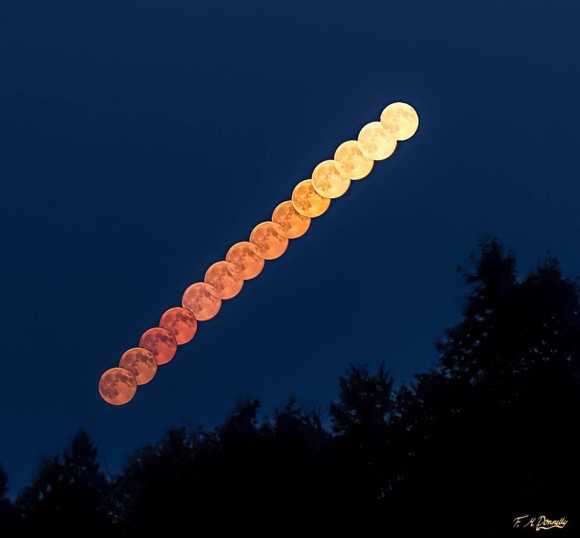
Super cool super-moonrise composite from Fiona M. Donnelly in Ontario. This photo is from the August 2014 supermoon.
December full moon’s distance relative to 2018’s closest perigee/farthest apogee. However, if we compute the percentage distance of the December full moon relative to the year’s farthest apogee and closest perigee, then the December full moon only comes to within 86.2% of its closest approach to Earth:
Farthest apogee (2018): 406,464 km
Closest perigee (2018): 356,565 km
Difference: 49,899 km
Farthest apogee (2018): 406,464 km
December full moon (2018): 363,368 km
Difference: 43,096 km
43,096/49,899 = 0.864 (86.4%) = distance of the December full moon relative to the year’s farthest apogee and closest perigee
Another contrast of a full supermoon (full moon at perigee) with a micro-moon (full moon at apogee). Image via Stefano Sciarpetti.
Is the December full moon a supermoon? Depends on which perigee/apogee distances you choose. The moon’s perigee and apogee distances vary throughout the year, so it appears that the limiting distance for the supermoon depends on which perigee and apogee distances are being used to compute 90% of the moon’s closest approach to Earth.
If we choose the year’s closest perigee and farthest apogee, as Nolle did, we narrow the definition of supermoon.
If we choose the perigee and apogee for a given monthly orbit, as Espenak did, then we broaden the definition of supermoon.
Given the narrower definition, the full moon on December 22, 2018, is not a supermoon, but given the broader one, it is.
Take your choice!
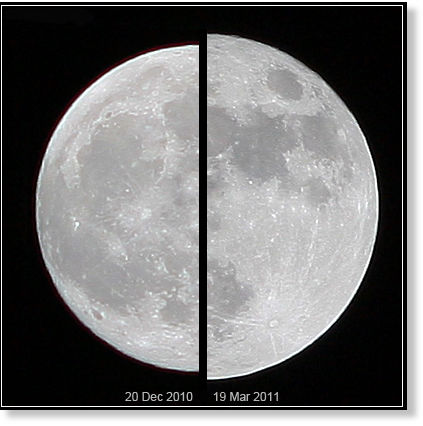
The moon’s apparent size in our sky depends on its distance from Earth. The supermoon of March 19, 2011 (right), compared to an average moon of December 20, 2010 (left). Image by Marco Langbroek of the Netherlands via Wikimedia Commons.
Bottom line: At least two commentators – Richard Nolle and Fred Espenak – disagree on whether the December 22, 2018, full moon should be called a supermoon. Is it? If you define a supermoon based on the year’s closest perigee and farthest apogee, then the December 2018 full moon is not a supermoon. If you define a supermoon based on the perigee and apogee for a given monthly orbit, then it is a supermoon. Take your choice!
from EarthSky https://ift.tt/2BKzdSi
Apparent size of a full supermoon, or close moon, contrasted with a full micro-moon, or far moon. Image by Peter Lowenstein.
The last of 2018’s 13 full moons will fall on December 22. This full moon will rank as the 3rd-closest one of 2018, but it’s less than clear whether it should be dubbed a supermoon, mainly because commentators disagree on what constitutes a supermoon.
EarthSky lunar calendars are cool! They make great gifts. Order now. Going fast!
Who are the commentators, and what do they say? The International Astronomical Union (IAU) is the group generally recognized for naming and defining things in astronomy. But the IAU has been, so far, silent on the subject of supermoons, which, professional astronomers tend to call perigean full moons.
Meanwhile, Fred Espenak, the go-to astronomer on all things related to lunar and solar eclipses (Mr. Eclipse!), lists the full moons of January 2 and 31, plus December 22, 2018, as full moon supermoons in his post, full moon at perigee.
We might also consider the astrologer Richard Nolle. Whatever your thoughts or feelings are on astrology, Nolle is, after all, the person who coined the term supermoon. Of the 13 full moons that take place in 2018, he lists only the two January full moons as supermoons. The supermoon definition, as originally defined by Nolle, comes with ambiguity. That’s why there are different answers to the question of the number of supermoons in 2018.
Click here to learn more about Richard Nolle
Click here to learn more about Fred Espenak
Astrophysicist Fred Espenak, aka Mr. Eclipse – a 30-year NASA veteran and world-renowned expert on eclipses – says the January 12, 2017, full moon is a supermoon in his post Moon in 2017.
We refer you to two different supermoon tables for the 21st century (2001 to 2100). Here is Richard Nolle’s table, and here is Fred Espenak’s table.
Richard Nolle lists only two full moon supermoons for 2018:
2018 January 2
2018 January 31
Meanwhile, Fred Espenak lists three full moon supermoons in 2018:
2018 January 2
2018 January 31
2018 December 22
Why are their lists different? It all goes back to the definition of the word supermoon.
Here’s one thing we all can agree on. Supermoons are based on lunar perigee and apogee. Each month, the moon comes closest to Earth at perigee and swings farthest away at apogee.
Image via NASA.
In his original definition, Richard Nolle defined a supermoon as:
… a new or full moon which occurs with the moon at or near (within 90% of) its closest approach to Earth in a given orbit.
If a new or full moon aligns with apogee, then it’s at 0% of its closest approach to Earth. On the other hand, if a new or full moon aligns with perigee, then it’s at 100% of its closest approach to Earth. That’s something we can all agree on.
But the phrase 90% of perigee is ambiguous. Read on.
A 2013 supermoon, as captured by EarthSky Facebook friend Anthony Lynch in Dublin, Ireland.
Nolle’s 90% is based on 2018’s closest perigee and farthest apogee. Looking at Richard Nolle’s list for all the supermoons in the 21st century, it appears that Richard Nolle bases his 90% figure on the year’s closest perigee and farthest apogee. Take the year 2018, for instance, whereby any new or full moon coming closer than 362,146.6 km qualifies as a supermoon.
This year, in 2018, the moon comes closest to Earth on January 1 (356,565 kilometers) and swings farthest away one fortnight (two weeks) later, on January 15 (406,464 kilometers). That’s a difference of 49,899 km (406,464 – 356,565 = 49,899 km). Ninety percent of 49,899 km equals 44,909.1 kilometers (0.9 x 49,899 = 44,909.1). Presumably, any new or full moon coming closer than 361,554.9 kilometers (406,464 – 44,909.1 = 361,554.9) would be “at or near (within 90% of) its closest approach to Earth.”
Farthest apogee (2018): 406,464 km
Closest perigee (2018): 356,565 km
Difference: 49,899 km
90% x 49,899 = 44,909.1 km
406,464 – 44,909.1 = 361,554.9 km = 90% of moon’s closest distance to Earth
Thus, figuring out “90% of the moon’s closest approach to Earth” by the year’s closest perigee and farthest apogee, any new or full moon swinging closer than 361,554.9 km to Earth in 2018 counts as a supermoon.
Since the full moon on December 22, 2018, only comes within 363,368 km of Earth, it doesn’t count as a supermoon on Richard Nolle’s list.
Espenak’s 90% based on perigee and apogee of each month’s orbit. Ironically, Fred Espenak’s full supermoon list might more strictly adhere to Richard Nolle’s definition (at least as it is written) than Richard Nolle himself does.
Once again, Richard Nolle describes a supermoon as:
… a new or full moon which occurs with the Moon at or near (within 90% of) its closest approach to Earth in a given orbit.
If given orbit can be taken to mean current monthly orbit, then the December 2018 full moon comes to within 94.8% of its closest approach to Earth relative to the most recent perigee and the upcoming apogee.
December 12, 2018 apogee: 405,177 km
December 24, 2018 perigee: 361,062 km
Difference: 44,115 km
December 12, 2018 apogee: 405,177 km
December 22, 2018 full moon: 363,368 km
Difference: 41,809 km
41,809/44,115 = 0.9477 (94.77%) = distance of the December 2018 full moon relative to the most recent apogee and upcoming perigee
Depending on what meaning we give to the words in a given orbit, we could say the December 12 apogee = 0% of the moon’s closest approach to Earth for this orbit, and the December 24 perigee = 100% of the moon’s closest approach to Earth.
That being the case, then the December full moon comes to within 94.8% of its closest approach to Earth for the month.
Super cool super-moonrise composite from Fiona M. Donnelly in Ontario. This photo is from the August 2014 supermoon.
December full moon’s distance relative to 2018’s closest perigee/farthest apogee. However, if we compute the percentage distance of the December full moon relative to the year’s farthest apogee and closest perigee, then the December full moon only comes to within 86.2% of its closest approach to Earth:
Farthest apogee (2018): 406,464 km
Closest perigee (2018): 356,565 km
Difference: 49,899 km
Farthest apogee (2018): 406,464 km
December full moon (2018): 363,368 km
Difference: 43,096 km
43,096/49,899 = 0.864 (86.4%) = distance of the December full moon relative to the year’s farthest apogee and closest perigee
Another contrast of a full supermoon (full moon at perigee) with a micro-moon (full moon at apogee). Image via Stefano Sciarpetti.
Is the December full moon a supermoon? Depends on which perigee/apogee distances you choose. The moon’s perigee and apogee distances vary throughout the year, so it appears that the limiting distance for the supermoon depends on which perigee and apogee distances are being used to compute 90% of the moon’s closest approach to Earth.
If we choose the year’s closest perigee and farthest apogee, as Nolle did, we narrow the definition of supermoon.
If we choose the perigee and apogee for a given monthly orbit, as Espenak did, then we broaden the definition of supermoon.
Given the narrower definition, the full moon on December 22, 2018, is not a supermoon, but given the broader one, it is.
Take your choice!
The moon’s apparent size in our sky depends on its distance from Earth. The supermoon of March 19, 2011 (right), compared to an average moon of December 20, 2010 (left). Image by Marco Langbroek of the Netherlands via Wikimedia Commons.
Bottom line: At least two commentators – Richard Nolle and Fred Espenak – disagree on whether the December 22, 2018, full moon should be called a supermoon. Is it? If you define a supermoon based on the year’s closest perigee and farthest apogee, then the December 2018 full moon is not a supermoon. If you define a supermoon based on the perigee and apogee for a given monthly orbit, then it is a supermoon. Take your choice!
from EarthSky https://ift.tt/2BKzdSi