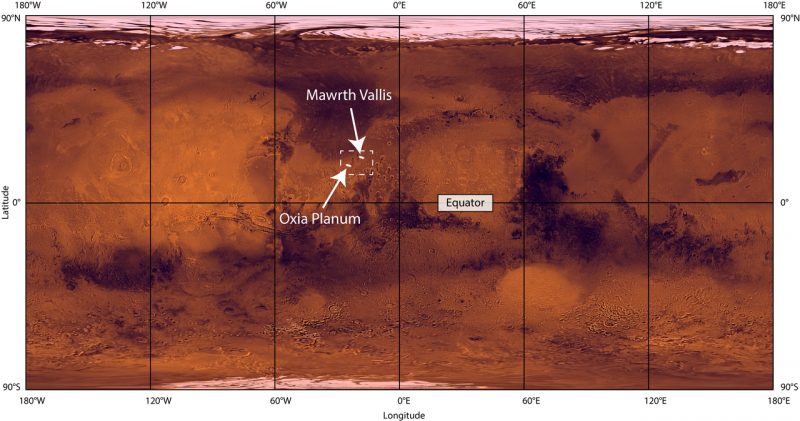
Map of Mars showing the 2 finalist landing sites on Mars, Mawrth Vallis and Oxia Planum. Now Oxia Planum has been given the nod for ESA’s ExoMars mission. Image via NASA/JPL/USGS.
Mars will continue to be a busy place in the near future, with NASA’s InSight spacecraft landing just a few days ago on November 26, and the Mars 2020 rover landing in 2021. But NASA is not the only one going back to the red planet – the European Space Agency (ESA) is getting ready for its own rover mission – ExoMars – which will also land in 2021. The landing site for ExoMars was announced this month (November 2018), and the winner is Oxia Planum.
The ExoMars rover mission is designed specifically to look for evidence of life on Mars, most likely underground if it exists. According to Graham Turnock, Chief Executive at the UK Space Agency:
After the Earth, Mars is the most habitable planet in the solar system, so it’s a perfect destination to explore the possibility of life on other planets, as well as the history of our own.
The UK Space Agency is the second-largest European contributor to the ExoMars mission, with €287 million invested in the overall mission and £14 million in the instruments. UKSA also negotiated key mission contracts with ESA.
EarthSky lunar calendars are cool! They make great gifts. Order now. Going fast!
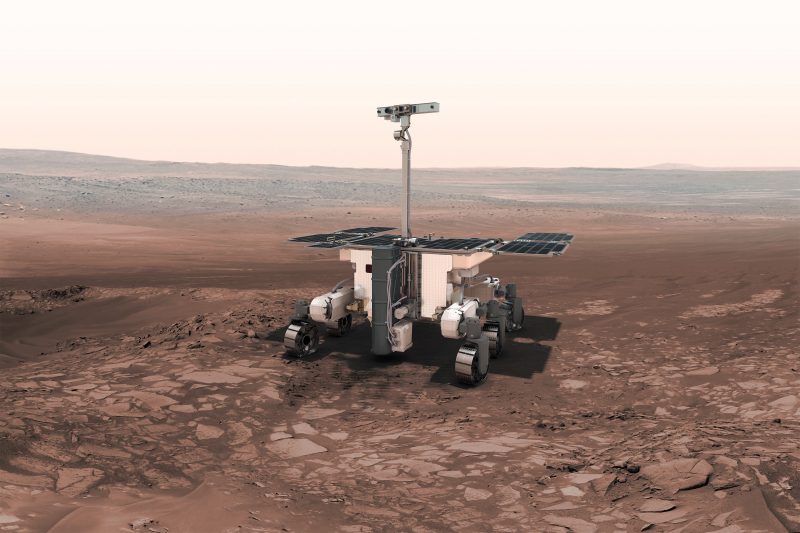
Artist’s concept of the ExoMars rover, which will land in Oxia Planum in 2021. Image via ESA.
Oxia Planum was finally chosen over Mawrth Vallis, the other of the two finalist candidate landing sites, both of which used to be water-rich in the distant past. John Bridges, from the Space Research Centre, University of Leicester, and a member of the Landing Site Selection Working Group, explained how Oxia Planum was chosen over other candidate landing sites:
After over 4 years of careful study of HiRISE and more recently CaSSIS images Oxia Planum was chosen because scientists were convinced that its fine grained sediments, deposited during the ancient Noachian epoch were ideally suited for the Exobiology rover.
With an enormous catchment area the sediments will have captured organics from a wide variety of environments over a long period of time, including areas where life may have existed. The fine sediments should also be ideal for the ExoMars drill – it aims to get to 2 metres depth.
Remote identification with the Mars Express and Mars Reconnaissance Orbiter infrared spectrometers shows the presence of clays and other minerals giving clues to its aqueous history.
A large group of scientists have been working on proposing, characterising and down selecting the sites, all of which had fascinating aspects, but Oxia Planum is the clear winner on both science and engineering constraints.
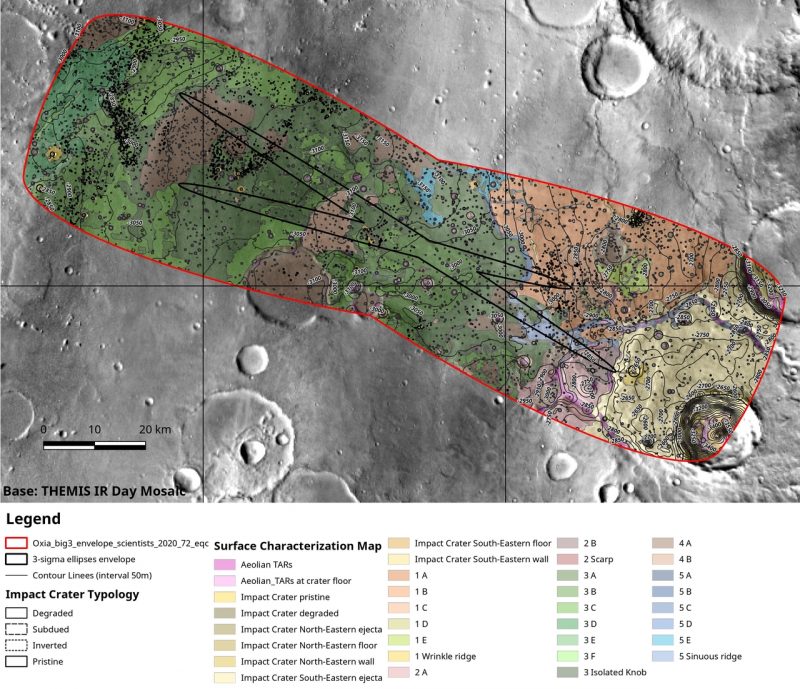
A texture map of Oxia Planum, created from data taken by NASA’s Mars Odyssey orbiter. Image via IRSPS/TAS/NASA/JPL-Caltech/Arizona State University.
As Sue Horne, Head of Space Exploration at the UK Space Agency also noted:
I have been working on ExoMars for over ten years and am amazed at the ingenuity and dedication of UK engineers and scientists in building the rover and instruments that will work in the extreme environment of Mars.
Our end goal is in sight and it is getting very exciting.
ExoMars will be the second Mars mission, after only Mars 2020 and the Viking landers in the late 1970s/early 1980s to search directly for evidence of life instead of only focusing past habitability. According to ExoMars 2020 project scientist Jorge Vago:
With ExoMars we are on a quest to find biosignatures. While both sites offer valuable scientific opportunities to explore ancient water-rich environments that could have been colonised by microorganisms, Oxia Planum received the majority of votes.
An impressive amount of work has gone into characterising the proposed sites, demonstrating that they meet the scientific requirements for the goals of the ExoMars mission. Mawrth Vallis is a scientifically unique site, but Oxia Planum offers an additional safety margin for entry, descent and landing, and for traversing the terrain to reach the scientifically interesting sites that have been identified from orbit.
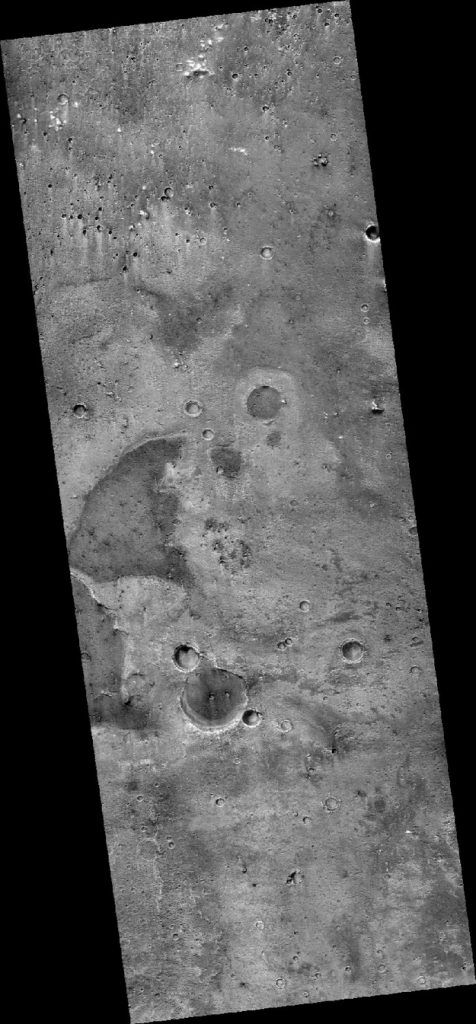
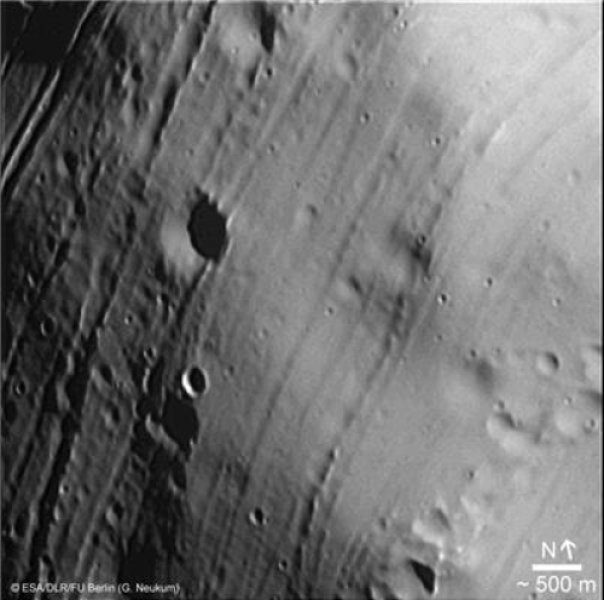
A portion of Oxia Planum, as seen by NASA’s Mars Reconnaissance Orbiter. Image via NASA/JPL-Caltech/MSSS.
Oxia Planum is just north of the martian equator, in a region with many channels – carved by ancient rivers – cutting through from the southern highlands to the northern lowlands. Such previously water-rich areas are prime targets for rovers and landers when searching for evidence of not only past habitability, but even life itself. Oxia Planum is at a boundary where many channels emptied into the lower plains, and those plains exhibit layers of clay-rich minerals that were formed in water-rich conditions about four billion years ago. The channels cover a large area, about 131,000 square miles (212,000 square km).
The rover will drill down into the martian surface – up to 6.5 feet (two meters) deep – to look for organic material that could be evidence for life. It is designed to take a minimum of 17 samples to be analyzed by the Analytical Laboratory Drawer.
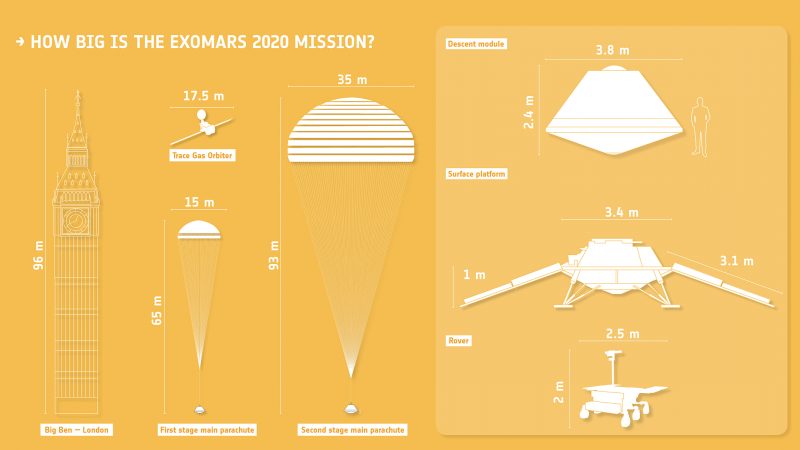
Comparison of different components of the ExoMars mission to the Big Ben tower in London. Image via ESA.
Landing on Mars is never easy, but Francois Spoto, ExoMars Programme team leader, is confident:
Our ExoMars mission combines extreme performance with the novel design features of the rover, and we are looking forward to operating the first European mission on the surface of Mars. Landing on Mars has a long chain of risks, but thanks to the combined skills and expertise of European and Russian industries working with reliable technologies, we are focused on a safe landing.
The other part of the ExoMars mission, the Trace Gas Orbiter, has already been orbiting Mars for several months now, and is analyzing the atmosphere, including looking for trace gases such as methane – detected previously by other telescopes, orbiters and the Curiosity rover – that could indicate possible current life or geologic activity.
Bottom line: The next phase of the ExoMars mission – the 2021 rover – will be an exciting one, as it explores Oxia Planum searching for signs of life beneath the once wet but now dry and sandy surface.
from EarthSky https://ift.tt/2U0ACLF
Map of Mars showing the 2 finalist landing sites on Mars, Mawrth Vallis and Oxia Planum. Now Oxia Planum has been given the nod for ESA’s ExoMars mission. Image via NASA/JPL/USGS.
Mars will continue to be a busy place in the near future, with NASA’s InSight spacecraft landing just a few days ago on November 26, and the Mars 2020 rover landing in 2021. But NASA is not the only one going back to the red planet – the European Space Agency (ESA) is getting ready for its own rover mission – ExoMars – which will also land in 2021. The landing site for ExoMars was announced this month (November 2018), and the winner is Oxia Planum.
The ExoMars rover mission is designed specifically to look for evidence of life on Mars, most likely underground if it exists. According to Graham Turnock, Chief Executive at the UK Space Agency:
After the Earth, Mars is the most habitable planet in the solar system, so it’s a perfect destination to explore the possibility of life on other planets, as well as the history of our own.
The UK Space Agency is the second-largest European contributor to the ExoMars mission, with €287 million invested in the overall mission and £14 million in the instruments. UKSA also negotiated key mission contracts with ESA.
EarthSky lunar calendars are cool! They make great gifts. Order now. Going fast!
Artist’s concept of the ExoMars rover, which will land in Oxia Planum in 2021. Image via ESA.
Oxia Planum was finally chosen over Mawrth Vallis, the other of the two finalist candidate landing sites, both of which used to be water-rich in the distant past. John Bridges, from the Space Research Centre, University of Leicester, and a member of the Landing Site Selection Working Group, explained how Oxia Planum was chosen over other candidate landing sites:
After over 4 years of careful study of HiRISE and more recently CaSSIS images Oxia Planum was chosen because scientists were convinced that its fine grained sediments, deposited during the ancient Noachian epoch were ideally suited for the Exobiology rover.
With an enormous catchment area the sediments will have captured organics from a wide variety of environments over a long period of time, including areas where life may have existed. The fine sediments should also be ideal for the ExoMars drill – it aims to get to 2 metres depth.
Remote identification with the Mars Express and Mars Reconnaissance Orbiter infrared spectrometers shows the presence of clays and other minerals giving clues to its aqueous history.
A large group of scientists have been working on proposing, characterising and down selecting the sites, all of which had fascinating aspects, but Oxia Planum is the clear winner on both science and engineering constraints.
A texture map of Oxia Planum, created from data taken by NASA’s Mars Odyssey orbiter. Image via IRSPS/TAS/NASA/JPL-Caltech/Arizona State University.
As Sue Horne, Head of Space Exploration at the UK Space Agency also noted:
I have been working on ExoMars for over ten years and am amazed at the ingenuity and dedication of UK engineers and scientists in building the rover and instruments that will work in the extreme environment of Mars.
Our end goal is in sight and it is getting very exciting.
ExoMars will be the second Mars mission, after only Mars 2020 and the Viking landers in the late 1970s/early 1980s to search directly for evidence of life instead of only focusing past habitability. According to ExoMars 2020 project scientist Jorge Vago:
With ExoMars we are on a quest to find biosignatures. While both sites offer valuable scientific opportunities to explore ancient water-rich environments that could have been colonised by microorganisms, Oxia Planum received the majority of votes.
An impressive amount of work has gone into characterising the proposed sites, demonstrating that they meet the scientific requirements for the goals of the ExoMars mission. Mawrth Vallis is a scientifically unique site, but Oxia Planum offers an additional safety margin for entry, descent and landing, and for traversing the terrain to reach the scientifically interesting sites that have been identified from orbit.
A portion of Oxia Planum, as seen by NASA’s Mars Reconnaissance Orbiter. Image via NASA/JPL-Caltech/MSSS.
Oxia Planum is just north of the martian equator, in a region with many channels – carved by ancient rivers – cutting through from the southern highlands to the northern lowlands. Such previously water-rich areas are prime targets for rovers and landers when searching for evidence of not only past habitability, but even life itself. Oxia Planum is at a boundary where many channels emptied into the lower plains, and those plains exhibit layers of clay-rich minerals that were formed in water-rich conditions about four billion years ago. The channels cover a large area, about 131,000 square miles (212,000 square km).
The rover will drill down into the martian surface – up to 6.5 feet (two meters) deep – to look for organic material that could be evidence for life. It is designed to take a minimum of 17 samples to be analyzed by the Analytical Laboratory Drawer.
Comparison of different components of the ExoMars mission to the Big Ben tower in London. Image via ESA.
Landing on Mars is never easy, but Francois Spoto, ExoMars Programme team leader, is confident:
Our ExoMars mission combines extreme performance with the novel design features of the rover, and we are looking forward to operating the first European mission on the surface of Mars. Landing on Mars has a long chain of risks, but thanks to the combined skills and expertise of European and Russian industries working with reliable technologies, we are focused on a safe landing.
The other part of the ExoMars mission, the Trace Gas Orbiter, has already been orbiting Mars for several months now, and is analyzing the atmosphere, including looking for trace gases such as methane – detected previously by other telescopes, orbiters and the Curiosity rover – that could indicate possible current life or geologic activity.
Bottom line: The next phase of the ExoMars mission – the 2021 rover – will be an exciting one, as it explores Oxia Planum searching for signs of life beneath the once wet but now dry and sandy surface.
from EarthSky https://ift.tt/2U0ACLF