Climate impacts

This is a re-post from ...and Then There's Physics

Carbon brief has a very nice interactive report that show the impacts of climate change at 1.5C, 2C and beyond. It presents the various projected climatic, ecological, and economic changes on both global and regional scales. It is an impressive dive into the relevant literature.

On Twitter, Doug McNeall said something I’ve often wondered myself. Essentially, why don’t projections of large climatic and ecological changes lead to large projected economic damages? Of course, I don’t know the economic literature particularly well, so one potential answer is that some economic analyses do project large changes. However, it also seems that some certainly do not.

One possibility is that the global economic impact will indeed be relatively small, even if the climatic and ecological changes are large. Of course, even if this were the case, this wouldn’t necessarily imply that a cost-benefit analysis wouldn’t still suggest that it would be beneficial to address climate change.

Additionally, even if the global economic impact is relatively small, that doesn’t mean that there can’t be large impacts in some regions, or that some of the impacts (such as the loss of ecosystems, for example) aren’t things that are difficult to quantify economically, at least in a way that we would all broadly agree with.

However, I do think there are reasons to be cautious about some of these economic analyses. Let me provide a caveat up front. I’m not an expert at this, so am happy to be corrected if I get something wrong, and am partly writing this in the hope that I might learn something more.

For starters, these analyses are typically linear. This essentially means that they can say nothing about the possibility of some kind of large shock. Some of these analyses actually suggest the possibility of quite small global economic impacts even for extremely large changes in climate (see links below), which would seem to suggest that there is some point at which these calculations break down.

Also, as I understand it, most of these analyses do not consider how climate change might impact economic growth itself (see this Carbon Brief Explainer about IAMs). If the global economy grows at 3% per year, then it will be about 10 times bigger in 2100 than it is today. A large economic impact in 2100, might then seem small by comparison to the global economy at that time. Equivalently, if you discount these future economic costs to today, they can also seem quite small. Is it reasonable to assume that global economic growth will be largely unaffected by climate change?

My own view, which I’m happy to be convinced is wrong, is that these kind of analyses are fine if you want to understand things like what would happen if we did something (like impose a carbon tax). They’re probably also fine if you’re interested in how the economy will response to relatively small climate and ecological perturbations, or will respond over the next few decades. Where I think we should be more cautious is when the climate/ecological perturbations are large, or when considering very long, multi-decade timescales.

You might regard it as ironic that I’ve defended climate projections over quite long timescales, while suggesting that we should be cautious about economic projections over the same timescales. For starters, there are aspects of these climate projections about which we have more confidence than others (global versus regional responses, for example), and the uncertainty does grow as the timescale increases. So, it’s not as if we completely trust climate projections either. However, as this paper by Jonathan Koomey points out, physical systems have structural constancy, while economic and societal systems do not. We can be confident that the response of a physical system to a perturbation will be the same in the future as it is now. We can’t be similarly confident when it comes to economic/societal systems.

Hence, I think it is reasonable to be more confident in the long-term climate projections than in the long-term economic projections. However, I’m not suggesting that these economic projections have no value. As George Box said, all models are wrong but some are useful. I think it’s important to understand when we can be confident in what a model is suggesting, and when not. If some think we should be confident in economic projections over long timescales and even when the projected climate/ecological changes are very large, I’d be interested to hear why.

Links:
The impacts of climate change at 1.5C, 2C and beyond (Interactive Climate Brief post about climate impacts).
Q&A: How ‘integrated assessment models’ are used to study climate change (Carbon Brief post about Integrated Assessment Models – IAMs).
Economics and Values (Post I wrote about economics and values).
We don’t even agree about the basics (Post I wrote about why we shouldn’t judge climate models in the same way we might judge economic models).
The Treatment of Risk and Uncertainty in the US Social Cost of Carbon for Regulatory Impact Analysis (Paper highlighting: To take the DICE model as an example (Nordhaus, 2008; Nordhaus & Boyer, 2000), it can easily be shown that the assumption of a quadratic relationship between damages and temperature, together with the modellers’ specific coefficient values, implies that global warming can reach more than 6°C before the equivalent of 10% of global GDP is lost, and 18°C before the equivalent of 50% is lost.)


from Skeptical Science https://ift.tt/2OkEu6q

Science Snaps: digging for clues on how bowel cancer starts

Section of human colon showing sausage-shaped crypts. The section has been stained for a protein called MAOA (shown in brown). The blue crypt carries a fault in the MAOA gene, which stops the protein being made and means the crypt no longer shows up as brown.

This entry is part 23 of 23 in the series Science Snaps

Cora Olpe is a PhD student at the Cancer Research UK Cambridge institute, working with Dr Doug Winton. She’s interested in how gut stem cells acquire faults over time and how these spread to generate large mutated areas, which could promote cancer. 

In this guest post, she writes about her lab’s work to uncover how bowel cancer develops. 

The human bowel is a long tube coated in a single layer of cells, which bunches up and forms pockets called crypts.

This single layer of cells is exposed to a lot throughout the day and dead cells are constantly being removed from the body and replaced, thanks to special stem cells that live at the bottom of the crypts.

And buried in these crypts could be clues to how bowel cancer develops.

Scientists believe that bowel cancers are born from these stem cells. If stem cells develop faults in their DNA that make them divide more than they should, they can become growing clump of cells that can be identified first as a polyp and later as a tumour. And in some cases, these growths will become cancerous.

So, to understand how bowel cancer develops, we need to study how normal stem cells work and how they become faulty.

Hunting for faulty crypts

First, we need a way to highlight crypts that have DNA faults.

Each cell’s DNA carries the information to make proteins. Some faults can stop the cell producing a protein. So, by ‘painting’ certain proteins in brown, using a method called immunohistochemistry, we can detect when they’re absent, as a blue background colour is revealed.  You can see this in the image below.

Section of human colon stained for a protein called MAOA (shown in brown). The blue crypt carries a fault in the MAOA gene, which stops the protein being made and means the crypt no longer shows up as brown. With this method we can follow the spread of mutations without looking at the cells' DNA.

Section of human colon stained for a protein called MAOA (shown in brown). The blue crypt carries a fault in the MAOA gene, which stops the protein being made and means the crypt no longer shows up as brown. With this method we can follow the spread of mutations without looking at the cells’ DNA. Image courtesy of Winton lab. 

The blue crypts carry our fault of interest. I still remember the first time I saw one of the blue crypts among the crowd of brown. It was electrifying.

Using this technique, we went on to paint lots of healthy bowel samples from people aged 8 – 93 years and then counted the number of blue crypts.

It was a bit of a microscopy marathon, but what we found was exciting.

Accumulating faults

We found that bowel samples from older people had more mutant crypts than those of younger people. So as we age, we accumulate faults in the stem cells in our bowels.

But what was more interesting was how the mutant crypts divide. Typically, individual cells in our body will divide. But we found that the mutant crypts seem to do something different. It looks like they undergo a process called fission, where the whole crypt splits in two.

This creates patches of mutant crypts in the lining of the bowel, as can be seen in the image below.

Section of human colon stained for a protein called MAOA (shown in brown). The blue crypts carry a fault in the MAOA gene, which stops the protein being made and means the crypt no longer shows up as brown. We think the fault appears in one crypt which then divides again and again (in a process called "fission") to form patches of mutant crypts.

Section of human colon stained for a protein called MAOA (shown in brown). The blue crypts carry a fault in the MAOA gene, which stops the protein being made and means the crypt no longer shows up as brown. We think the fault appears in one crypt which then divides again and again (in a process called “fission”) to form patches of mutant crypts. Image courtesy of Winton lab. 

Different gene faults affect these processes in different ways. Some barely generate patches. Others, like those in the cancer-promoting gene KRAS, seem to strongly affect fission to create large patches of 100 or more mutant crypts.

This could be important for cancer, as the more mutant crypts you have, the greater the chance that cells within those crypts will develop extra mutations that could lead to cancer.

Changing the story

We also found large variation in the number of mutant crypts among the different samples we looked at. This may suggest that lifestyle could be affecting how the stem cells behave and acquire DNA faults. Equally, a person’s genetics may also play a role.

We don’t yet have the answers to this, but we’re digging deeper into the data to find out if stem cells found in the bowel behave differently depending on factors like smoking, alcohol and obesity. We’re also using DNA sequencing to look at genetic variation between people’s samples.

Together, this data will help us to understand why bowel cancer affects some people and not others.

Cora Olpe is a PhD student at the Cancer Research UK Cambridge Institute

Reference

Nicholson et al. (2018) Fixation and spread of somatic mutations in adult human colonic epithelium. Cell Stem Cell. DOI: 10.1016/j.stem.2018.04.020


from Cancer Research UK – Science blog https://ift.tt/2qoAdoE

NASA to continue signaling Opportunity rover on Mars

This image is part of a panorama, whose component images were acquired by Opportunity from June 7 to 19, 2017. See the rover tracks? Image via NASA/JPL-Caltech/Cornell/Arizona State University.

UPDATE NOVEMBER 1, 2018: NASA said this week that, although it has passed the initially planned 45-day signaling period for the Mars rover Opportunity, which has been silent since a major dust storm swept over the rover’s location in June, it will continue signaling efforts. The update page for the rover announced on Monday:

After a review of the progress of the listening campaign, NASA will continue its current strategy for attempting to make contact with the Opportunity rover for the foreseeable future. Winds could increase in the next few months at Opportunity’s location on Mars, resulting in dust being blown off the rover’s solar panels. The agency will reassess the situation in the January 2019 time frame.

NASA had announced on August 30, 2018, that it was about to begin a 45-day effort to restore communication with the rover. It said recovery efforts would begin in earnest when atmospheric opacity (tau) over the rover site had fallen below an estimated measurement of 1.5, twice, with one week apart between measurements. On September 10, NASA said that the benchmark had been reached, and that skies were clearing over the rover. The Opportunity team at NASA’s Jet Propulsion Laboratory in Pasadena, California, had been sending a command to the rover three times a week, in hopes of eliciting a response. At that time, the team began increasing the frequency of commands to multiple times per day, for a planned 45 days. NASA said then:

Passive listening for Opportunity will also continue to be performed by JPL’s Radio Science Group, which records radio signals emanating from Mars with a very sensitive broadband receiver.

The 14-year-old rover has been silent on Mars’ surface since early June, when a dust storm on Mars went global and blotted out the sun over Opportunity’s location.

The rover is solar-powered and needs sunlight to operate.

If you want to follow the rover recovery efforts on Twitter, you can do so here: @MarsRovers.

Tempers flared a bit over these months of silence for the rover. When NASA first announced it would give the rover 45 days to wake up, Mike Seibert, a former flight director and rover driver for Opportunity who is no longer at JPL, is one of several who said publicly that time period was too short. He commented that JPL attempted active listening for Spirit, the twin of Opportunity, for 10 months in 2010 and 2011 when that rover stopped transmitting before giving up.

Following Seibert’s tweet, and the reactions it caused, NASA took special care with its subsequent announcements about the recovery. The space agency revised part of its August 30 statement to including the following, more fully described recovery process for Opportunity:

The science team is also sending a command three times a week to elicit a beep if the rover happens to be awake, and will soon be expanding the commanding to include ‘sweep and beeps’ to address a possible complexity with certain conditions within the mission clock fault. These will continue through January of 2019 …

Back during the attempted recovery of the Spirit rover, a technical issue required the team to actively command the rover to communicate. Opportunity has no such issue; if we hear from it, it will likely be from listening passively as we have been, and as we will continue to do through January.

As we wait to hear whether Oppotunity will revive and respond, there’s been an outpouring of warmth toward the little robot explorer, now sitting silent on Mars. If you want to join in, you could send a postcard. In the meantime, on Twitter today, many gushed their support for the rover, from afar:

View larger. | Opportunity caught its own shadow on Mars on July 26, 2008. Read more about this image.

Bottom line: The 45-day period of signaling multiple times per day to the 14-year-old Opportunity rover on Mars has ended, but NASA said this week it will continue to try to signal the rover. The solar-powered rover has been silent since June, 2018, when a global dust storm blotted out the sun from its location. Good luck, Oppy!

Via NASA


from EarthSky https://ift.tt/2PuxRTF

Rare blue asteroid sometimes behaves like a comet

Artist’s concept of what Phaeton might look like up close. Image via Heather Roper.

Blue asteroids are rare, and blue comets are almost unheard of. An international team of astronomers investigated 3200 Phaethon, a bizarre blue asteroid that sometimes behaves like a comet, and found it even more enigmatic than they’d previously thought.

On December 16, 2017, the asteroid made its closest approach to Earth since 1974, passing within 6.4 million miles (10.3 million km). The team analyzed data from the fly-by from several telescopes around the world to learn more about the mysterious object which has puzzled astronomers since its discovery in 1983. The researchers presented the results of their study on October 23, 2018 at the annual meeting of the American Astronomical Society’s Division for Planetary Science in Knoxville, Tennessee.

Blue asteroids, which reflect more light in the blue part of the spectrum, make up only a fraction of all known asteroids. A majority of asteroids are dull grey to red, depending on the type of material on their surface.

Phaethon sets itself apart for two reasons: it appears to be one of the bluest of similarly-colored asteroids or comets in the solar system; and its orbit takes it so close to the sun that its surface heats up to about 1,500 degrees Fahrenheit (800 degrees C), hot enough to melt aluminum.

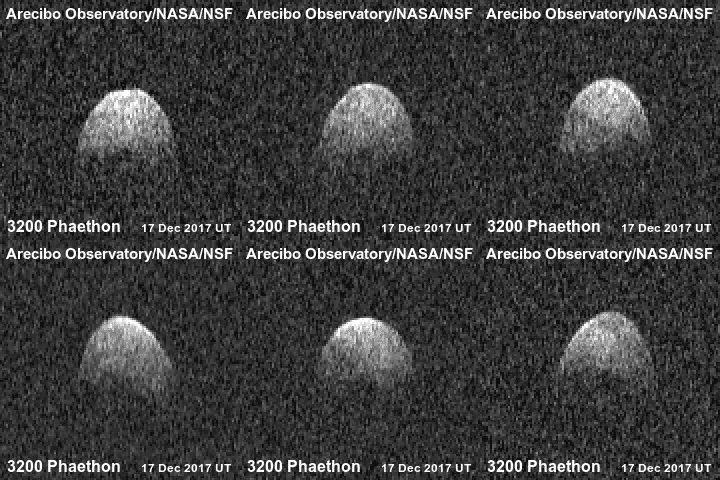
Radar images of 3200 Phaethon generated December 17, 2017, by astronomers at the Arecibo Observatory in Puerto Rico on. At time of closest approach on December 16 the asteroid was about 6.4 million miles (10.3 million km) away, or about 27 times the distance from Earth to the moon. The encounter is the closest the asteroid will come to Earth until 2093. Image via Wikipedia.

Astronomers have been intrigued by Phaethon for other reasons, too. It has the qualities of both an asteroid and a comet based on its appearance and behavior.

Phaethon always appears as a dot in the sky, like thousands of other asteroids, and not as a fuzzy blob with a tail, like a comet. But Phaethon is the source of the annual Geminid meteor shower, easily seen in early-to-mid December.

Meteor showers occur when Earth passes through the trail of dust left behind on a comet’s orbit. When they occur and where they appear to originate from depends on how the comet’s orbit is oriented with respect to the Earth. Phaethon is thought to be the “parent body” of the Geminid meteor shower because its orbit is very similar to the orbit of the Geminid meteors.

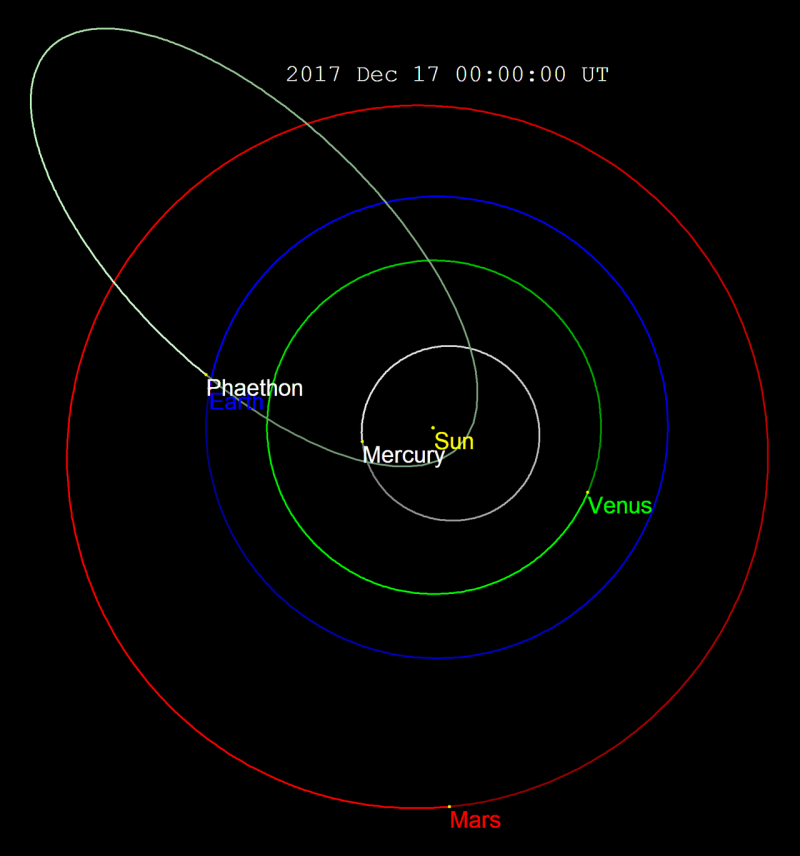
The elliptical orbit of 3200 Phaethon crosses the orbits of Mars, Earth, Venus and Mercury. Image via Wikipedia.

Until Phaeton was discovered in 1983, scientists linked all known meteor showers to active comets and not asteroids.

Teddy Kareta, a doctoral student at the University of Arizona’s Lunar and Planetary Laboratory, led the study. Karate said in a statement:

At the time, the assumption was that Phaethon probably was a dead, burnt-out comet, but comets are typically red in color, and not blue. So, even though Phaeton’s highly eccentric orbit should scream ‘dead comet,’ it’s hard to say whether Phaethon is more like an asteroid or more like a dead comet.

Phaethon also releases a tiny dust tail when it gets closest to the sun in a process that is thought to be similar to a dry riverbed cracking in the afternoon heat. This kind of activity has only been seen on two objects in the entire solar system – Phaeton and one other, similar object that appears to blur the line traditionally thought to set comets and asteroids apart.

The team obtained several new insights about Phaethon after analyzing data obtained from NASA’s Infrared Telescope Facility in Hawaii and the Tillinghast telescope in Arizona. They think Phaethon might be related or have broken off from 2 Pallas, a large blue asteroid farther out in the solar system. Karate said:

Interestingly, we found Phaethon to be even darker than had been previously observed, about half as reflective as Pallas. This makes it more difficult to say how Phaethon and Pallas are related.

The team also observed that Phaethon’s blue color is the same on all parts of its surface, which they say indicates it has been cooked evenly by the sun in the recent past.

The 2019 lunar calendars are here! Order yours before they’re gone. Makes a great gift.

Bottom line: New insights on 3200 Phaethon, an asteroid that often acts like a comet.

Via University of Arizona


from EarthSky https://ift.tt/2yIQYQg

What made these weird straight lines on Dione?

Distribution of linear virgae on Dione (top) and Rhea (bottom). Image via A) Basemap from Roatsch et al, 2008. B) Image No. N1649318802. C) Basemap from Roatsch et al, 2012. D) Image No. N1673420688.

There are many dozens of moons in the solar system, and all of them are unique, ranging from tiny asteroid-like bodies to worlds with subsurface oceans and methane seas. The more that we explore these moons, the more surprises that are discovered; another such unexpected discovery was just announced by planetary scientists that has them scratching their heads – long, straight lines on Saturn’s moon Dione which look like they were “painted” on the surface. They are similar to ones on another moon of Saturn – Rhea – but much more numerous.

The unusual finding was announced by the Planetary Science Institute (PSI) on October 24, 2018, and a new paper has been published in the peer-reviewed journal Geophysical Research Letters. From the paper:

After the arrival of the Cassini spacecraft to the Saturnian system, unusual linear features were observed across Dione. We also noticed similar features on Saturn’s moon Rhea. We name these features linear virgae (virgae meaning a stripe or streak of color) and report on their distribution and characteristics as they are observed on the surfaces of Dione and Rhea. Our understanding of the distribution of linear virgae across Rhea is incomplete, likely because of data coverage; however, on Dione, we find that linear virgae are parallel to the equator and are confined to the region between 45°N and 45°S. We explored different ways of forming linear features on planetary surfaces and favor the draping of exogenic material across a planetary surface by encounters with either Saturn’s rings, co-orbital moons, or close flyby of comets. This debris may introduce materials into the Dione system that could contribute to creating a more habitable Dione.

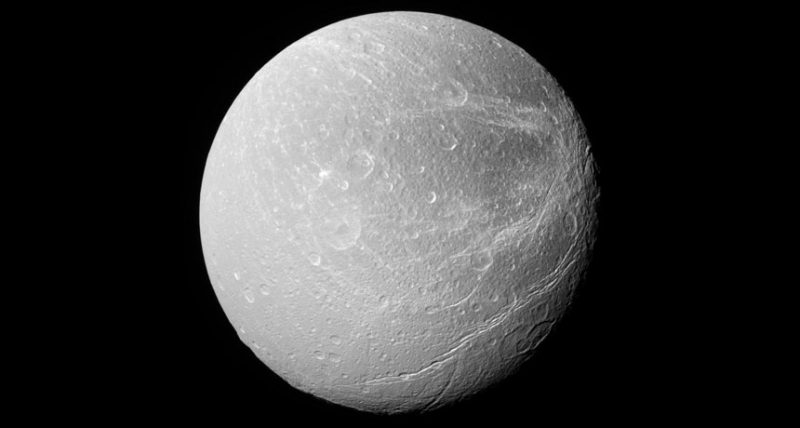
Saturn’s moon Dione as seen by the Cassini spacecraft. The bright wispy streaks seen here are not the same as the long, straight linear features elsewhere on the moon. Image via Space Science Institute/NASA/JPL.

The lines – known as linear virgae – are 10 to 100s of kilometers long, less than 5 kilometers wide, run parallel to each other and the equator, and are brighter than the underlying terrain. Their “painted look” comes from the fact that they overly surface features and seem to ignore topography. As PSI research scientist Alex Patthoff explained:

The evidence preserved in the linear virgae has implications for the orbital evolution and impact processes within the Saturnian system. Plus, the interaction of Dione’s surface and exogenic material has implications for its habitability and provides evidence for the delivery of ingredients that may contribute the habitably of ocean worlds in general.

The lines were discovered by Patthoff and Emily S. Martin of the Center for Earth and Planetary Studies at the National Air and Space Museum while examining images of Dione sent back by the Cassini spacecraft, which ended its long 13-year mission in September of last year. The features have been difficult to explain, as Patthoff noted:

Their orientation, parallel to the equator, and linearity are unlike anything else we’ve seen in the solar system. If they are caused by an exogenic source, that could be another means to bring new material to Dione. That material could have implications for the biological potential of Dione’s subsurface ocean.

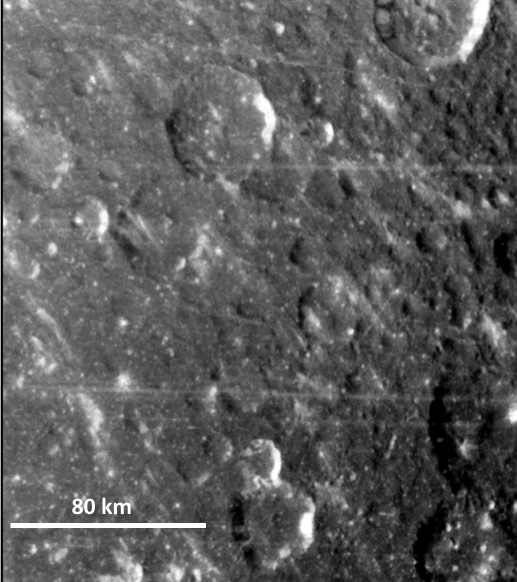
A view of some of the long linear features on Dione. Image via NASA/Emily Martin/Alex Patthoff.

It is tempting to consider that maybe they are not even natural features at all, although Occam’s Razor would suggest that they are most likely natural in origin. As Patthoff also commented in GeoSpace:

I’ve never seen anything this linear anywhere in the solar system. You can take a ruler to these images and you can trace them along this perfectly straight line for tens of kilometers or more sometimes. You just don’t see these kinds of things in nature.

But since the lines seem to be so unique, what could have made them? The researchers first looked at known mechanisms for creating long linear patterns, such as tectonic faults, rolling boulders, pit/crater chains or comet impacts, but none of those explanations were adequate. According to Martin:

None of those mechanisms fit. If they fit the morphology, they didn’t fit the distribution. If they fit the distribution, they didn’t fit the morphology.

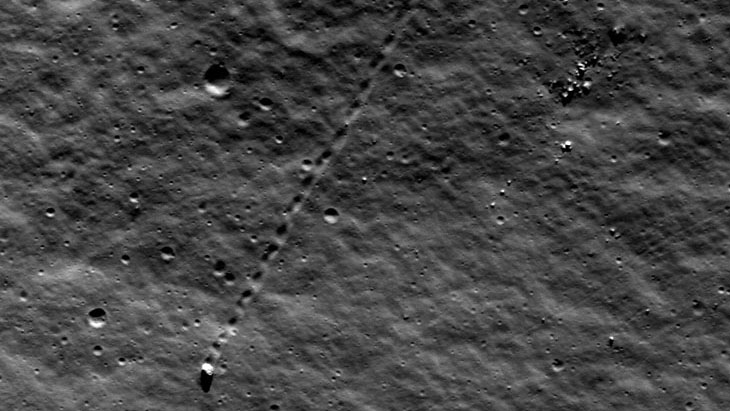
A linear groove on Earth’s moon, created by a rolling boulder. Image via Arizona State University/GSFC/NASA.

As she also told Science News:

They’re just really bizarre. It’s really exciting when you see something really strange, and you’re just trying to figure out what the heck it could possibly be.

Since the lines overlie other topography, this also suggests that they are younger than the underlying terrain – they are different from any kind of linear crater/pit chains or grooves, since they lie on top of the terrain, not carved into it.

So what is the most likely explanation? The researchers think that they are most probably due to impacts from dust-sized material with low enough mass and velocity to form long and linear streaks while being deposited onto Dione’s surface, rather than forming craters. That debris may have come from Saturn’s rings, from the two other moons also within Dione’s orbit or from somewhere outside the Saturnian system. This is still just a hypothesis however at this point.

Dione is thought to have a subsurface ocean, like the ones on Europa, Enceladus, Titan and Ganymede. It is possible that the material could make its way into Dione’s ocean, perhaps affecting its habitability. According to Martin:

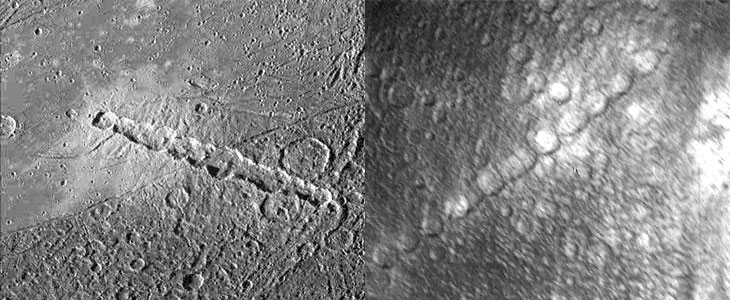
Linear rows of pits or craters on Jupiter’s moons Ganymede (left) and Callisto (right). Image via Brown University, JPL/NASA/Paul M. Schenk/Lunar and Planetary Institute.

“If we as geologists can do a better job of saying where material is coming from and how it is being introduced into these different environments then we can be a little bit more confident about whether or not Dione has an environment that is either habitable or whether or not that environment might be suitable for generating its own life.

Bottom line: These weird long straight lines on Dione – like those on Rhea – are unusual and seemingly out of place on their moons’ otherwise desolate surfaces. Scientists have some ideas how they may have formed, but a more definitive solution to the mystery will require further study.

Source: Mysterious Linear Features Across Saturn’s moon Dione

Via Planetary Science Institute


from EarthSky https://ift.tt/2SH0zPY

Patagonia moon

Image via Grafixartphoto.

The 2019 lunar calendars are here! Order yours before they’re gone. Makes a great gift.


from EarthSky https://ift.tt/2qma3Dd

Sky Bear comes to Earth in November

Tonight … a constellation you might or might not see, depending on your latitude. In the Northern Hemisphere, the Big Dipper is probably the sky’s best known asterism. In other words, it’s a recognizable pattern of stars – not an official constellation. The Big Dipper is part of the constellation Ursa Major, otherwise known as the Great Bear.

Every year, the Big Dipper (Great Bear) descends to its lowest point in the sky on November evenings. In fact, people in the southern part of the United States can’t see the Big Dipper in the evening right now, because it swings beneath their northern horizon.

And, of course, it can’t be seen in the evening from Southern Hemisphere latitudes now either.

Image Credit: AlltheSky.com

Image Credit: AlltheSky.com

Even in the northern states, the Big Bear is hard to spot. The Big Dipper skims along the northern horizon in the evening, ducking behind any obstructions – such as trees and mountains.

To the Micmac Indians living in southeast Canada, a Celestial Bear – our same familiar Big Dipper pattern – coming down to Earth signaled the start of hibernation season. This is when earthly bears return to their dens, and when the sap of trees returns to the warm womb of the underworld. Weary creation tucks in, waiting for winter’s deep slumber.

The Micmacs saw the Big Dipper handle stars as hunters forever chasing Celestial Bear. In their sky lore, hunters catch Celestial Bear each year in the fall, and it’s the dripping blood from the Bear that colors the autumn landscape.

Donate: Your support means the world to us

View larger. | Another portrayal of the Big Dipper in November. It's Vincent van Gogh's Starry Night Over the Rhone, painted in September 1888 at Arles. Had you noticed the Big Dipper in this painting? Can you see it tonight?

View larger. | Another portrayal of the Big Dipper in November. It’s Vincent van Gogh’s Starry Night Over the Rhone, painted in September 1888 at Arles. Had you noticed the Big Dipper in this painting? Can you see it tonight?

Bottom line: The Big Dipper is difficult, or impossible, to see on November evenings. If you’re in the southern U.S. or a similar latitude around the world, the Dipper is below your northern horizon in the evening now. If you’re in the northern U.S. or a similar latitude, the Big Dipper may be above your horizon in the evening, but it will be low in the northern sky.

November 2018 guide to the five visible planets

EarthSky lunar calendars are cool! They make great gifts. Order now. Going fast!

Donate: Your support means the world to us


from EarthSky https://ift.tt/2DfQDbF