Image via ESA.
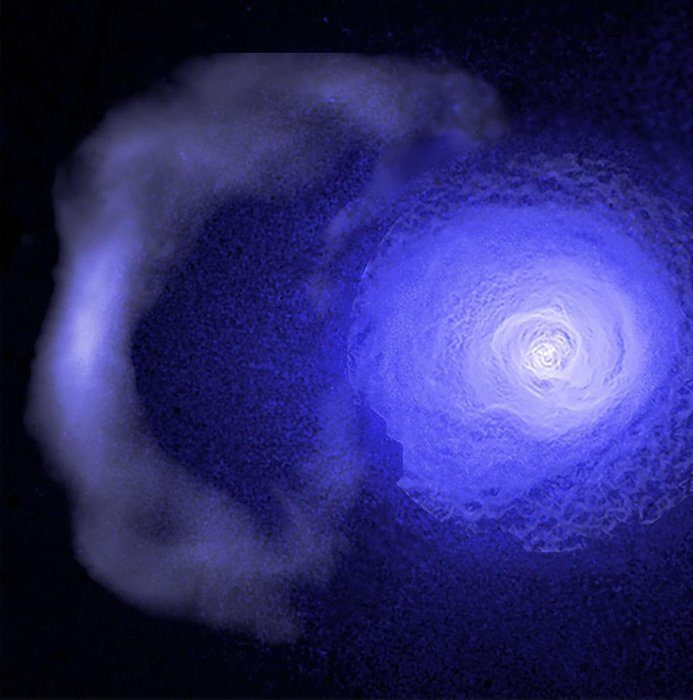
The European Space Agency (ESA) said on October 29, 2018 that a trio of X-ray telescopes – Chandra, XMM-Newton and ROSAT – observed this gigantic structure in the Perseus galaxy cluster. It described the feature as a cold front, but the word cold is relative here; in fact, the X-ray satellites are sensitive to extremely hot gases. In this case, they’re being used to study interstellar gas heated to millions of degrees around the extreme environment of colliding galaxies. ESA said:
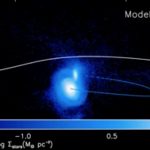
The ancient cold front can be seen at the left of the image, drifting away from the inner, younger front closer to the center. Galactic cold fronts are nothing like the cold fronts we experience on Earth – instead they are caused by galaxy clusters colliding into one another. The gravitational pull of a larger cluster tugs a smaller cluster closer, resulting in gas in the core of the cluster being sloshed around like liquid in a glass. This creates a cold front in a spiral pattern moving outwards from the core and these sloshing cold fronts can provide a probe of the intercluster medium.
Cold fronts are the oldest coherent structures in cool core clusters and this one has been moving away from the center of the cluster for over five billion years – longer than our solar system has been in existence. The long curving structure spans around 2 million light years and is travelling at around 30 miles (50 km) per second.
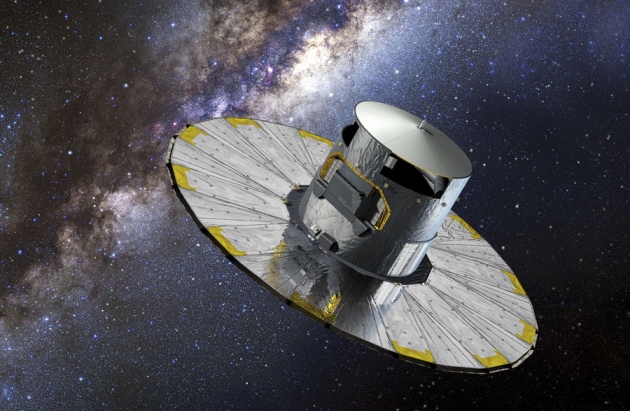
The image combines data from NASA’s Chandra X-Ray observatory, ESA’s XMM-Newton and the German Aerospace Centre-led ROSAT satellite. Chandra also took a separate close-up of the upper left of the cold front, revealing some unexpected details.
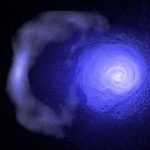
The Perseus galaxy cluster contains thousands of galaxies and a supermassive black hole at the centre. The black hole is responsible for creating a harsh environment of sound waves and turbulence that should erode a cold front over time, smoothing out the previously sharp edges and creating gradual changes in density and temperature. Instead, the high-resolution Chandra image showed a surprisingly sharp edge on the cold front, and a temperature map revealed that the upper left of the cold front is split in two.
The sharpness of the cold front suggests it has been preserved by strong magnetic fields wrapped around it, essentially acting as a shield against the harsh environment. This magnetic ‘draping’ prevents the cold front from diffusing and is what has allowed it to survive so well for over five billion years as it drifts away from the center of the cluster.
Read the discovery announcement about this cold front, from 2017, here: Scientists Find Giant Wave Rolling Through the Perseus Galaxy Cluster.
The 2019 lunar calendars are here! Order yours before they’re gone. Makes a great gift.
Bottom line: A gigantic cold front in the Perseus galaxy cluster, in an image that combines data from NASA’s Chandra X-Ray observatory, ESA’s XMM-Newton and the German Aerospace Centre-led ROSAT satellite.
from EarthSky https://ift.tt/2ERDtDm
Image via ESA.
The European Space Agency (ESA) said on October 29, 2018 that a trio of X-ray telescopes – Chandra, XMM-Newton and ROSAT – observed this gigantic structure in the Perseus galaxy cluster. It described the feature as a cold front, but the word cold is relative here; in fact, the X-ray satellites are sensitive to extremely hot gases. In this case, they’re being used to study interstellar gas heated to millions of degrees around the extreme environment of colliding galaxies. ESA said:
The ancient cold front can be seen at the left of the image, drifting away from the inner, younger front closer to the center. Galactic cold fronts are nothing like the cold fronts we experience on Earth – instead they are caused by galaxy clusters colliding into one another. The gravitational pull of a larger cluster tugs a smaller cluster closer, resulting in gas in the core of the cluster being sloshed around like liquid in a glass. This creates a cold front in a spiral pattern moving outwards from the core and these sloshing cold fronts can provide a probe of the intercluster medium.
Cold fronts are the oldest coherent structures in cool core clusters and this one has been moving away from the center of the cluster for over five billion years – longer than our solar system has been in existence. The long curving structure spans around 2 million light years and is travelling at around 30 miles (50 km) per second.
The image combines data from NASA’s Chandra X-Ray observatory, ESA’s XMM-Newton and the German Aerospace Centre-led ROSAT satellite. Chandra also took a separate close-up of the upper left of the cold front, revealing some unexpected details.
The Perseus galaxy cluster contains thousands of galaxies and a supermassive black hole at the centre. The black hole is responsible for creating a harsh environment of sound waves and turbulence that should erode a cold front over time, smoothing out the previously sharp edges and creating gradual changes in density and temperature. Instead, the high-resolution Chandra image showed a surprisingly sharp edge on the cold front, and a temperature map revealed that the upper left of the cold front is split in two.
The sharpness of the cold front suggests it has been preserved by strong magnetic fields wrapped around it, essentially acting as a shield against the harsh environment. This magnetic ‘draping’ prevents the cold front from diffusing and is what has allowed it to survive so well for over five billion years as it drifts away from the center of the cluster.
Read the discovery announcement about this cold front, from 2017, here: Scientists Find Giant Wave Rolling Through the Perseus Galaxy Cluster.
The 2019 lunar calendars are here! Order yours before they’re gone. Makes a great gift.
Bottom line: A gigantic cold front in the Perseus galaxy cluster, in an image that combines data from NASA’s Chandra X-Ray observatory, ESA’s XMM-Newton and the German Aerospace Centre-led ROSAT satellite.
from EarthSky https://ift.tt/2ERDtDm

")