Story of the Week... Editorial of the Week... Toon of the Week... SkS in the News... Coming Soon on SkS... Climate Feedback Reviews... Poster of the Week... SkS Week in Review...
Story of the Week...
Scientists Push for a Crash Program to Scrub Carbon From the Air
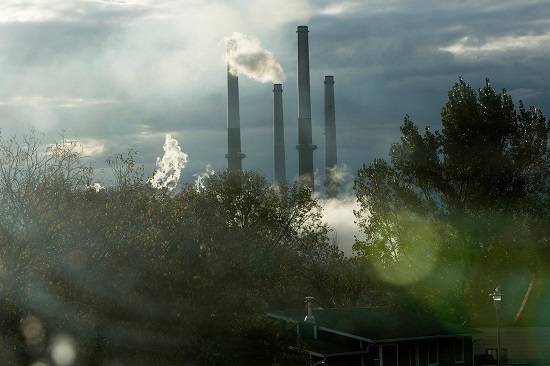
A coal plant in Colstrip, Mont. Scientists say countries have put off reducing carbon emissions for so long that even a breakneck shift toward clean energy would most likely not be enough. Credit: Janie Osborne for The New York Times
With time running out to avoid dangerous global warming, the nation’s leading scientific body on Wednesday urged the federal government to begin a research program focused on developing technologies that can remove vast quantities of carbon dioxide out of the atmosphere in order to help slow climate change.
The 369-page report, written by a panel of the National Academies of Sciences, Engineering and Medicine, underscores an important shift. For decades, experts said that nations could prevent large temperature increases mainly by reducing reliance on fossil fuels and moving to cleaner sources like solar, wind and nuclear power.
But at this point, nations have delayed so long in cutting their carbon dioxide emissions that even a breakneck shift toward clean energy would most likely not be enough. According to a landmark scientific report issued by the United Nations this month, taking out a big chunk of the carbon dioxide already loaded into the atmosphere may be necessary to avoid significant further warming, even though researchers haven’t yet figured out how to do so economically, or at sufficient scale.
And we’ll have to do it fast. To meet the climate goals laid out under the Paris Agreement, humanity may have to start removing around 10 billion tons of carbon dioxide from the air each year by midcentury, in addition to reducing industrial emissions, said Stephen W. Pacala, a Princeton climate scientist who led the panel. That’s nearly as much carbon as all the world’s forests and soils currently absorb each year.
Scientists Push for a Crash Program to Scrub Carbon From the Air by Brad Plumer, Climate, New York Times, Oct 24, 2018Editorial of the Week...
How Scientists Cracked the Climate Change Case
The biggest crime scene on the planet is the planet. We know the earth is warming, but who or what is causing it?

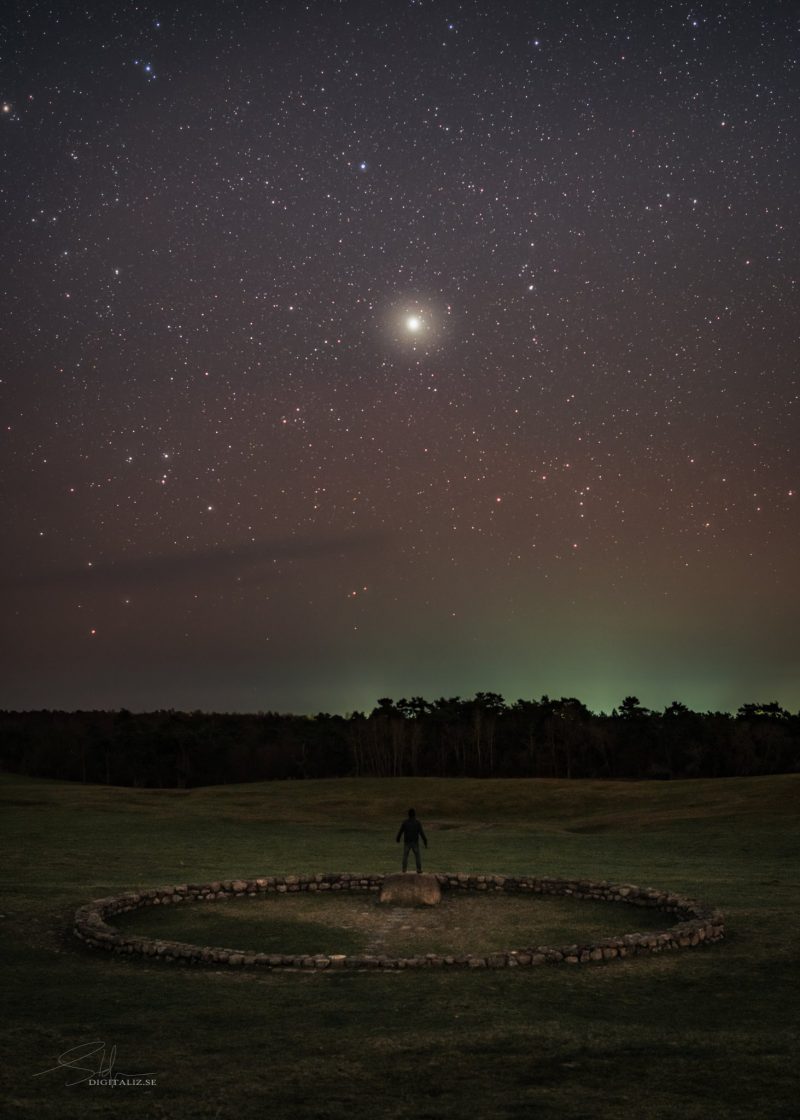
Credit: Emilia Miękisz
The latest report from the world’s climate scientists has made clear the size of the challenge if the world is to stay below the global warming limit hoped for in the Paris climate agreement. Unfortunately, with current trends we are likely to cross this threshold within the next two decades because we are already two-thirds of the way there.
But how do we know what is driving these climate trends? It comes down to the same kind of detective work that typifies a crime scene investigation, only here we are dealing with a case that encompasses the whole world. Let me give you my view, which does not necessarily represent the position of NASA or the federal government.
For the past 100 years we have documented good, independently confirmed observations of change at the surface of the planet, and for the past 40 years satellites and comprehensive measuring efforts have provided a much fuller view of changes throughout the earth system. These observations show clearly that among other things, the surface of the planet has warmed, the upper atmosphere has cooled, the oceans are gaining an enormous amount of heat, sea level is rising, Arctic ice has greatly receded and glaciers around the world are in retreat.
Scientists Push for a Crash Program to Scrub Carbon From the Air by Brad Plumer, Climate, New York Times, Oct 24, 2018
Toon of the Week...

SkS in the News...
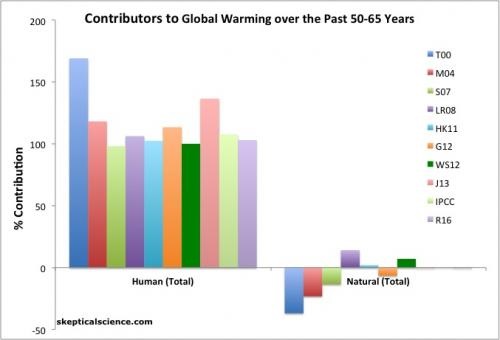
The SkS Graphic Human vs. Natural Contributions to Global Warming is prominently featured by David Roberts in his article Why conservatives keep gaslighting the nation about climate change published in the Energy & Environment section of Vox on Oct 23, 2018.
Coming Soon on SkS...
- Canada passed a carbon tax that will give most Canadians more money (Dana)
- Eulogy for Climate Consensus - the 97% (Dana)
- China's GHG emissions (Riduna)
- Climate Impacts (ATTP)
- New research this week (Ari)
- 2018 SkS Weekly Climate Change & Global Warming News Roundup #44 (John Hartz)
- 2018 SkS Weekly Climate Change & Global Warming Digest #44 (John Hartz)
Poster of the Week...
SkS Week in Review...
- 2018 SkS Weekly Climate Change & Global Warming News Roundup #43 by John Hartz
- New research, October 15-21, 2018 by Ari Jokimäki
- Blood coal: Ireland’s dirty secret by Noel Healy (Climate Consensus - the 97%, Environment, Guardian)
- Some of the countries leading on climate change might surprise you by John Abraham, (Climate Consensus - the 97%, Environment, Guardian)
- Climate change and compassion fatigue by Kaitlin Naughten (Climate Sight)
- Trump thinks scientists are split on climate change. So do most Americans by Dana Nuccitelli, (Climate Consensus - the 97%, Environment, Guardian)
- 2018 SkS Weekly Climate Change & Global Warming Digest #42 by John Hartz
from Skeptical Science https://ift.tt/2Rle5qH
Story of the Week... Editorial of the Week... Toon of the Week... SkS in the News... Coming Soon on SkS... Climate Feedback Reviews... Poster of the Week... SkS Week in Review...
Story of the Week...
Scientists Push for a Crash Program to Scrub Carbon From the Air
A coal plant in Colstrip, Mont. Scientists say countries have put off reducing carbon emissions for so long that even a breakneck shift toward clean energy would most likely not be enough. Credit: Janie Osborne for The New York Times
With time running out to avoid dangerous global warming, the nation’s leading scientific body on Wednesday urged the federal government to begin a research program focused on developing technologies that can remove vast quantities of carbon dioxide out of the atmosphere in order to help slow climate change.
The 369-page report, written by a panel of the National Academies of Sciences, Engineering and Medicine, underscores an important shift. For decades, experts said that nations could prevent large temperature increases mainly by reducing reliance on fossil fuels and moving to cleaner sources like solar, wind and nuclear power.
But at this point, nations have delayed so long in cutting their carbon dioxide emissions that even a breakneck shift toward clean energy would most likely not be enough. According to a landmark scientific report issued by the United Nations this month, taking out a big chunk of the carbon dioxide already loaded into the atmosphere may be necessary to avoid significant further warming, even though researchers haven’t yet figured out how to do so economically, or at sufficient scale.
And we’ll have to do it fast. To meet the climate goals laid out under the Paris Agreement, humanity may have to start removing around 10 billion tons of carbon dioxide from the air each year by midcentury, in addition to reducing industrial emissions, said Stephen W. Pacala, a Princeton climate scientist who led the panel. That’s nearly as much carbon as all the world’s forests and soils currently absorb each year.
Scientists Push for a Crash Program to Scrub Carbon From the Air by Brad Plumer, Climate, New York Times, Oct 24, 2018Editorial of the Week...
How Scientists Cracked the Climate Change Case
The biggest crime scene on the planet is the planet. We know the earth is warming, but who or what is causing it?
Credit: Emilia Miękisz
The latest report from the world’s climate scientists has made clear the size of the challenge if the world is to stay below the global warming limit hoped for in the Paris climate agreement. Unfortunately, with current trends we are likely to cross this threshold within the next two decades because we are already two-thirds of the way there.
But how do we know what is driving these climate trends? It comes down to the same kind of detective work that typifies a crime scene investigation, only here we are dealing with a case that encompasses the whole world. Let me give you my view, which does not necessarily represent the position of NASA or the federal government.
For the past 100 years we have documented good, independently confirmed observations of change at the surface of the planet, and for the past 40 years satellites and comprehensive measuring efforts have provided a much fuller view of changes throughout the earth system. These observations show clearly that among other things, the surface of the planet has warmed, the upper atmosphere has cooled, the oceans are gaining an enormous amount of heat, sea level is rising, Arctic ice has greatly receded and glaciers around the world are in retreat.
Scientists Push for a Crash Program to Scrub Carbon From the Air by Brad Plumer, Climate, New York Times, Oct 24, 2018
Toon of the Week...
SkS in the News...
The SkS Graphic Human vs. Natural Contributions to Global Warming is prominently featured by David Roberts in his article Why conservatives keep gaslighting the nation about climate change published in the Energy & Environment section of Vox on Oct 23, 2018.
Coming Soon on SkS...
- Canada passed a carbon tax that will give most Canadians more money (Dana)
- Eulogy for Climate Consensus - the 97% (Dana)
- China's GHG emissions (Riduna)
- Climate Impacts (ATTP)
- New research this week (Ari)
- 2018 SkS Weekly Climate Change & Global Warming News Roundup #44 (John Hartz)
- 2018 SkS Weekly Climate Change & Global Warming Digest #44 (John Hartz)
Poster of the Week...
SkS Week in Review...
- 2018 SkS Weekly Climate Change & Global Warming News Roundup #43 by John Hartz
- New research, October 15-21, 2018 by Ari Jokimäki
- Blood coal: Ireland’s dirty secret by Noel Healy (Climate Consensus - the 97%, Environment, Guardian)
- Some of the countries leading on climate change might surprise you by John Abraham, (Climate Consensus - the 97%, Environment, Guardian)
- Climate change and compassion fatigue by Kaitlin Naughten (Climate Sight)
- Trump thinks scientists are split on climate change. So do most Americans by Dana Nuccitelli, (Climate Consensus - the 97%, Environment, Guardian)
- 2018 SkS Weekly Climate Change & Global Warming Digest #42 by John Hartz
from Skeptical Science https://ift.tt/2Rle5qH