How far is a light-year?

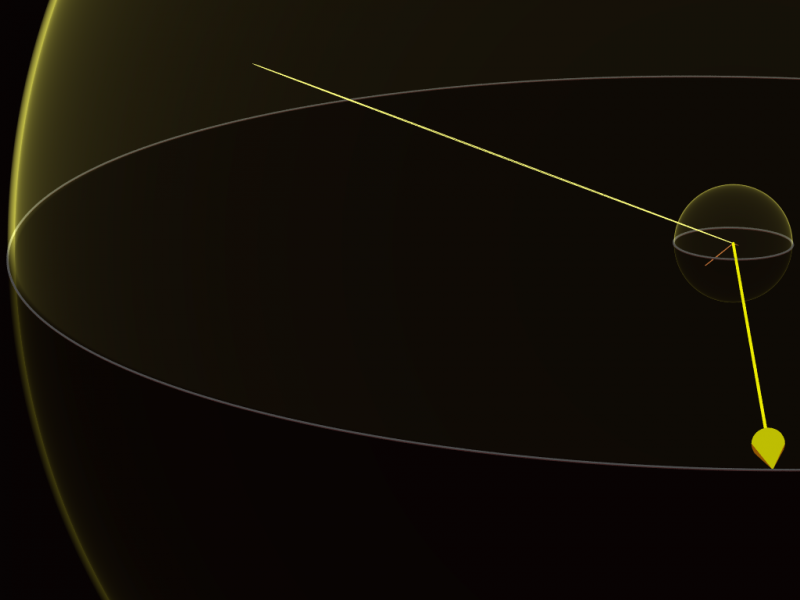
The large yellow shell depicts a light-year; the smaller yellow shell depicts a light-month. More details about this image at Wikimedia Commons.

The large yellow shell depicts a light-year; the smaller yellow shell depicts a light-month. Read more about this image at Wikimedia Commons.

Stars other than our sun are so far distant that astronomers speak of their distances not in terms of kilometers or miles – but in light-years. Light is the fastest-moving stuff in the universe. If we simply express light-years as miles and kilometers, we end up with impossibly huge numbers. But the 20th century astronomer Robert Burnham Jr. – author of Burnham’s Celestial Handbook – devised an ingenious way to portray the distance of one light-year and ultimately of expressing the distance scale of the universe, in understandable terms.

He did this by relating the light-year to the Astronomical Unit – the Earth-sun distance.

One Astronomical Unit, or AU, equals about 93 million miles (150 million km).

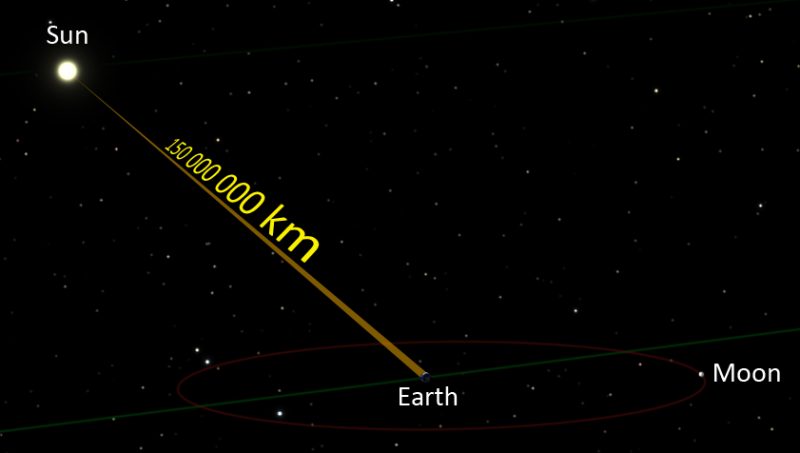
Another way of looking at it: the Astronomical Unit is a bit more than 8 light-minutes in distance.

A light beam takes 8 minutes to travel the 93 million miles (150 million km) from the sun to the Earth. Image via Brews OHare on Wikimedia Commons.

A light beam takes 8 minutes to travel the 93 million miles (150 million km) from the sun to the Earth. Image via Brews OHare on Wikimedia Commons.

Robert Burnham noticed that, quite by coincidence, the number of astronomical units in one light-year and the number of inches in one mile are virtually the same.

For general reference, there are 63,000 astronomical units in one light-year, and 63,000 inches (160,000 cm) in one mile (1.6 km).

This wonderful coincidence enables us to bring the light-year down to Earth. If we scale the astronomical unit – the Earth-sun distance – at one inch, then the light-year on this scale represents one mile (1.6 km).

The closest star to Earth, other than the sun, is Alpha Centauri at some 4.4 light-years away. Scaling the Earth-sun distance at one inch places this star at 4.4 miles (7 km) distant.

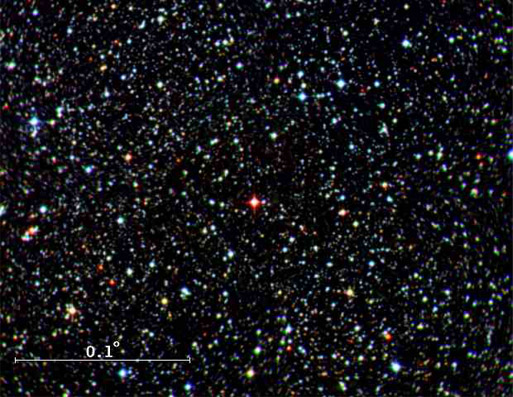
The red star in the center of this picture is Proxima Centauri, our sun's nearest neighbor among the stars. A beam of light from this star takes about 4 years to travel to Earth. Image via hyperphysics.phy-astr.gsu.edu

Scaling the Astronomical Unit at one inch (2.5 cm), here are distances to various bright stars, star clusters and galaxies:

Alpha Centauri: 4 miles (6.4 km)

Sirius: 9 miles (14.5 km)

Vega: 25 miles (40 km)

Fomalhaut: 25 miles (40 km)

Arcturus: 37 miles (60 km)

Antares: 600 miles (966 km)

Pleiades open star cluster: 440 miles (708 km)

Hercules globular star cluster (M13): 24,000 miles (38,600 km)

Center of Milky Way galaxy: 27,000 miles (43,500 km)

Great Andromeda galaxy (M31): 2,300,000 miles (3,700,000 km)

Whirlpool galaxy (M51): 37,000,000 miles (60,000,000 km)

Sombrero galaxy (M104): 65,000,000 miles (105,000,000 km)

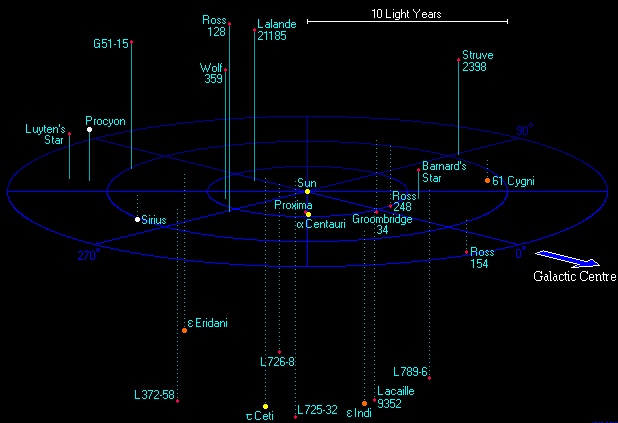
There are 33 stars within 12.5 light years of our sun. Image via Atlas of the Universe.

There are 33 stars within 12.5 light years of our sun. Image via Atlas of the Universe.

Light is the fastest-moving stuff in the universe. It travels at an incredible 186,000 miles (300,000 km) per second.

That’s very fast. If you could travel at the speed of light, you would be able to circle the Earth’s equator about 7.5 times in just one second!

A light-second is the distance light travels in one second, or 7.5 times the distance around Earth’s equator. A light-year is the distance light travels in one year.

How far is that? Multiply the number of seconds in one year by the number of miles or kilometers that light travels in one second, and there you have it: one light-year. It’s about 5.88 trillion miles (9.5 trillion km).

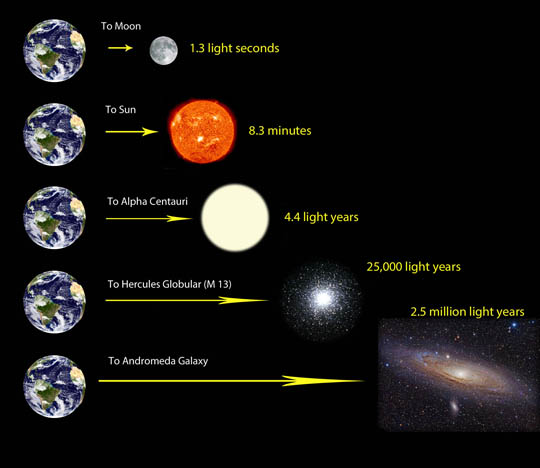
This scale starts close to home but takes us all the way out to the Andromeda Galaxy, the most distant object most people can see with the unaided eye. Image via Bob King / SkyandTelescope.com.

This scale starts close to home but takes us all the way out to the Andromeda Galaxy, the most distant object most people can see with the unaided eye. Image via Bob King / Skyandtelescope.com.

Bottom line: The scale of light-years expressed as miles and kilometers.

What is a light-year?

Enjoying EarthSky? Sign up for our free daily newsletter today!


from EarthSky https://ift.tt/13RT78F

Which lizards can outlast a hurricane?

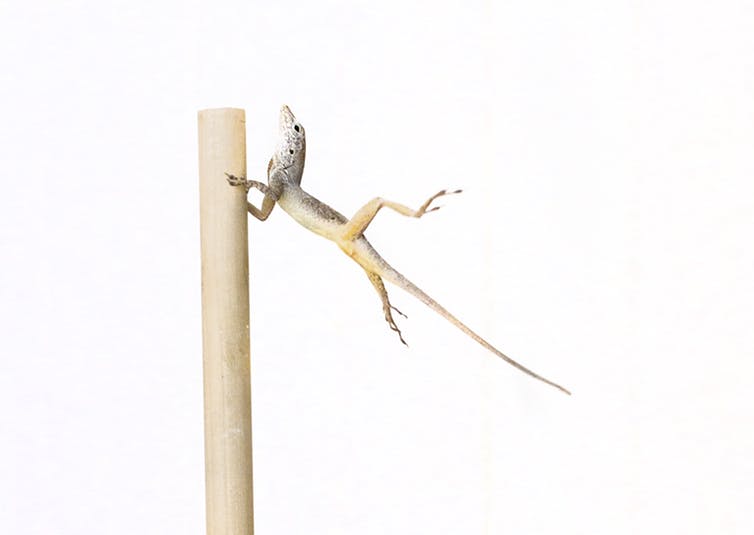
Holding on in hurricane-force winds. Image via Colin Donihue.

By Colin Donihue, Harvard University

The Turks and Caicos anole is a small brown lizard found running through the undergrowth in the Turks and Caicos Islands. It’s an endemic species, meaning these few islands are the only place to find Anolis scriptus anywhere in the world. Despite the species being fairly common there, scientists know relatively little about its behavior, diet, detailed physical appearance or habitat preference.

Last summer, my colleagues from Harvard University and the Paris Natural History Museum and I took trains, planes, cars and boats to get to two barely inhabited islands called Pine Cay and Water Cay in Turks and Caicos. There, in contrast to most visitors, we turned our backs on the miles of white sand beaches and headed into the low, dense, scrubby undergrowth to fill those knowledge gaps on this lizard species.

Researcher Anne-Claire Fabre hunts for Anolis scriptus lizards on Pine Cay. Image via Colin Donihue,

After a week of walking, catching, measuring and videotaping, we were ready to leave the island – just as Hurricane Irma was brewing far over the horizon to the south and east. The skies were still blue as we headed to the airport, but you could feel a charge in the air from the thrum of activity as everyone prepared for the storm. Four days after we left the islands, the massive Category 5 eye of Hurricane Irma passed directly over our study sites.

I realized that my team and I had the last look at those lizards before they were hit by the storm, and we might have a unique, serendipitous opportunity to revisit and see if there were any patterns to who survived.

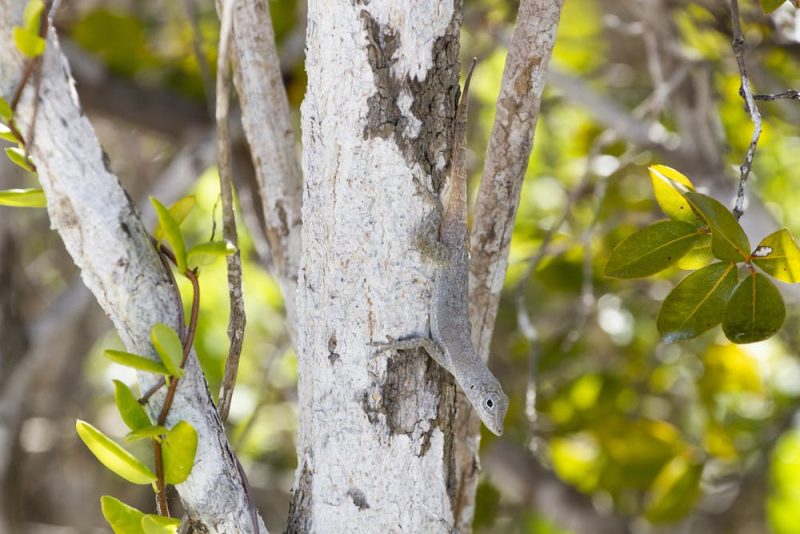
If weathering the hurricanes was a case of survival of the fittest, what features would make these Turks and Caicos anoles most fit? Image via Colin Donihue.

Were some more suited to survive a hurricane?

There are a handful of examples of extreme climate events like droughts, cold spells and heat waves driving evolutionary changes in affected populations.

What about hurricanes? Hurricanes are so severe and fleeting that it seemed entirely possible to us that survival would just be random – there could be no physical attributes of a 3-inch-long lizard that helped them weather the catastrophic storm.

But what if survival was not random and some lizards were better suited to hanging on for their lives? This would mean the hurricanes could be agents of natural selection. In this scenario, we predicted survivors would be those individuals with particularly large adhesive pads on their fingers and toes or extra-long arms and legs – both physical features that would enable them to grab tight to a branch and make it through the storm.

On September 8, 2017, Hurricane Irma directly hit Turks and Caicos (black circle), shown in water vapor satellite maps (from NOAA, www.goes.noaa.gov). Two weeks later, on September 22, Hurricane Maria struck Turks and Caicos. Map data: Google, (c) 2018 DigitalGlobe. Image via Nature and Donihue et al. (For use only with this article).

As we were preparing our revisit, another monstrous hurricane, Maria, hit Turks and Caicos. So it was six weeks and two hurricanes after our initial survey that we returned to Pine Cay and Water Cay to retake the same measurements that we had previously on the surviving lizards.

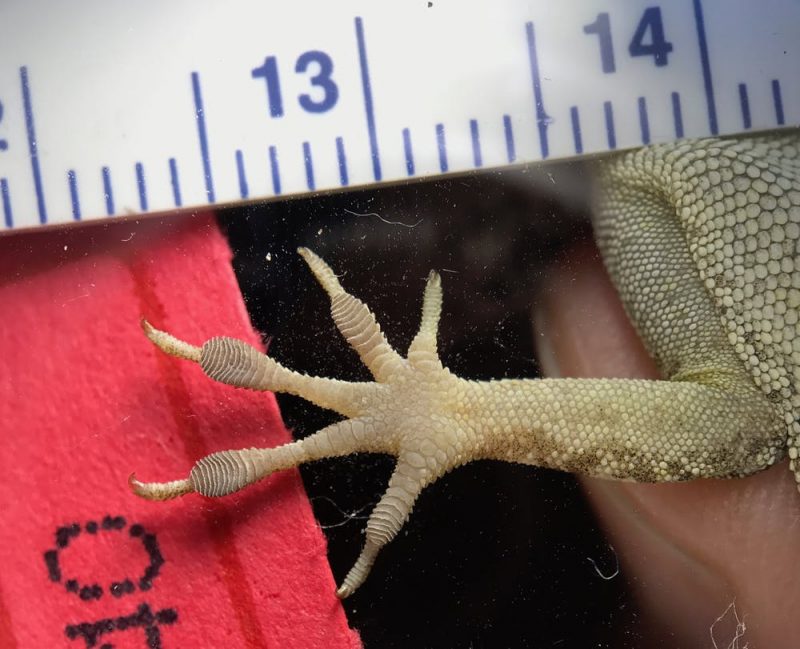
What we found surprised me. Indeed, the surviving populations on both Pine Cay and Water Cay had significantly larger toe pads, on average, than the initial populations had before the hurricanes. We went one step further and used a customized meter to measure the pull of the lizards on a standardized smooth surface and confirmed that large-toepadded animals did have a stronger grip than those animals with smaller toepads.

Toepad surface area predicts the lizard’s clinging strength. Image via Colin Donihue.

We also found that, on average, the surviving lizards had longer arms relative to the lizards we’d measured before the hurricanes.

This pattern was repeated on both islands, suggesting these patterns weren’t flukes – hurricanes can be agents of natural selection.

Contrary to our expectations, though, we found that the back legs of the lizards were shorter on our second visit. This was a head-scratcher for us, as we’d predicted they would be longer among the survivors. So why were stubbier legs an advantage at a time when the lizards were presumably clinging to trees with all their might to avoid being blown away by hurricane winds?

Longer legs more likely to blow away

As we were planning our second visit, we realized we had some basic questions about what the lizards did during the hurricanes. Obviously, no scientists were out there in ponchos following the lizards during the storms. We imagined they’d try to ride things out in tree branches. It was possible they’d head to tree roots but that’s not necessarily a safe strategy. Hurricanes often bring storm surge and deluges of rain that would drown a lizard just as sure as the wind would blow them away.

We decided we needed a way to simulate hurricane force winds in the field. So we bought the strongest leaf blower we could find, packed it in our luggage and – despite some very confused customs agents – set it up in our makeshift laboratory on Pine Cay. We then videotaped about 40 lizards as they clung to a perch while we slowly ramped up the leaf blower wind speed, until they were blown, unharmed, into a safety net.

The researchers recorded lizard behavior in high wind conditions, thanks to an imported leaf blower. Image via Colin Donihue.

What we saw was unexpected: The lizards situated themselves on the perches with their elbows tucked in close to their bodies but their back legs jutting out from either side of the branch. As the wind speed increased, their legs, particularly their thighs, caught wind like a sail, eventually resulting in their hindquarters being blown off the perch. Once half their body was aloft, they soon lost grip altogether. This might be the reason lizards with shorter hind legs survived the hurricanes. Shorter legs mean less surface area to catch the wind like a sail, resulting in all four legs staying in contact with a perch.

The ConversationOur study, recently published in the journal Nature, suggests that hurricanes could change the evolutionary trajectory of these lizard populations. This is an important insight because hurricanes are getting stronger and more frequent due to climate change and so may play an important role for the evolution of many other populations in their path. Our study is the first to indicate that hurricanes may indeed be agents of natural selection. We’re still waiting to see whether future generations of these island lizards – descendants of hurricane survivors – will carry forward the advantageous physical features that were helpful when the 2017 storms hit. My colleagues and I hope to head back to find out very soon.

Colin Donihue, Postdoctoral Fellow in Organismic and Evolutionary Biology, Harvard University

This article was originally published on The Conversation. Read the original article.

Bottom line: Researchers studied how hurricanes Irma and Maria affected island lizards.


from EarthSky https://ift.tt/2O0srLN

Reaching to the stars


from EarthSky https://ift.tt/2KekUXk


from EarthSky https://ift.tt/2KekUXk

Piecing together brain tumour biology to design more effective drugs

In a 6-part series, we’re exploring the major challenges that are holding back progress in the field of brain tumour research. This third instalment focuses on using our knowledge of brain tumour biology to design better drugs.

In labs around the world, scientists are slowly uncovering what makes brain tumours tick. From how they develop to how they evolve and spread, each discovery is an extra piece of the uniquely complex puzzle that is a brain tumour.

But there are still pieces missing. Despite all the research, survival for brain tumours remains devastatingly low. And the way they’re treated has remained largely unchanged for decades.

“The wealth of information we have about brain tumour biology is truly staggering,” says Professor David Walker, a children’s brain tumour expert and chair of the Children’s Brain Tumour Drug Delivery Consortium. “But there are very few real examples where this has transformed the way we treat them.”

This needs to change.

We launched the Cancer Research UK Brain Tumour Awards to encourage experts from all types of research backgrounds to do just that. These call on scientists to tackle the 6 biggest challenges that are holding back progress in brain tumour research.

And the third theme looks to use our understanding of tumour biology to develop better treatments.

Applied biology

We’re learning more and more about how brain tumours develop, and we’ve blogged before about the opportunities this brings.

But this hasn’t yet translated into new treatments. Alongside surgery, the main treatments for brain tumours are still chemotherapy and radiotherapy.

Scientists are looking to design drugs that target tumour’s specific weaknesses. But first they need to know what they are.

“The approach we’ve been using for years has been to read the DNA of tumours, find a disrupted gene and then develop a drug against that target,” says Professor Steve Pollard, a Cancer Research UK-funded expert in stem cell and cancer biology at the University of Edinburgh. “And that has tremendous value for certain types of tumours where there’s very clearly one gene fault that is driving tumour development.”

Pollard thinks that this approach might work for some types of brain tumour, particularly those found in children. He says that work in childhood brain tumours has revealed some key gene faults that fuel the growth of these tumours and could be targeted by drugs.

But for most adult brain tumours, things are a bit more complicated.

Brain tumours are often driven by a combination of many different gene faults. And these vary within a patient’s own tumour, not just between patients.

“That’s a problem, because you can’t then design a drug against one thing and expect it to work,” says Pollard.

Tackling the genetic complexity

Experts say that tackling this level of complexity might require a different approach.

For example, scientists are unpicking how tumour cells might compensate when different gene faults are targeted. They could use this knowledge to combine treatments that could have a bigger impact together than the individual drugs alone.

For Pollard, finding new treatments means worrying less about the genetic differences in brain tumours, and instead focusing on what they have in common.

“Glioblastoma is very diverse in terms of the specific genes that have been disrupted,” he says. But this doesn’t hold true for how these brain tumours behave and their cell biology. “They all look like brain stem cells that are out of control,” adds Pollard.

His lab tests vast numbers of chemicals to identify those that can either kill the tumour cells or stop them dividing, without affecting normal brain cells.

“We look for targets that aren’t necessarily obvious from the genetics of the tumour,” he says.

The goal is to use this approach to find a drug that would work in many adult glioblastomas, despite their genetic diversity.

“We want to think about how we could cure them all, not just the tiny fraction of them that have a specific genetic fault,” says Pollard.

Researchers are also discovering more about the features that brain tumours have in common. This includes how tumours make and use energy, which appears to be surprisingly similar across different types of brain tumours. Identifying these common features could open the door to better treatments.

Considering the environment

As well as focusing on ways to target the tumour, scientists also need to appreciate its surroundings. The brain is a complex and relatively unexplored environment, as we’ve blogged about before.

Understanding this environment could reveal new treatment opportunities. But it also throws up some issues that must be considered when designing new drugs.

The brain is selective about what it lets in. It’s sealed off from the rest of the body by a membrane called the blood brain barrier, which keeps a tight check on anything trying to get into the brain, including drugs.

“With brain tumours, we’ve got the problem of how do we get the enough of the drug into the brain to be effective. It’s a big challenge,” says Walker.

Alongside developing new drugs, scientists are also investigating new ways to get them into the brain. This could involve temporarily disrupting the blood brain barrier while drugs are given, designing transporter systems that can ferry drugs across the barrier, or looking to deliver the drug directly into the brain.

Walker is particularly excited about the direct approach, using specially designed catheters that work through ‘convection drug delivery’. The catheters are inserted into the brain during surgery, allowing drugs to flow directly into the tumour.

“Convection drug delivery has been used in a variety of brain diseases,” he says. “It was developed for Parkinson’s disease, but it’s been adapted so that we can use it in brain tumours.”

It’s being tested in early stage clinical trials for children with an aggressive type of brain tumour that grows in the brain stem. “We have early evidence that using this drug delivery system is producing responses in the area we’re targeting, which we have never seen before with any drug given by any other route,” says Walker. “It’s our duty to test it further in a clinical trial.”

Pollard thinks that, while the blood brain barrier has stopped some drugs from working as well as they could, it might not be a problem for all brain tumours.

“It may be that the blood brain barrier is more of an issue for certain types of brain tumours than others,” he says. “We still don’t know that much about it.”

To learn more, scientists are developing more realistic ways to mimic the blood brain barrier in the lab. They can then learn how to target and manipulate the barrier in more detail.

This is just one example of where scientists need to develop better ways to mimic brain tumours and their surroundingss in the lab. We’ll be exploring this in more detail in the next instalment of the series

Piecing it together

Scientists are making fascinating discoveries about how brain tumours work, which could move us closer to new and better treatments. But getting there will depend on piecing this information together with our knowledge of the healthy brain.

“Cancer in the brain is a double-edged sword. There’s cancer and then there’s the brain. And the brain has many unique qualities that add to the challenge,” says Walker.

To tackle a puzzle as complex as this, we need to bring scientists together too. Walker thinks it’s vital that cancer scientists work alongside specialists who know how the brain develops and functions.

“There needs to be a meeting of minds, a sharing of the load for us to make real progress,” he says.

And that’s exactly what the Cancer Research UK Brain Tumour Awards are here to do.

Katie 


from Cancer Research UK – Science blog https://ift.tt/2KdW6yu

In a 6-part series, we’re exploring the major challenges that are holding back progress in the field of brain tumour research. This third instalment focuses on using our knowledge of brain tumour biology to design better drugs.

In labs around the world, scientists are slowly uncovering what makes brain tumours tick. From how they develop to how they evolve and spread, each discovery is an extra piece of the uniquely complex puzzle that is a brain tumour.

But there are still pieces missing. Despite all the research, survival for brain tumours remains devastatingly low. And the way they’re treated has remained largely unchanged for decades.

“The wealth of information we have about brain tumour biology is truly staggering,” says Professor David Walker, a children’s brain tumour expert and chair of the Children’s Brain Tumour Drug Delivery Consortium. “But there are very few real examples where this has transformed the way we treat them.”

This needs to change.

We launched the Cancer Research UK Brain Tumour Awards to encourage experts from all types of research backgrounds to do just that. These call on scientists to tackle the 6 biggest challenges that are holding back progress in brain tumour research.

And the third theme looks to use our understanding of tumour biology to develop better treatments.

Applied biology

We’re learning more and more about how brain tumours develop, and we’ve blogged before about the opportunities this brings.

But this hasn’t yet translated into new treatments. Alongside surgery, the main treatments for brain tumours are still chemotherapy and radiotherapy.

Scientists are looking to design drugs that target tumour’s specific weaknesses. But first they need to know what they are.

“The approach we’ve been using for years has been to read the DNA of tumours, find a disrupted gene and then develop a drug against that target,” says Professor Steve Pollard, a Cancer Research UK-funded expert in stem cell and cancer biology at the University of Edinburgh. “And that has tremendous value for certain types of tumours where there’s very clearly one gene fault that is driving tumour development.”

Pollard thinks that this approach might work for some types of brain tumour, particularly those found in children. He says that work in childhood brain tumours has revealed some key gene faults that fuel the growth of these tumours and could be targeted by drugs.

But for most adult brain tumours, things are a bit more complicated.

Brain tumours are often driven by a combination of many different gene faults. And these vary within a patient’s own tumour, not just between patients.

“That’s a problem, because you can’t then design a drug against one thing and expect it to work,” says Pollard.

Tackling the genetic complexity

Experts say that tackling this level of complexity might require a different approach.

For example, scientists are unpicking how tumour cells might compensate when different gene faults are targeted. They could use this knowledge to combine treatments that could have a bigger impact together than the individual drugs alone.

For Pollard, finding new treatments means worrying less about the genetic differences in brain tumours, and instead focusing on what they have in common.

“Glioblastoma is very diverse in terms of the specific genes that have been disrupted,” he says. But this doesn’t hold true for how these brain tumours behave and their cell biology. “They all look like brain stem cells that are out of control,” adds Pollard.

His lab tests vast numbers of chemicals to identify those that can either kill the tumour cells or stop them dividing, without affecting normal brain cells.

“We look for targets that aren’t necessarily obvious from the genetics of the tumour,” he says.

The goal is to use this approach to find a drug that would work in many adult glioblastomas, despite their genetic diversity.

“We want to think about how we could cure them all, not just the tiny fraction of them that have a specific genetic fault,” says Pollard.

Researchers are also discovering more about the features that brain tumours have in common. This includes how tumours make and use energy, which appears to be surprisingly similar across different types of brain tumours. Identifying these common features could open the door to better treatments.

Considering the environment

As well as focusing on ways to target the tumour, scientists also need to appreciate its surroundings. The brain is a complex and relatively unexplored environment, as we’ve blogged about before.

Understanding this environment could reveal new treatment opportunities. But it also throws up some issues that must be considered when designing new drugs.

The brain is selective about what it lets in. It’s sealed off from the rest of the body by a membrane called the blood brain barrier, which keeps a tight check on anything trying to get into the brain, including drugs.

“With brain tumours, we’ve got the problem of how do we get the enough of the drug into the brain to be effective. It’s a big challenge,” says Walker.

Alongside developing new drugs, scientists are also investigating new ways to get them into the brain. This could involve temporarily disrupting the blood brain barrier while drugs are given, designing transporter systems that can ferry drugs across the barrier, or looking to deliver the drug directly into the brain.

Walker is particularly excited about the direct approach, using specially designed catheters that work through ‘convection drug delivery’. The catheters are inserted into the brain during surgery, allowing drugs to flow directly into the tumour.

“Convection drug delivery has been used in a variety of brain diseases,” he says. “It was developed for Parkinson’s disease, but it’s been adapted so that we can use it in brain tumours.”

It’s being tested in early stage clinical trials for children with an aggressive type of brain tumour that grows in the brain stem. “We have early evidence that using this drug delivery system is producing responses in the area we’re targeting, which we have never seen before with any drug given by any other route,” says Walker. “It’s our duty to test it further in a clinical trial.”

Pollard thinks that, while the blood brain barrier has stopped some drugs from working as well as they could, it might not be a problem for all brain tumours.

“It may be that the blood brain barrier is more of an issue for certain types of brain tumours than others,” he says. “We still don’t know that much about it.”

To learn more, scientists are developing more realistic ways to mimic the blood brain barrier in the lab. They can then learn how to target and manipulate the barrier in more detail.

This is just one example of where scientists need to develop better ways to mimic brain tumours and their surroundingss in the lab. We’ll be exploring this in more detail in the next instalment of the series

Piecing it together

Scientists are making fascinating discoveries about how brain tumours work, which could move us closer to new and better treatments. But getting there will depend on piecing this information together with our knowledge of the healthy brain.

“Cancer in the brain is a double-edged sword. There’s cancer and then there’s the brain. And the brain has many unique qualities that add to the challenge,” says Walker.

To tackle a puzzle as complex as this, we need to bring scientists together too. Walker thinks it’s vital that cancer scientists work alongside specialists who know how the brain develops and functions.

“There needs to be a meeting of minds, a sharing of the load for us to make real progress,” he says.

And that’s exactly what the Cancer Research UK Brain Tumour Awards are here to do.

Katie 


from Cancer Research UK – Science blog https://ift.tt/2KdW6yu

America spends over $20bn per year on fossil fuel subsidies. Abolish them

Imagine that instead of taxing cigarettes, America subsidized the tobacco industry in order to make each pack of smokes cheaper.

report from Oil Change International (OCI) investigated American energy industry subsidies and found that in 2015–2016, the federal government provided $14.7bn per year to the oil, gas, and coal industries, on top of $5.8bn of state-level incentives (globally, the figure is around $500bn). And the report only accounted for production subsides, excluding consumption subsidies (support to consumers to lower the cost of fossil fuel use – another $14.5bn annually) as well as the costs of carbon and other fossil fuel pollutants.

At a time when we need to transition away from fossil fuels as quickly as possible, the federal and state governments are giving the industry tens of billions of dollars to make the production of their dirty, dangerous products more profitable.

We already have to leave tapped fossil fuels in the ground

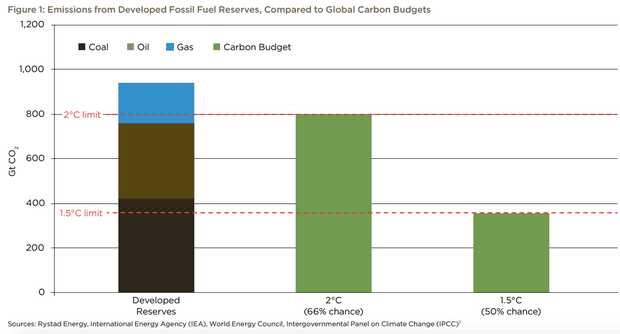
Crucially, the OCI report noted that if we want to meet the Paris target of limiting global warming to less than 2°C (and we do!), not only does the fossil fuel industry have stop developing new reserves, but “some already-tapped reserves must be retired early.”

carbon budgets

 Developed fossil fuel reserves vs. remaining carbon budget to meet 2°C and 1.5°C Paris climate targets. Illustration: Oil Change International

This reality is incompatible with continued US government subsidization of fossil fuel industry production, including $2.5bn per year for the exploration of new fossil fuel resources ­– new resources that simply cannot be developed if we’re to meet the Paris climate target.

To achieve that goal, we instead need to replace fossil fuels with clean energy as quickly as possible. And yet, OCI notes that permanent tax breaks to the US fossil fuel industry are more than seven times larger than those for renewable energy. Some of those fossil fuel subsidies have been around for over a century. And they’re making it profitable for the oil industry to extract resources that would otherwise be left in the ground:

at current prices, the production of nearly half of all U.S. oil is not economically viable, except with federal and state subsidies.

And as David Roberts notes, federal policy is also propping up the coal industry. Were they forced to meet modern pollution standards, 98% of currently operating coal power plants would be unprofitable compared to an equivalent natural gas plant. Coal power plants only stay open through regulations allowing pollution exemptions, and by forcing taxpayers to pick up the climate change bill.

Add another trillion dollars in climate subsidies

Without a price on carbon pollution, Americans are effectively subsidizing the fossil fuel industry for the costs incurred through its products’ climate change damages. For example, think about the added costs to taxpayers for worse wildfires, droughts, hurricanes, and flooding, all amplified by human-caused climate change. In the absence of a price on carbon pollution, the fossil fuel industry doesn’t pay a cent of those costs. Taxpayers pick up the whole tab.

These costs can be estimated via the ‘social cost of carbon.’ It’s a difficult number to pin down, but even at the extremely conservative US federal estimate of $37 per ton of carbon dioxide pollution (some recent research pegs the value at more than five times higher), that’s about $200bn per year for America and $1.3tn globally. While direct government subsidies to the fossil fuel industry are expensive, they’re dwarfed by the costs incurred by failing to tax carbon pollution.

The fossil fuel industry owns the GOP

The OCI report noted that the Obama administration actually proposed to eliminate 60% of federal fossil fuel industry subsidies, but that proposal went nowhere for one obvious reason:

In the 2015-2016 election cycle oil, gas, and coal companies spent $354 million in campaign contributions and lobbying and received $29.4 billion in federal subsidies in total over those same years - an 8,200% return on investment.

Of those fossil fuel industry contributions to political campaigns, 88% went to Republican politicians. As a result, 97% of House Republicans oppose taxing carbon pollution, and the Trump administration is looking into every possible scheme to further prop up the dying coal industry. The GOP might as well rebrand itself as the Grand Oil Party.

Click here to read the rest


from Skeptical Science https://ift.tt/2NVyukx

12 shark facts that might surprise you
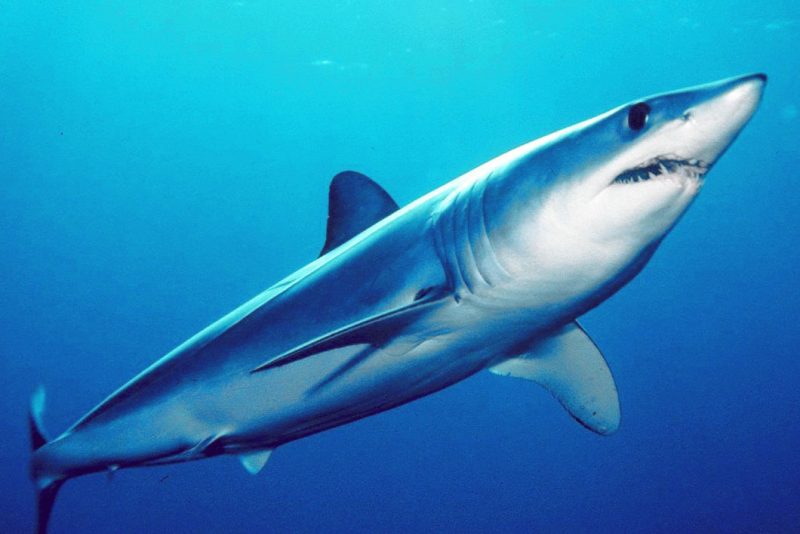
Shortfin mako shark.

Via NOAA Fisheries

1. Sharks don’t have bones.

Sharks use their gills to filter oxygen from the water. They are a special type of fish known as “elasmobranch,” which translates into fish made of cartilaginous tissues – the clear gristly stuff that your ears and nose tip are made of. This category also includes rays, sawfish, and skates. Their cartilaginous skeletons are much lighter than true bone and their large livers are full of low-density oils, both helping them to be buoyant.

Even though sharks don’t have bones, they still can fossilize. As most sharks age, they deposit calcium salts in their skeletal cartilage to strengthen it. The dried jaws of a shark appear and feel heavy and solid; much like bone. These same minerals allow most shark skeletal systems to fossilize quite nicely. The teeth have enamel so they show up in the fossil record too.

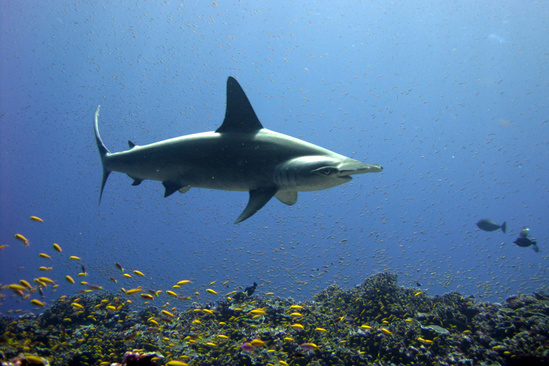
Scalloped hammerhead shark.

2. Most sharks have good eyesight.

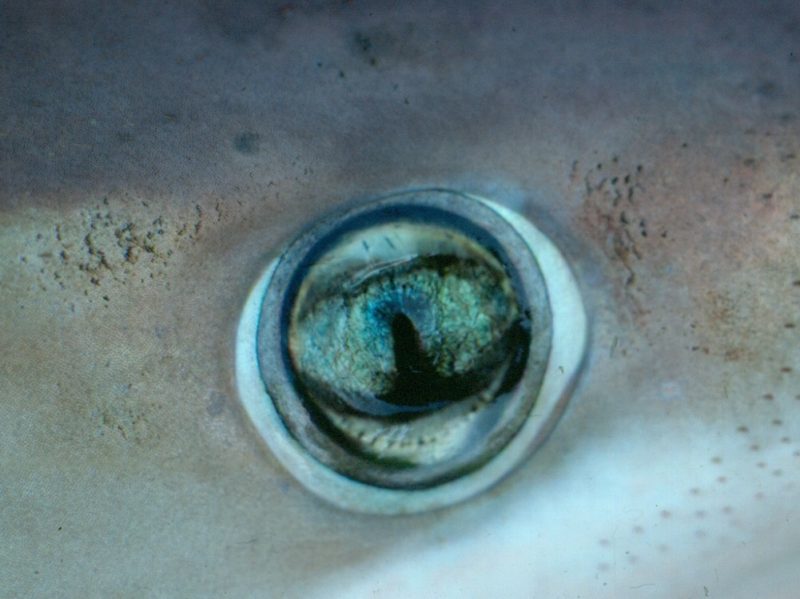
Most sharks can see well in dark lighted areas, have fantastic night vision, and can see colors. The back of sharks’ eyeballs have a reflective layer of tissue called a tapetum. This helps sharks see extremely well with little light.

A night shark’s green eye.

3. Sharks have special electroreceptor organs.

Sharks have small black spots near the nose, eyes, and mouth. These spots are the ampullae of Lorenzini – special electroreceptor organs that allow the shark to sense electromagnetic fields and temperature shifts in the ocean.

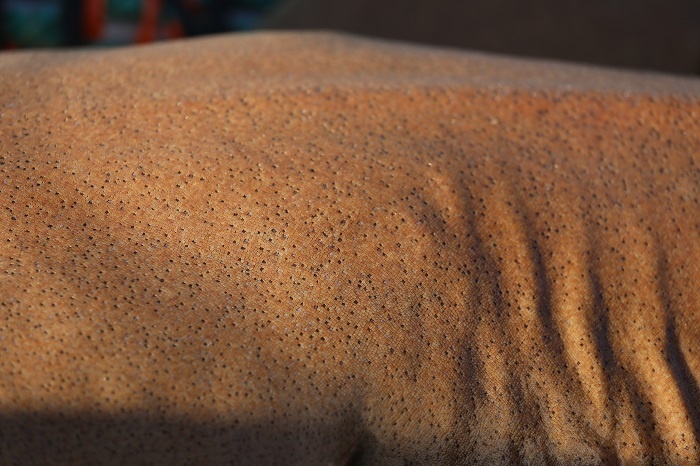
4. Shark skin feels similar to sandpaper.

Shark skin feels exactly like sandpaper because it is made up of tiny teeth-like structures called placoid scales, also known as dermal denticles. These scales point towards the tail and help reduce friction from surrounding water when the shark swims.

Sandbar shark skin.

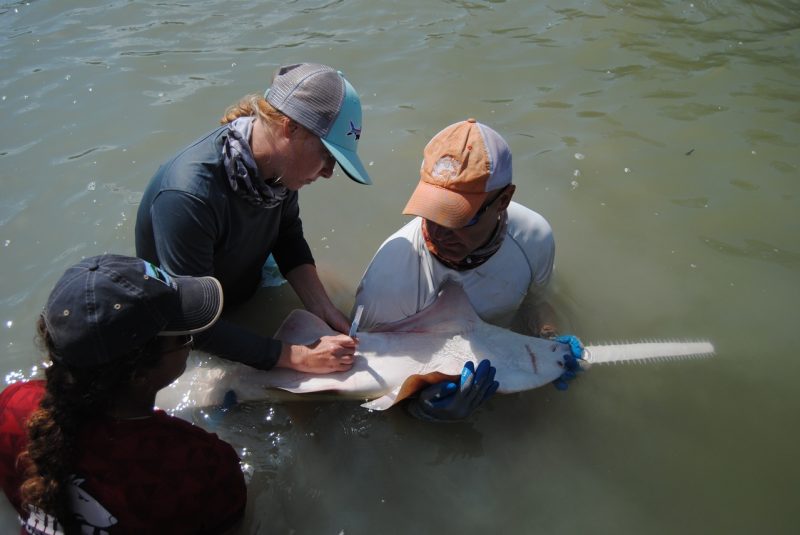
5. Sharks can go into a trance.

When you flip a shark upside down, it goes into a trance-like state called tonic immobility. This is the reason why you often see sawfish flipped over when our scientists are working on them in the water.

Tagging smalltooth sawfish in the Florida Everglades.

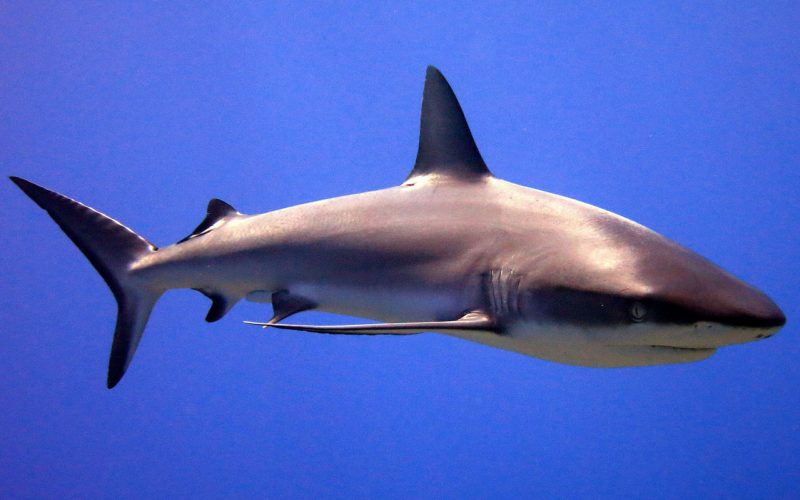
6. Sharks have been around a very long time.

Based on fossil scales found in Australia and the United States, scientists hypothesize sharks first appeared in the ocean around 455 million years ago.

Gray reef shark.

7. Scientists age sharks by counting the rings on their vertebrae.

Vertebrae contain concentric pairs of opaque and translucent bands. Band pairs are counted like rings on a tree and then scientists assign an age to the shark based on the count. Thus, if the vertebra has 10 band pairs, it is assumed to be 10 years old. Recent studies, however, have shown that this assumption is not always correct. Researchers must therefore study each species and size class to determine how often the band pairs are deposited because the deposition rate may change over time. Determining the actual rate that the bands are deposited is called “validation.”

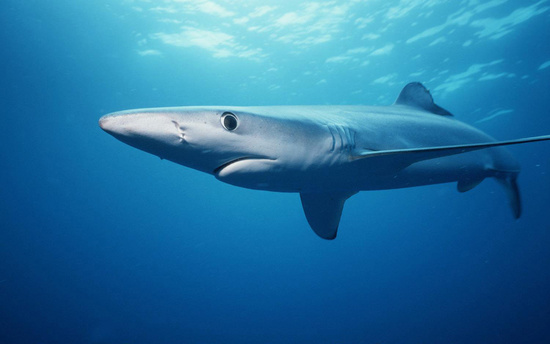
8. Blue sharks are really blue.

The blue shark displays a brilliant blue color on the upper portion of its body and is normally snowy white beneath. The mako and porbeagle sharks also exhibit a blue coloration, but it is not nearly as brilliant as that of a blue shark. In life, most sharks are brown, olive, or grayish.

Blue shark.

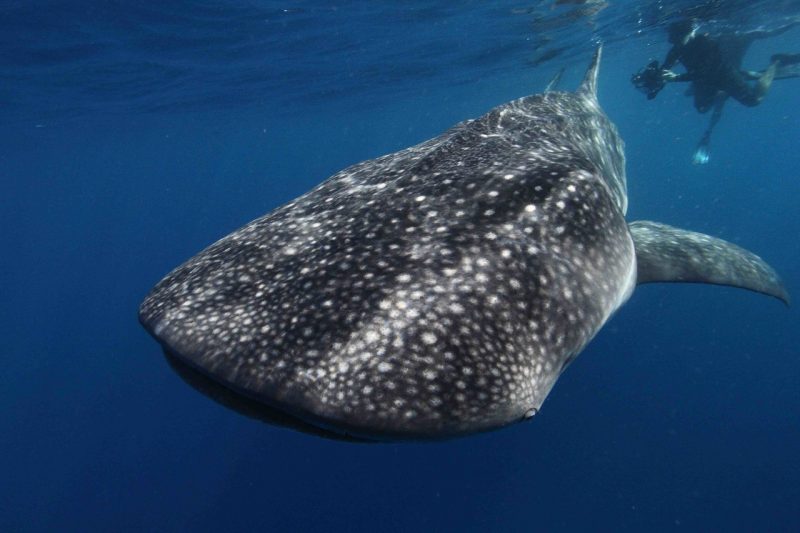
9. Each whale shark’s spot pattern is unique as a fingerprint.

Whale sharks are the biggest fish in the ocean. They can grow to 40 feet (12.2 meters) and weigh as much as 40 tons by some estimates! Basking sharks are the world’s second largest fish, growing as long as 32 feet (9.8 meters) and weighing more than five tons.

Whale shark.

10. Some species of sharks have a spiracle that allows them to pull water into their respiratory system while at rest. Most sharks have to keep swimming to pump water over their gills.

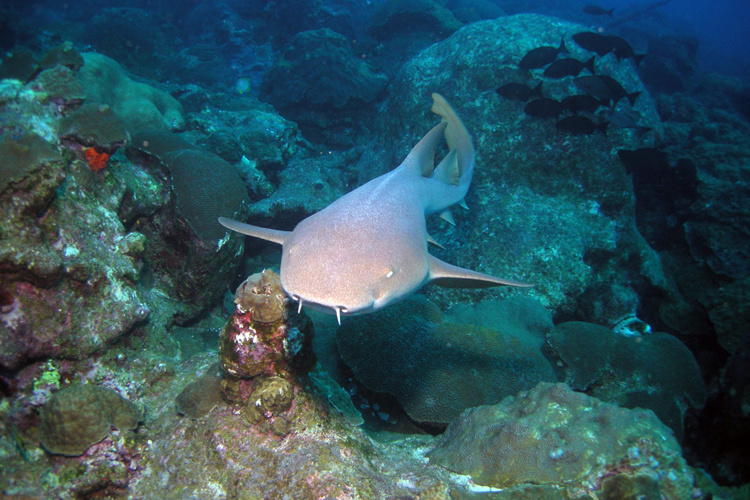
A shark’s spiracle is located just behind the eyes which supplies oxygen directly to the shark’s eyes and brain. Bottom-dwelling sharks, like angel sharks and nurse sharks, use this extra respiratory organ to breathe while at rest on the seafloor. It is also used for respiration when the shark’s mouth is used for eating.

Nurse shark.

11. Not all sharks have the same teeth.

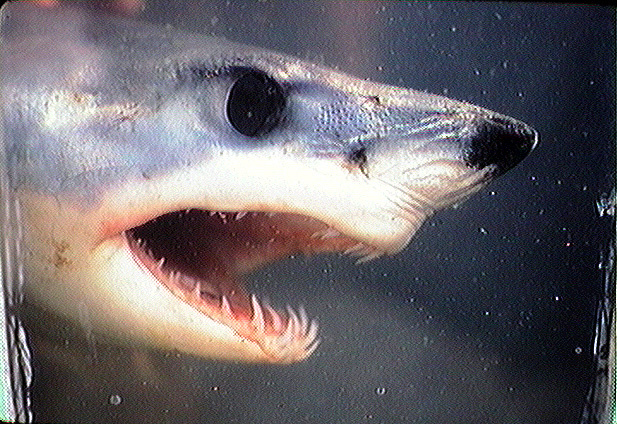
Mako sharks have very pointed teeth, while white sharks have triangular, serrated teeth. Each leave a unique, tell-tale mark on their prey. A sandbar shark will have around 35,000 teeth over the course of its lifetime!

Shortfin mako shark.

12. Different shark species reproduce in different ways.

Sharks exhibit a great diversity in their reproductive modes. There are oviparous (egg-laying) species and viviparous (live-bearing) species. Oviparous species lay eggs that develop and hatch outside the mother’s body with no parental care after the eggs are laid.

Bottom line: A dozen interesting facts about sharks.


from EarthSky https://ift.tt/2KcgVue

Shortfin mako shark.

Via NOAA Fisheries

1. Sharks don’t have bones.

Sharks use their gills to filter oxygen from the water. They are a special type of fish known as “elasmobranch,” which translates into fish made of cartilaginous tissues – the clear gristly stuff that your ears and nose tip are made of. This category also includes rays, sawfish, and skates. Their cartilaginous skeletons are much lighter than true bone and their large livers are full of low-density oils, both helping them to be buoyant.

Even though sharks don’t have bones, they still can fossilize. As most sharks age, they deposit calcium salts in their skeletal cartilage to strengthen it. The dried jaws of a shark appear and feel heavy and solid; much like bone. These same minerals allow most shark skeletal systems to fossilize quite nicely. The teeth have enamel so they show up in the fossil record too.

Scalloped hammerhead shark.

2. Most sharks have good eyesight.

Most sharks can see well in dark lighted areas, have fantastic night vision, and can see colors. The back of sharks’ eyeballs have a reflective layer of tissue called a tapetum. This helps sharks see extremely well with little light.

A night shark’s green eye.

3. Sharks have special electroreceptor organs.

Sharks have small black spots near the nose, eyes, and mouth. These spots are the ampullae of Lorenzini – special electroreceptor organs that allow the shark to sense electromagnetic fields and temperature shifts in the ocean.

4. Shark skin feels similar to sandpaper.

Shark skin feels exactly like sandpaper because it is made up of tiny teeth-like structures called placoid scales, also known as dermal denticles. These scales point towards the tail and help reduce friction from surrounding water when the shark swims.

Sandbar shark skin.

5. Sharks can go into a trance.

When you flip a shark upside down, it goes into a trance-like state called tonic immobility. This is the reason why you often see sawfish flipped over when our scientists are working on them in the water.

Tagging smalltooth sawfish in the Florida Everglades.

6. Sharks have been around a very long time.

Based on fossil scales found in Australia and the United States, scientists hypothesize sharks first appeared in the ocean around 455 million years ago.

Gray reef shark.

7. Scientists age sharks by counting the rings on their vertebrae.

Vertebrae contain concentric pairs of opaque and translucent bands. Band pairs are counted like rings on a tree and then scientists assign an age to the shark based on the count. Thus, if the vertebra has 10 band pairs, it is assumed to be 10 years old. Recent studies, however, have shown that this assumption is not always correct. Researchers must therefore study each species and size class to determine how often the band pairs are deposited because the deposition rate may change over time. Determining the actual rate that the bands are deposited is called “validation.”

8. Blue sharks are really blue.

The blue shark displays a brilliant blue color on the upper portion of its body and is normally snowy white beneath. The mako and porbeagle sharks also exhibit a blue coloration, but it is not nearly as brilliant as that of a blue shark. In life, most sharks are brown, olive, or grayish.

Blue shark.

9. Each whale shark’s spot pattern is unique as a fingerprint.

Whale sharks are the biggest fish in the ocean. They can grow to 40 feet (12.2 meters) and weigh as much as 40 tons by some estimates! Basking sharks are the world’s second largest fish, growing as long as 32 feet (9.8 meters) and weighing more than five tons.

Whale shark.

10. Some species of sharks have a spiracle that allows them to pull water into their respiratory system while at rest. Most sharks have to keep swimming to pump water over their gills.

A shark’s spiracle is located just behind the eyes which supplies oxygen directly to the shark’s eyes and brain. Bottom-dwelling sharks, like angel sharks and nurse sharks, use this extra respiratory organ to breathe while at rest on the seafloor. It is also used for respiration when the shark’s mouth is used for eating.

Nurse shark.

11. Not all sharks have the same teeth.

Mako sharks have very pointed teeth, while white sharks have triangular, serrated teeth. Each leave a unique, tell-tale mark on their prey. A sandbar shark will have around 35,000 teeth over the course of its lifetime!

Shortfin mako shark.

12. Different shark species reproduce in different ways.

Sharks exhibit a great diversity in their reproductive modes. There are oviparous (egg-laying) species and viviparous (live-bearing) species. Oviparous species lay eggs that develop and hatch outside the mother’s body with no parental care after the eggs are laid.

Bottom line: A dozen interesting facts about sharks.


from EarthSky https://ift.tt/2KcgVue

The cycle of close and far Martian oppositions

Mars on July 14, 2018, from Johnnyxbox Childers. You can see Mars easily now. It’s very bright and very red. East each evening, west before dawn.

Mars comes closest to Earth every other year, around the time of its opposition, when Earth is sweeping between the sun and Mars. Mars was at opposition on July 27, 2018, and – at this very favorable opposition – Mars was also be at its brightest since 2003. Yet Mars is closest to us several days after opposition, during the night of July 30 (morning of July 31) according to clocks in North America.

Why are the dates different? Why was Mars brightest then, although it is closest now? And is now a good time to view Mars through a telescope? For the answers to all of those questions, read this post: Mars closest to Earth on July 30-31.

Want to know more about the cycle of close and far Mars oppositions? Keep reading …

Artist’s concept of the Mars opposition, when Earth is sweeping between the sun and Mars, via NASA.

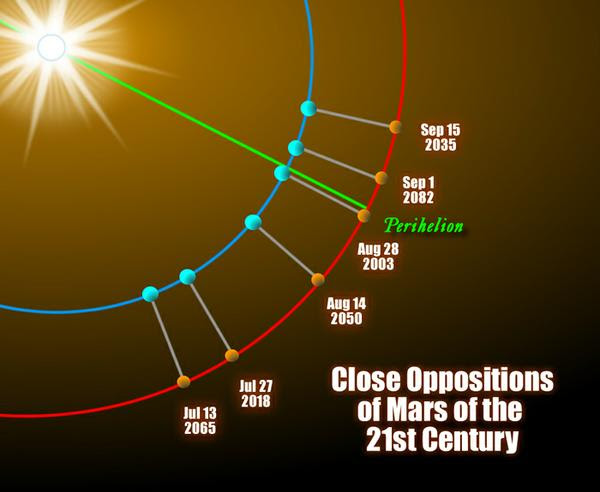
Extra-close oppositions of Mars happen every 15 to 17 years, when we pass between Mars and the sun around the time of its perihelion (closest point to the sun in orbit). Illustration via ClassicalAstronomy.com.

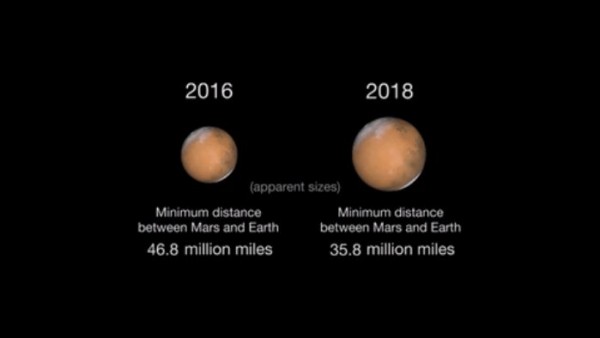
Oppositions of Mars are far from equal, and this one is a good one. At its closest – July 30-31, 2018 – Mars comes to within 35.78 million miles (57.59 million km) of Earth.

Nearly 60,000 years ago – on September 24, 57,617 B.C. – Mars was only 34.62 million miles (55.72 million km) distant. That historic close opposition was closest in living memory, although the opposition of Mars on August 28, 2003 – which brought Mars to 34.65 million miles (55.76 million km) of Earth – was Mars’ closest approach since the Stone Age. The record for closeness set in 2003 won’t be broken again until August 29, 2287.

In contrast, the most recent distant opposition of Mars – on March 3, 2012 – placed the planet at 62.62 million miles (100.78 million km) away.

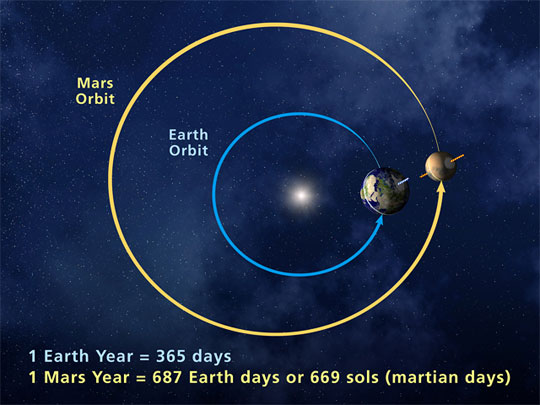
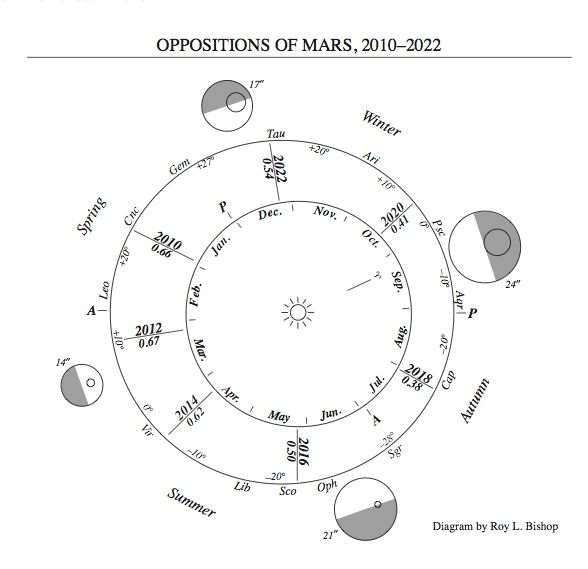
Mars comes closest to Earth about every two years. Earth takes a year to orbit the sun, and Mars takes about two years. So we go between the sun and Mars – bringing Mars closest to us for that two-year period – that often. But Mars is especially close in 2018. The illustration below shows why:

Diagram by Roy L. Bishop. Copyright Royal Astronomical Society of Canada. Used with permission. Visit the RASC estore to purchase the Observers Handbook, a necessary tool for all skywatchers.

This diagram by Roy L. Bishop shows you the separation between Mars and Earth at recent oppositions. The separation of the 2 planets is expressed in astronomical units, or AU (one AU equals one Earth-sun distance) and is indicated beside each of the connecting lines at the various oppositions. Copyright Royal Astronomical Society of Canada. Used with permission. Visit the RASC estore to purchase the Observer’s Handbook, a necessary tool for all skywatchers. Read more about this image.

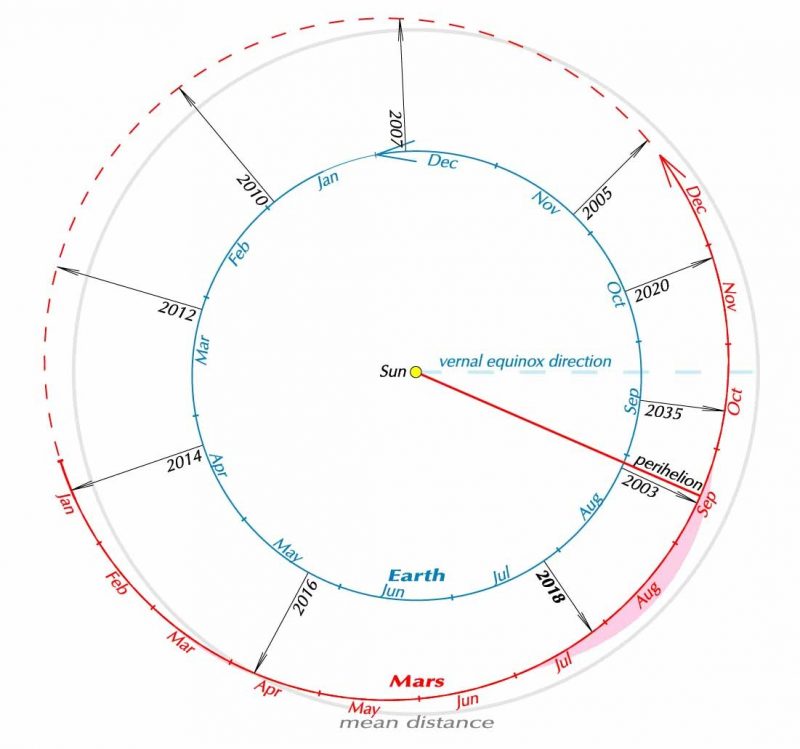
Mars is close in 2018 because its perihelion or closest point to the sun is coming up on September 16, 2018. Earth has a closest and farthest point from the sun, too. We’re closest to the sun every January, and farthest from the sun every July. But the orbit of Earth is very nearly circular, so our distance from the sun doesn’t vary much (only about 3 million miles, or 5 million km). Because Mars’ orbit is more highly elliptical, Mars’ distance from the sun varies more (by about 26 million miles, or 43 million km).

Perhaps you can see that – when Mars is closer to the sun around the time we pass between it and the sun – it’s closer than usual to us.

Astronomers call this year’s opposition of Mars a perihelic opposition. The last one was in 2003.

View larger. | What makes this 2018 Mars opposition special – and the reason Mars is so bright now – is that we go between the sun and Mars around the time Mars is closest to the sun (perihelion). Image via Guy Ottewell.

Close (or distant) oppositions of Mars recur in periods of 15 to 17 years. Note that we’re now 15 years past the historically close encounter on August 28, 2003.

Mars’ next extra-close opposition will be September 15, 2035, though – like the 2018 opposition – it won’t be quite as close as the opposition of August, 2003.

Very similar Martian oppositions take place every 79 years (15 + 17 + 15 + 17 + 15 = 79). These 79-year cycles repeat with only a delay of two to five calendar days. The super-close opposition of Mars in the year 2082 will fall on September 1, 2082. But once again, Earth and Mars won’t come as close as they did in August 2003.

There is a more exact cycle of 284 years (79 + 79 + 79 + 15 + 17 + 15 = 284). The Martian opposition that comes 284 years after August 28, 2003 will fall on August 29, 2287. This time around, Mars will come closer to Earth than it did during its close encounter in August 2003.

So put Mars viewing on your calendar for 2018. Illustration via nasa.tumblr.com.

Look for Mars tonight! It’ll be bright through about early September, 2018. You won’t see Mars this size again until 2035. Illustration via nasa.tumblr.com.

Because the Martian orbit is becoming more eccentric (flatter), the closest oppositions will actually come closer to Earth, and the farthest oppositions will actually become more distant. The computational wizard Jean Meeus figures that from the years 0 to 3000 A.D., Mars will come closest to Earth on September 8, 2729 (55.65 million kilometers) and farthest away on March 6, 2832 (101.50 million kilometers).

Want to know more about close and far Martian oppositions? Click here.

While the time is at hand, enjoy the close appearance of Mars in Earth’s sky during July and August of 2018.

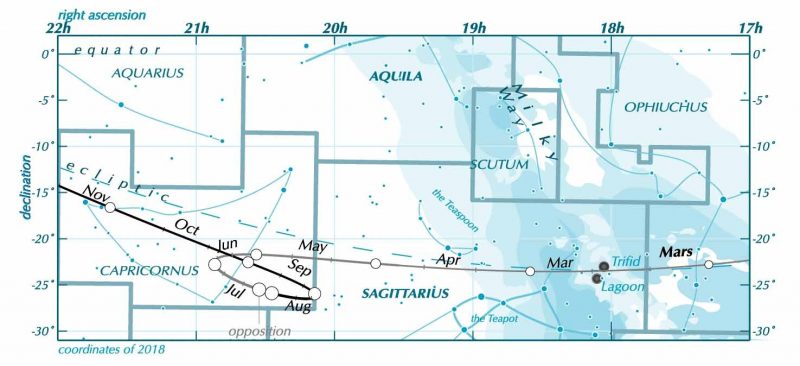
View larger. | Mars’ path across Earth’s sky in 2018, via Guy Ottewell. You can learn to follow the planets in the night sky using EarthSky’s monthly planet guide.

Bottom line: Oppositions of Mars are far from equal. This post explains why Mars has near and far oppositions and shows why the 2018 opposition is a particularly good one.


from EarthSky https://ift.tt/2twixdw