This is a re-post from Carbon Brief by Daisy Dunne
The health of millions of people across the world is already being significantly harmed by climate change, a major new report finds.
From driving up the number of people exposed to heatwaves to increasing the risk of infectious diseases, such as dengue fever, climate change has had far-reaching effects on many aspects of human health in last few decades, the authors say.
In fact, the effect of climate change on human health is now so severe that it should be considered “the major threat of the 21st century”, scientists said at a press briefing held in London.
The report is the first from the Lancet Countdown on Health and Climate Change, a project involving 24 academic institutions and intergovernmental organisations from across the world. The project plans to release a report tracking progress on climate change and global health every year.
Feeling the heat
The report uses a set of 40 indicators to track the effects of climate change on global health. The first of these indicators assesses the “direct impacts” of climate change on human health, including the effects of exposure to extreme heat and natural disasters.
One of the report’s findings is that, from 2000 to 2016, the rise in the average temperatures that humans were exposed to was around three times higher than the rise of average global temperatures worldwide.
This is shown on the graph below, where the rise in the global average surface temperature from 2000 to 2016, when compared to the average from 1986 to 2008 (red), is shown alongside the rise in the temperatures that humans are typically exposed to (blue).
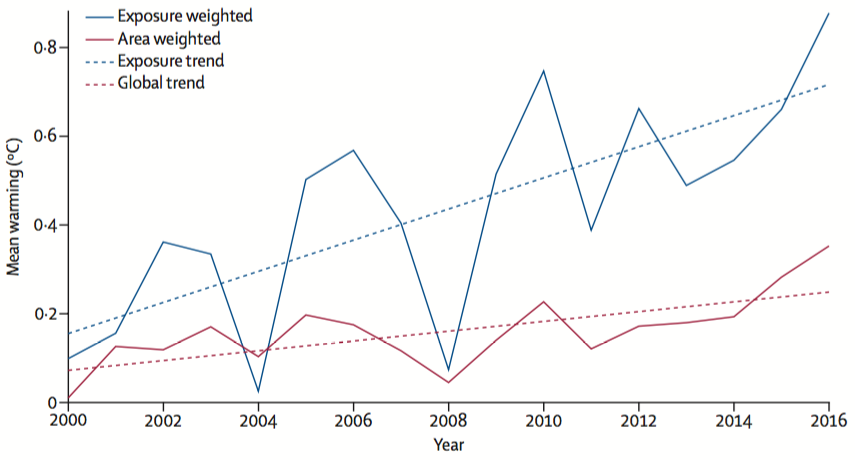
The rise in average global surface temperatures from 2000 to 2016 (red), alongside the rise in the average temperatures that people are exposed to (blue), relative to averages taken from 1986 to 2008. Source: Watts et al. (2017)
The average temperatures that humans are exposed to are significantly higher than the global surface average because most people live on land, where warming happens most quickly, explains Prof Peter Cox, an author of the new report and a climate scientist at the University of Exeter. He tells Carbon Brief:
“Generally speaking, when you look at where people are, the rate of change appears much larger than when we look at global averages. So maybe when we think about global targets, we should be always bearing in mind that the global mean temperature doesn’t really mean much to most people. We don’t live on the ocean, which is two-thirds of the global mean. We live on the land, and on the land that tends to warm fastest.”
The report also finds the number of “vulnerable” people exposed to “heatwave” events increased by around 125 million between 2000 and 2016. “Vulnerable” is here defined as being over the age of 65, while a “heatwave” is defined as three consecutive nights where temperatures are in the top 1% of the 1986-2006 average for the region.
In 2015, a record 175 million more people were exposed to heatwaves, when compared to the average for 1986-2008, the report finds. You can see this in the chart below, which shows the change in the number of people exposed to heatwaves from 2000 to 2016, relative to 1986-2008.
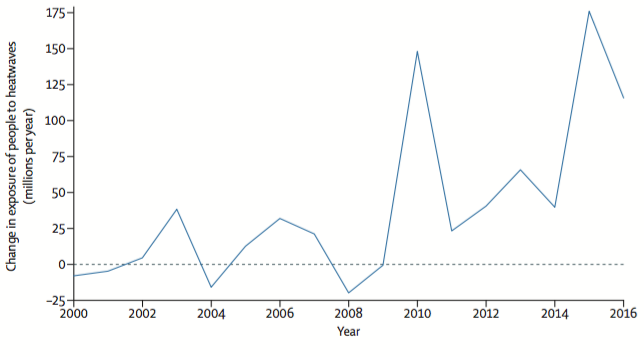
The change in the number of people exposed to heatwaves in millions per year from 2010 to 2016 (blue), relative to the 1986-2008 average. Source: Watts et al. (2017)
These spikes in exposure are a result of an increase in heatwave events, as well as other environmental and social factors, including population growth, Cox says.
Heatwave exposure has previously been linked to an increased risk of premature death in many parts of the world, he explains:
“During the 2003 European heatwave, there were 75,000 extra premature deaths in Europe, including 2,000 in the UK. That was mainly because of people not being able to recover, and I guess breathing gets harder when it’s hot too. There is a correlation between these periods of hot nights and mortality. I suspect there must be a correlation with ill health as well.”
(Carbon Brief has previously reported on the health risks posed by heatwaves.)
Natural disasters
The report finds that the number of weather-related disasters from 2007 to 2016 increased by 46%, when compared with the average for 1990-1999.
Asia is the continent most affected by weather-related disasters, the report says – particularly because of its size and population. Between 1990 and 2016, 2,843 weather-related disasters were recorded in Asia, affecting 4.8 billion people and causing more than 500,000 deaths.
Despite a rise in the number of natural disasters, there has been no discernable rise in the global number of deaths or in the number of people affected by natural disasters, when compared to data from 1990 to 1999, the report finds.
This could indicate that countries are beginning to invest in adaptation strategies to cope with natural disasters, Cox says. However, the mismatch could also reflect a lack of data on deaths from climate-related disasters in the developing world, he adds:
“If you look at what happens when a disaster strikes, if it’s in the rich developed world, it leads to economic damages but we don’t lose people. If it’s in the developing world, then we lose lives.
“It is true that there is a kind of contradiction in that exposure is going up, but actually the number of people affected, at least recorded as affected, is staying flat, which either means we’re building greater resilience [to climate change], which I suspect is not true, or that the data we’re collecting on the amount of money being lost is better than on the amount of people being lost.”
Losses to the global workforce
Another set of indicators explored by the report look at the “human-mediated” impacts of climate change. These are impacts that are intrinsically linked to human society, but often exacerbated by climate change.
The first of these indicators explores how climate change has affected the productivity of the global workforce, particularly in the less economically-developed parts of the world. The report finds that the global productivity in rural labour capacity – defined as those who work in outdoor manual labour in rural areas, but excluding agricultural workers – has fallen by 5.3% from 2000 to 2016.
The chart below shows how this global loss in productivity is spread across the world, with red indicating a percentage loss in productivity and blue showing a percentage gain in labour capacity.
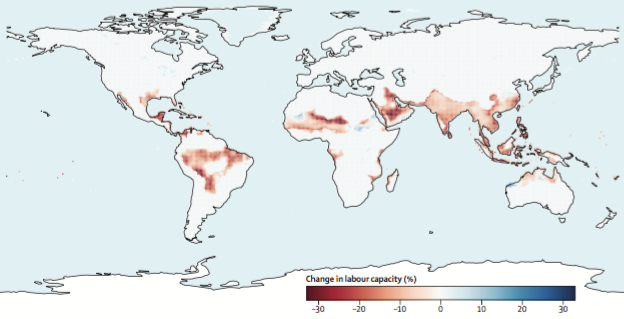
Global changes to labour capacity from 2000 to 2016 as a result of rising global temperatures, relative to average levels from 1986 to 2008. Red shows areas of loss, while blue shows areas of gain. Source: Watts et al. (2017)
In 2016, this drop in productivity effectively took more than 920,000 people globally out of the workforce, the report finds, with 418,000 of these workers being “lost” from India.
One way that higher temperatures threaten labour capacity is by making manual work more physically challenging, the report finds:
“Higher temperatures pose profound threats to occupational health and labour productivity, particularly for people undertaking manual, outdoor labour in hot areas. Loss of labour capacity has important implications for the livelihoods of individuals, families, and communities, especially those relying on subsistence farming.”
An additional “human-mediated” impact of climate change is undernutrition, the report finds. It reports that the number of undernourished people in the top 30 undernourished countries of the world has increased from 398 million in 1990 to 422 million in 2016.
This is at least in part driven by the effect of climate change of yields of staple crops such as wheat, rice and maize, the report says. Climate change affects crop yieldsthrough increasing local temperatures, changes to rainfall patterns and more cases of drought. The report says:
“Increasing temperatures have been shown to reduce global wheat production by 6% for each 1C increase. Rice yields are sensitive to increases in night temperatures, with each 1C increase in growing-season minimum temperature in the dry season resulting in a 10% decrease in rice grain yield. Higher temperatures have been demonstrated rigorously to have a negative impact on crop yields in countries in lower latitudes. Moreover, agriculture in lower latitudes tends to be more marginal, and more people are food insecure.”
Infectious diseases
The report also investigates the “environment-mediated” impacts of climate change. These are impacts on human health that are caused by environmental factors but can be worsened by climate change.
One such impact is the spread of infectious diseases around the globe. Rising temperatures can increase the spread of infectious diseases by allowing pests to conquer new parts of the world, as well as by creating ideal conditions for reproduction and virus replication.
Climate change has affected the prevalence of many infectious diseases, the report notes. However, as an example, the report focuses on how climate change has impacted the spread of dengue fever, a disease spread by mosquitoes native to much of southeast Asia, central and south America, and Africa.
The research shows that the rate of the spread of dengue fever has increased from between 3% and 5.9% globally, when compared to levels from 1990.
The chart below shows how the rate of the spread of dengue fever (vectorial capacity) has increased in the world’s most affected countries from 1950 to 2015. The chart shows results from two species of mosquito, including yellow fever mosquito (Aedes aegypti; left) and Asian tiger mosquito (Aedes albopictus; right).
On the heat map, each block represents one year, with red showing an increase in spread and blue showing a decrease in spread. The chart shows that, since 1995, the vast majority of countries have experienced an increase in the rate of the spread of dengue fever.
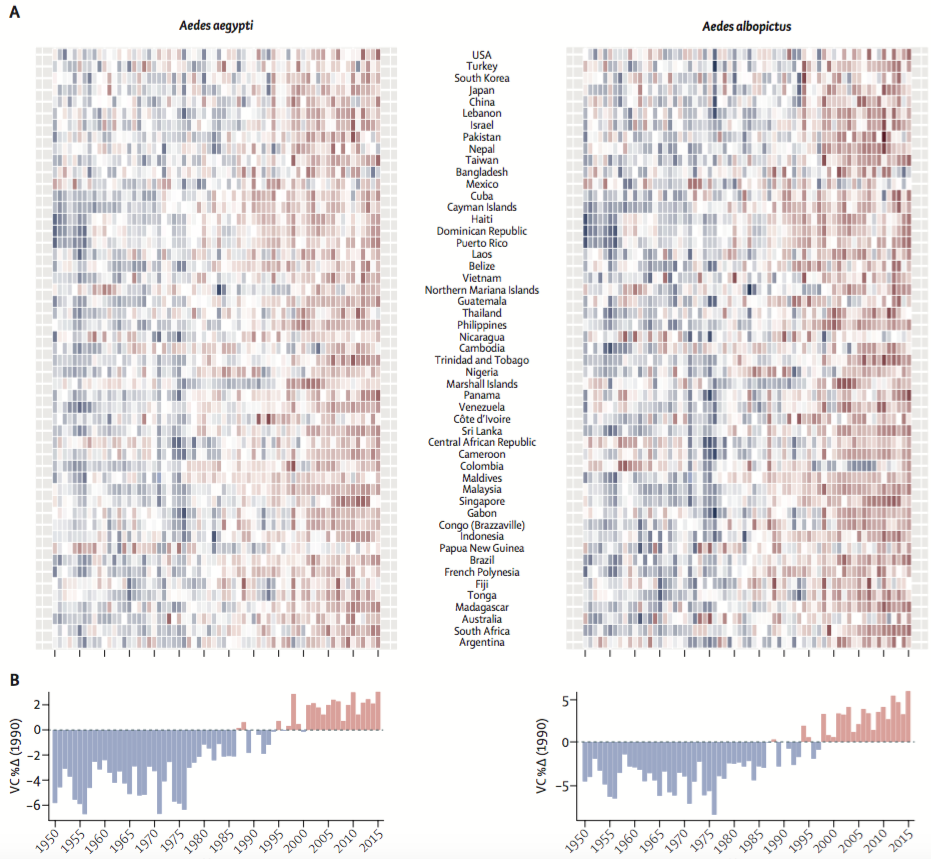
Change in the rate of the spread of dengue fever (vectorial capacity) in the countries most affected by the disease from 1950 to 2015. The chart shows results from two species of mosquito: the yellow fever mosquito (Aedes aegypti; left) and Asian tiger mosquito (Aedes albopictus; right). On the heat map, each block represents one year, with red showing an increase in spread and blue showing a decrease in spread. Source: Watts et al. (2017)
The increase in the rate of the spread of dengue fever could be driven by changes in environmental conditions as a result of climate change, says Prof Hugh Montgomery, co-chair of The Lancet Countdown and a professor at University College London. He told the press conference:
“It’s essentially because of the transmissibility, the ability of the virus to be spread by mosquito vector. As you get areas that get wetter, the mosquito has a habitat it can live in; populations go up as it gets warmer, they breed more frequently, they feed faster. So it gets easier to spread the bug, and that’s really why we’re seeing a doubling in the spread rate of dengue cases.”
Outlook
Looking to the future, the report also explores how climate change could bring new health-related woes, including an increase in the displacement of people as a result of sea level rise.
It is clear that both the current and potential future impacts of climate change on health demand immediate action on tackling fossil fuel use, says Cox, adding that it is not too late to stem some of the effects of climate change on human health. He tells Carbon Brief:
“The co-benefits of action on climate are so huge, I think, well, maybe we present this the wrong way. Rather than saying ‘we should tackle climate change and there’s a co-benefit for health’, it should be ‘we need to do this for our health, and there’s a co-benefit on climate’.”
Montgomery echoed the call for immediate action to tackle climate change for the good of human health. He told the press conference:
“It is too late to avoid impacts, they’re here and if we all die tomorrow and stop producing any CO2, we’re still locked in for a temperature rise. There is a lag between CO2 emissions and the warming that will come. It’s like sticking an extra duvet on, the temperature will slowly rise to a new equilibrium. So we’re locked in for change for a long time to come and those harmful effects we’re seeing already from perhaps little around 1C of temperature rise, we’ve got another half degree as a minimum yet to come.”
However, there are reasons to be hopeful, he adds, pointing to progress on climate action within the last decade, including a shift away from electricity produced from coal and an increase in the investment into electric cars. He adds:
“Climate change can be fixed right now, there isn’t a problem with the technology, it’s readily available and deployable. The money is available for it, the only thing that’s lacking is the political will to connect the money to the infrastructure.”
from Skeptical Science http://ift.tt/2FaJJlq
This is a re-post from Carbon Brief by Daisy Dunne
The health of millions of people across the world is already being significantly harmed by climate change, a major new report finds.
From driving up the number of people exposed to heatwaves to increasing the risk of infectious diseases, such as dengue fever, climate change has had far-reaching effects on many aspects of human health in last few decades, the authors say.
In fact, the effect of climate change on human health is now so severe that it should be considered “the major threat of the 21st century”, scientists said at a press briefing held in London.
The report is the first from the Lancet Countdown on Health and Climate Change, a project involving 24 academic institutions and intergovernmental organisations from across the world. The project plans to release a report tracking progress on climate change and global health every year.
Feeling the heat
The report uses a set of 40 indicators to track the effects of climate change on global health. The first of these indicators assesses the “direct impacts” of climate change on human health, including the effects of exposure to extreme heat and natural disasters.
One of the report’s findings is that, from 2000 to 2016, the rise in the average temperatures that humans were exposed to was around three times higher than the rise of average global temperatures worldwide.
This is shown on the graph below, where the rise in the global average surface temperature from 2000 to 2016, when compared to the average from 1986 to 2008 (red), is shown alongside the rise in the temperatures that humans are typically exposed to (blue).
The rise in average global surface temperatures from 2000 to 2016 (red), alongside the rise in the average temperatures that people are exposed to (blue), relative to averages taken from 1986 to 2008. Source: Watts et al. (2017)
The average temperatures that humans are exposed to are significantly higher than the global surface average because most people live on land, where warming happens most quickly, explains Prof Peter Cox, an author of the new report and a climate scientist at the University of Exeter. He tells Carbon Brief:
“Generally speaking, when you look at where people are, the rate of change appears much larger than when we look at global averages. So maybe when we think about global targets, we should be always bearing in mind that the global mean temperature doesn’t really mean much to most people. We don’t live on the ocean, which is two-thirds of the global mean. We live on the land, and on the land that tends to warm fastest.”
The report also finds the number of “vulnerable” people exposed to “heatwave” events increased by around 125 million between 2000 and 2016. “Vulnerable” is here defined as being over the age of 65, while a “heatwave” is defined as three consecutive nights where temperatures are in the top 1% of the 1986-2006 average for the region.
In 2015, a record 175 million more people were exposed to heatwaves, when compared to the average for 1986-2008, the report finds. You can see this in the chart below, which shows the change in the number of people exposed to heatwaves from 2000 to 2016, relative to 1986-2008.
The change in the number of people exposed to heatwaves in millions per year from 2010 to 2016 (blue), relative to the 1986-2008 average. Source: Watts et al. (2017)
These spikes in exposure are a result of an increase in heatwave events, as well as other environmental and social factors, including population growth, Cox says.
Heatwave exposure has previously been linked to an increased risk of premature death in many parts of the world, he explains:
“During the 2003 European heatwave, there were 75,000 extra premature deaths in Europe, including 2,000 in the UK. That was mainly because of people not being able to recover, and I guess breathing gets harder when it’s hot too. There is a correlation between these periods of hot nights and mortality. I suspect there must be a correlation with ill health as well.”
(Carbon Brief has previously reported on the health risks posed by heatwaves.)
Natural disasters
The report finds that the number of weather-related disasters from 2007 to 2016 increased by 46%, when compared with the average for 1990-1999.
Asia is the continent most affected by weather-related disasters, the report says – particularly because of its size and population. Between 1990 and 2016, 2,843 weather-related disasters were recorded in Asia, affecting 4.8 billion people and causing more than 500,000 deaths.
Despite a rise in the number of natural disasters, there has been no discernable rise in the global number of deaths or in the number of people affected by natural disasters, when compared to data from 1990 to 1999, the report finds.
This could indicate that countries are beginning to invest in adaptation strategies to cope with natural disasters, Cox says. However, the mismatch could also reflect a lack of data on deaths from climate-related disasters in the developing world, he adds:
“If you look at what happens when a disaster strikes, if it’s in the rich developed world, it leads to economic damages but we don’t lose people. If it’s in the developing world, then we lose lives.
“It is true that there is a kind of contradiction in that exposure is going up, but actually the number of people affected, at least recorded as affected, is staying flat, which either means we’re building greater resilience [to climate change], which I suspect is not true, or that the data we’re collecting on the amount of money being lost is better than on the amount of people being lost.”
Losses to the global workforce
Another set of indicators explored by the report look at the “human-mediated” impacts of climate change. These are impacts that are intrinsically linked to human society, but often exacerbated by climate change.
The first of these indicators explores how climate change has affected the productivity of the global workforce, particularly in the less economically-developed parts of the world. The report finds that the global productivity in rural labour capacity – defined as those who work in outdoor manual labour in rural areas, but excluding agricultural workers – has fallen by 5.3% from 2000 to 2016.
The chart below shows how this global loss in productivity is spread across the world, with red indicating a percentage loss in productivity and blue showing a percentage gain in labour capacity.
Global changes to labour capacity from 2000 to 2016 as a result of rising global temperatures, relative to average levels from 1986 to 2008. Red shows areas of loss, while blue shows areas of gain. Source: Watts et al. (2017)
In 2016, this drop in productivity effectively took more than 920,000 people globally out of the workforce, the report finds, with 418,000 of these workers being “lost” from India.
One way that higher temperatures threaten labour capacity is by making manual work more physically challenging, the report finds:
“Higher temperatures pose profound threats to occupational health and labour productivity, particularly for people undertaking manual, outdoor labour in hot areas. Loss of labour capacity has important implications for the livelihoods of individuals, families, and communities, especially those relying on subsistence farming.”
An additional “human-mediated” impact of climate change is undernutrition, the report finds. It reports that the number of undernourished people in the top 30 undernourished countries of the world has increased from 398 million in 1990 to 422 million in 2016.
This is at least in part driven by the effect of climate change of yields of staple crops such as wheat, rice and maize, the report says. Climate change affects crop yieldsthrough increasing local temperatures, changes to rainfall patterns and more cases of drought. The report says:
“Increasing temperatures have been shown to reduce global wheat production by 6% for each 1C increase. Rice yields are sensitive to increases in night temperatures, with each 1C increase in growing-season minimum temperature in the dry season resulting in a 10% decrease in rice grain yield. Higher temperatures have been demonstrated rigorously to have a negative impact on crop yields in countries in lower latitudes. Moreover, agriculture in lower latitudes tends to be more marginal, and more people are food insecure.”
Infectious diseases
The report also investigates the “environment-mediated” impacts of climate change. These are impacts on human health that are caused by environmental factors but can be worsened by climate change.
One such impact is the spread of infectious diseases around the globe. Rising temperatures can increase the spread of infectious diseases by allowing pests to conquer new parts of the world, as well as by creating ideal conditions for reproduction and virus replication.
Climate change has affected the prevalence of many infectious diseases, the report notes. However, as an example, the report focuses on how climate change has impacted the spread of dengue fever, a disease spread by mosquitoes native to much of southeast Asia, central and south America, and Africa.
The research shows that the rate of the spread of dengue fever has increased from between 3% and 5.9% globally, when compared to levels from 1990.
The chart below shows how the rate of the spread of dengue fever (vectorial capacity) has increased in the world’s most affected countries from 1950 to 2015. The chart shows results from two species of mosquito, including yellow fever mosquito (Aedes aegypti; left) and Asian tiger mosquito (Aedes albopictus; right).
On the heat map, each block represents one year, with red showing an increase in spread and blue showing a decrease in spread. The chart shows that, since 1995, the vast majority of countries have experienced an increase in the rate of the spread of dengue fever.
Change in the rate of the spread of dengue fever (vectorial capacity) in the countries most affected by the disease from 1950 to 2015. The chart shows results from two species of mosquito: the yellow fever mosquito (Aedes aegypti; left) and Asian tiger mosquito (Aedes albopictus; right). On the heat map, each block represents one year, with red showing an increase in spread and blue showing a decrease in spread. Source: Watts et al. (2017)
The increase in the rate of the spread of dengue fever could be driven by changes in environmental conditions as a result of climate change, says Prof Hugh Montgomery, co-chair of The Lancet Countdown and a professor at University College London. He told the press conference:
“It’s essentially because of the transmissibility, the ability of the virus to be spread by mosquito vector. As you get areas that get wetter, the mosquito has a habitat it can live in; populations go up as it gets warmer, they breed more frequently, they feed faster. So it gets easier to spread the bug, and that’s really why we’re seeing a doubling in the spread rate of dengue cases.”
Outlook
Looking to the future, the report also explores how climate change could bring new health-related woes, including an increase in the displacement of people as a result of sea level rise.
It is clear that both the current and potential future impacts of climate change on health demand immediate action on tackling fossil fuel use, says Cox, adding that it is not too late to stem some of the effects of climate change on human health. He tells Carbon Brief:
“The co-benefits of action on climate are so huge, I think, well, maybe we present this the wrong way. Rather than saying ‘we should tackle climate change and there’s a co-benefit for health’, it should be ‘we need to do this for our health, and there’s a co-benefit on climate’.”
Montgomery echoed the call for immediate action to tackle climate change for the good of human health. He told the press conference:
“It is too late to avoid impacts, they’re here and if we all die tomorrow and stop producing any CO2, we’re still locked in for a temperature rise. There is a lag between CO2 emissions and the warming that will come. It’s like sticking an extra duvet on, the temperature will slowly rise to a new equilibrium. So we’re locked in for change for a long time to come and those harmful effects we’re seeing already from perhaps little around 1C of temperature rise, we’ve got another half degree as a minimum yet to come.”
However, there are reasons to be hopeful, he adds, pointing to progress on climate action within the last decade, including a shift away from electricity produced from coal and an increase in the investment into electric cars. He adds:
“Climate change can be fixed right now, there isn’t a problem with the technology, it’s readily available and deployable. The money is available for it, the only thing that’s lacking is the political will to connect the money to the infrastructure.”
from Skeptical Science http://ift.tt/2FaJJlq