A selection of new climate related research articles is shown below.
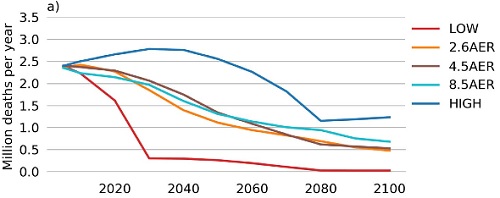 The Figure is from paper #24.
Climate change
1. Climate Change Attribution: When Is It Appropriate to Accept New Methods?
2. Does the projected pathway to global warming targets matter?
3. Isolating the meteorological impact of 21st century GHG warming on the removal and atmospheric loading of anthropogenic fine particulate matter pollution at global scale
4. Assessment of climate change in Algeria from 1951 to 2098 using the Köppen–Geiger climate classification scheme
Temperature and precipitation
5. Warm Arctic−cold Siberia: comparing the recent and the early 20th-century Arctic warmings
6. Projected changes in the Asian-Australian monsoon region in 1.5°C and 2.0°C global-warming scenarios
"There is high confidence in projected increases to mean and extreme surface temperatures over AAMR, as well as more-frequent persistent daily temperature extremes over East Asia, Australia and northern India with an additional 0.5°C warming, which are likely to occur. Mean and extreme monsoon precipitation amplify over AAMR, except over Australia at 1.5°C where there is uncertainty in the sign of the change. Persistent daily extreme precipitation events are likely to become more frequent over parts of East Asia and India with an additional 0.5°C warming. There is lower confidence in projections of precipitation change than in projections of surface temperature change. These results highlight the benefits of limiting the global-mean temperature change to 1.5°C above pre-industrial, as the severity of the above effects increases with an extra 0.5°C warming."
7. Assessment of short- and long-term memory in trends of major climatic variables over Iran: 1966–2015
8. Evidence that global evapotranspiration makes a substantial contribution to the global atmospheric temperature slowdown
9. The effect of elevation bias in interpolated air temperature datasets on surface warming in China during 1951-2015
10. Dynamical Downscaling of Temperature and Precipitation Extremes in China under Current and Future Climates
11. Investigating the Uncertainty in Global SST Trends Due to Internal Variations Using an Improved Trend Estimator
12. Energy transport, polar amplification, and ITCZ shifts in the GeoMIP G1 ensemble
13. Contrasting local and remote impacts of surface heating on polar warming and amplification
14. Emulating mean patterns and variability of temperature across and within scenarios in anthropogenic climate change experiments
15. 300 years of hydrological records and societal responses to droughts and floods on the Pacific coast of Central America
16. Dynamically-downscaled temperature and precipitation changes over Saskatchewan using the PRECIS model
17. Observed changes in extremes of daily rainfall and temperature in Jemma Sub-Basin, Upper Blue Nile Basin, Ethiopia
Climate forcings and feedbacks
18. Comprehensive Assessment of Global Surface Net Radiation Products and Uncertainty Analysis
19. Climate response to negative greenhouse gas radiative forcing in polar winter
"We find, using a fully coupled Earth system model, that the underlying surface warms despite the GHG addition exerting negative ERF and cooling the troposphere in the vicinity of the GHG increase. This unique radiative forcing and thermal response is facilitated by the high stability of the polar winter atmosphere, which inhibits thermal mixing and amplifies the impact of surface radiative forcing on surface temperature. These findings also suggest that strategies to exploit negative ERF via injections of short-lived GHGs into inversion layers would likely be unsuccessful in cooling the planetary surface."
20. Predicting decadal trends in cloud droplet number concentration using reanalysis and satellite data
21. How well can we represent the spectrum of convective clouds in a climate model? Comparisons between internal parameterization variables and radar observations
22. The Radiative Forcing of Aerosol–Cloud Interactions in Liquid Clouds: Wrestling and Embracing Uncertainty
23. Characteristic Atmospheric Radiative Heating Rate Profiles in Arctic Clouds as Observed at Barrow, Alaska
24. Climate and health implications of future aerosol emission scenarios
25. Climate impact of a regional nuclear weapons exchange: An improved assessment based on detailed source calculations
26. Quantifying anthropogenic dust emissions
Cryosphere
27. Explaining CO2 fluctuations observed in snowpacks
28. Irrigation as a potential driver for anomalous glacier behaviour in High Mountain Asia
"Using a regional climate model, in combination with a moisture-tracking model, we show that the increase in irrigation intensity in the lowlands surrounding HMA, particularly in the Tarim basin, can locally counter the effects of global warming on glaciers in Kunlun Shan, and parts of Pamir and northern Tibet, through an increase in summer snowfall and decrease in net radiance. Irrigation can thus affect the regional climate in a way that favours glacier growth, and future projections of glacier melt, which may impact millions of inhabitants surrounding HMA, will need to take into account predicted changes in irrigation intensity."
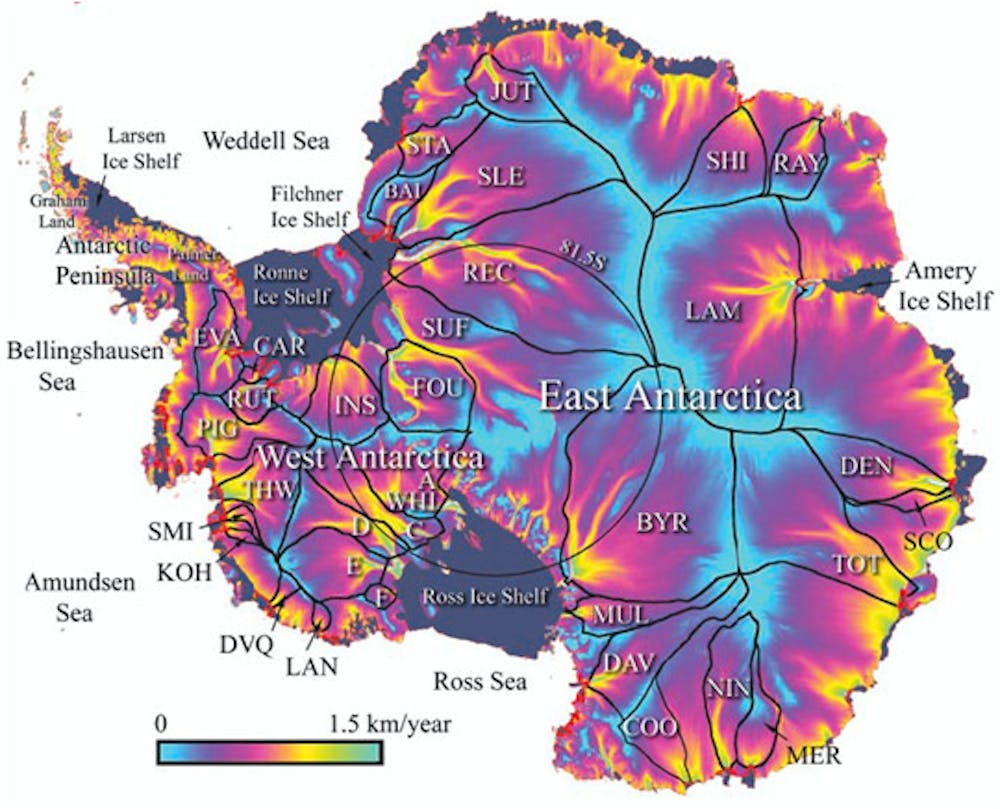
29. Increased West Antarctic and unchanged East Antarctic ice discharge over the last 7 years
"Using an optimized flux gate, ice discharge from Antarctica is 1929 ± 40 Gigatons per year (Gt yr−1) in 2015, an increase of 36 ± 15 Gt yr−1 from the time of the radar mapping. Flow accelerations across the grounding lines of West Antarctica's Amundsen Sea Embayment, Getz Ice Shelf and Marguerite Bay on the western Antarctic Peninsula, account for 88 % of this increase. In contrast, glaciers draining the East Antarctic Ice Sheet have been remarkably constant over the period of observation. Including modeled rates of snow accumulation and basal melt, the Antarctic ice sheet lost ice at an average rate of 183 ± 94 Gt yr−1 between 2008 and 2015. The modest increase in ice discharge over the past 7 years is contrasted by high rates of ice sheet mass loss and distinct spatial patters of elevation lowering. The West Antarctic Ice Sheet is experiencing high rates of mass loss and displays distinct patterns of elevation lowering that point to a dynamic imbalance."
30. Climatology of Hail Frequency and Size in China, 1980–2015
Carbon cycle
31. Greenhouse gas emissions from a semi-arid tropical reservoir in northeastern Brazil
32. Differential response of carbon cycling to long-term nutrient input and altered hydrological conditions in a continental Canadian peatland
33. Carbon and nitrogen pools in thermokarst-affected permafrost landscapes in Arctic Siberia
34. What drives long-term variations in carbon flux and balance in a tropical rainforest in French Guiana?
Extreme events
35. Spatiotemporal characterization of current and future droughts in the High Atlas basins (Morocco)
"These models show a decrease in precipitation towards the future up to − 65% compared to the historical period. In terms of drought events, the future projections indicate a strong increase in the frequency of SPI events below − 2, considered as severe drought condition."
36. Variations in droughts and wet spells and their influences in China: 1924–2013
37. New York City Impacts on a Regional Heat Wave
38. Classifying heatwaves: developing health-based models to predict high-mortality versus moderate United States heatwaves
39. Projected trends in high-mortality heatwaves under different scenarios of climate, population, and adaptation in 82 US communities
40. The importance of aerosol scenarios in projections of future heat extremes
41. Interactions between urban heat islands and heat waves
42. Spatiotemporal analysis of hydro-meteorological drought in the Johor River Basin, Malaysia
Atmospheric and oceanic circulation
43. Does Southern Ocean surface forcing shape the global ocean overturning circulation?
44. Forced decadal changes in the East Asian summer monsoon: the roles of greenhouse gases and anthropogenic aerosols
"Furthermore, the experiments with separate forcings indicate that GHG and AA forcing dominate different parts of the SFND pattern. In particular, changes in GHG increase precipitation over southern China, whilst changes in AA dominate in the drought conditions over northern China. Increases in GHG cause increased moisture transport convergence over eastern China, which leads to increased precipitation. The AA forcing changes weaken the EASM, which lead to divergent wind anomalies over northern China and reduced precipitation."
45. ENSO transition from La Niña to El Niño drives prolonged Spring-Summer drought over North China
Climate change impacts
Mankind
46. Is extreme climate or moderate climate more conducive to longevity in China?
"Results of this study show individuals in northwestern China do not live as long as those in eastern and southern China. A moderate climate is more conducive to longevity than extreme climate in China."
47. Impacts and Uncertainties of +2°C of Climate Change and Soil Degradation on European Crop Calorie Supply
48. Assessing Hazard Vulnerability, Habitat Conservation and Restoration for the Enhancement of China’s Coastal Resilience
49. Climate change research in Bangladesh: research gaps and implications for adaptation-related decision-making
50. Induce or reduce? The crowding-in effects of farmers’ perceptions of climate risk on chemical use in China
51. An EPIC model-based wheat drought risk assessment using new climate scenarios in China
52. Famine relief, public order, and revolts: interaction between government and refugees as a result of drought/flood during 1790–1911 in the North China Plain
53. Understanding Resilience of Pastoralists to Climate Change and Variability in the Southern Afar Region, Ethiopia
54. Perceptions of climate and ocean change impacting the resources and livelihood of small-scale fishers in the South Brazil Bight
55. Multi-model projections of future climate and climate change impacts uncertainty assessment for cotton production in Pakistan
Biosphere
56. Future forest landscapes of the Carpathians: vegetation and carbon dynamics under climate change
57. The persistent decline of patterned woody vegetation: The tiger bush in the context of the regional Sahel greening trend
58. Extreme streams: species persistence and genomic change in montane insect populations across a flooding gradient
59. Relative influence of timing and accumulation of snow on alpine land surface phenology
60. Shifting relative importance of climatic constraints on land surface phenology
61. Arctic moistening provides negative feedbacks to riparian plants
62. Impact of ocean acidification and warming on the productivity of a rock pool community
"Rock pool assemblages are robust to ocean acidification and warming."
63. Ongoing changes in migration phenology and winter residency at Bracken Bat Cave
"Using quantitative radar monitoring, we found that spring migration and the summer reproductive cycle have advanced by approximately 2 weeks over the study period."
64. Environmental and phenotypic heterogeneity of populations at the trailing range-edge of the habitat-forming macroalga Fucus serratus
65. Long-term monitoring of an amphibian community after a climate change- and infectious disease-driven species extirpation
66. Simulated sensitivity of African terrestrial ecosystem photosynthesis to rainfall frequency, intensity, and rainy season length
67. Effects of climate on soil phosphorus cycle and availability in natural terrestrial ecosystems
68. Pan European Phenological database (PEP725): a single point of access for European data
Climate change mitigation
69. Reducing fugitive methane emissions from the North American oil and gas sector: a proposed science-policy framework
70. Entrepreneurial activities in policy implementation: Sweden’s national wind coordinators
71. Estimating rooftop solar technical potential across the US using a combination of GIS-based methods, lidar data, and statistical modeling
"At the national level, 8.13 billion m2 of suitable roof area could host 1118 GW of PV capacity, generating 1432 TWh of electricity per year. This would equate to 38.6% of the electricity that was sold in the contiguous United States in 2013."
72. Defining transformative climate science to address high-end climate change
73. Take Action Now: Motivational Framing and Action Requests in Climate Advocacy
74. The effect of providing climate and health information on support for alternative electricity portfolios
75. Context matters: Context-related drivers of and barriers to climate information use
76. Ecologically unequal exchange and the carbon intensity of well-being, 1990–2011
77. The impacts of information and communication technology, energy consumption, financial development, and economic growth on carbon dioxide emissions in 12 Asian countries
78. Impact assessment of climate policy on Poland's power sector
79. The cost of achieving South Africa’s ‘fair share’ of global climate change mitigation
80. Cover crops mitigate direct greenhouse gases balance but reduce drainage under climate change scenarios in temperate climate with dry summers
81. Some factors that would affect the retail price for 100% Australian renewable electricity
82. Public perception of energy transition in Korea: Nuclear power, climate change, and party preference
83. Addressing COP21 using a stock and oil market integration index
84. Landscape-scale wildlife species richness metrics to inform wind and solar energy facility siting: An Arizona case study
Other papers
85. Total ozone trends from 1979 to 2016 derived from five merged observational datasets – the emergence into ozone recovery
"This paper commemorates the 30-year anniversary of the initial signing of the Montreal Protocol (MP) on substances that deplete the ozone layer. The MP is so far successful in reducing ozone-depleting substances, and total ozone decline was successfully stopped by the late 1990s. Total ozone levels have been mostly stable since then. In some regions, barely significant upward trends are observed that suggest an emergence into the expected ozone recovery phase."
86. Holocene lowering of the Laurentide ice sheet affects North Atlantic gyre circulation and climate
"The climatic effects of the Laurentide ice sheet lowering during the Holocene are restricted to the North Atlantic sector. Thus, topographic forcing is unlikely to have played a major role in the 8.2 ka event and had only a small effect on Holocene climate change compared to the effects of changes in greenhouse gases, insolation and ice sheet meltwater."
87. Deviations of treeline Norway spruce radial growth from summer temperatures in East-Central Europe
88. Euro-Atlantic atmospheric circulation during the Late Maunder Minimum
from Skeptical Science http://ift.tt/2FpVyVr
A selection of new climate related research articles is shown below.
The Figure is from paper #24.
Climate change
1. Climate Change Attribution: When Is It Appropriate to Accept New Methods?
2. Does the projected pathway to global warming targets matter?
3. Isolating the meteorological impact of 21st century GHG warming on the removal and atmospheric loading of anthropogenic fine particulate matter pollution at global scale
4. Assessment of climate change in Algeria from 1951 to 2098 using the Köppen–Geiger climate classification scheme
Temperature and precipitation
5. Warm Arctic−cold Siberia: comparing the recent and the early 20th-century Arctic warmings
6. Projected changes in the Asian-Australian monsoon region in 1.5°C and 2.0°C global-warming scenarios
"There is high confidence in projected increases to mean and extreme surface temperatures over AAMR, as well as more-frequent persistent daily temperature extremes over East Asia, Australia and northern India with an additional 0.5°C warming, which are likely to occur. Mean and extreme monsoon precipitation amplify over AAMR, except over Australia at 1.5°C where there is uncertainty in the sign of the change. Persistent daily extreme precipitation events are likely to become more frequent over parts of East Asia and India with an additional 0.5°C warming. There is lower confidence in projections of precipitation change than in projections of surface temperature change. These results highlight the benefits of limiting the global-mean temperature change to 1.5°C above pre-industrial, as the severity of the above effects increases with an extra 0.5°C warming."
7. Assessment of short- and long-term memory in trends of major climatic variables over Iran: 1966–2015
8. Evidence that global evapotranspiration makes a substantial contribution to the global atmospheric temperature slowdown
9. The effect of elevation bias in interpolated air temperature datasets on surface warming in China during 1951-2015
10. Dynamical Downscaling of Temperature and Precipitation Extremes in China under Current and Future Climates
11. Investigating the Uncertainty in Global SST Trends Due to Internal Variations Using an Improved Trend Estimator
12. Energy transport, polar amplification, and ITCZ shifts in the GeoMIP G1 ensemble
13. Contrasting local and remote impacts of surface heating on polar warming and amplification
14. Emulating mean patterns and variability of temperature across and within scenarios in anthropogenic climate change experiments
15. 300 years of hydrological records and societal responses to droughts and floods on the Pacific coast of Central America
16. Dynamically-downscaled temperature and precipitation changes over Saskatchewan using the PRECIS model
17. Observed changes in extremes of daily rainfall and temperature in Jemma Sub-Basin, Upper Blue Nile Basin, Ethiopia
Climate forcings and feedbacks
18. Comprehensive Assessment of Global Surface Net Radiation Products and Uncertainty Analysis
19. Climate response to negative greenhouse gas radiative forcing in polar winter
"We find, using a fully coupled Earth system model, that the underlying surface warms despite the GHG addition exerting negative ERF and cooling the troposphere in the vicinity of the GHG increase. This unique radiative forcing and thermal response is facilitated by the high stability of the polar winter atmosphere, which inhibits thermal mixing and amplifies the impact of surface radiative forcing on surface temperature. These findings also suggest that strategies to exploit negative ERF via injections of short-lived GHGs into inversion layers would likely be unsuccessful in cooling the planetary surface."
20. Predicting decadal trends in cloud droplet number concentration using reanalysis and satellite data
21. How well can we represent the spectrum of convective clouds in a climate model? Comparisons between internal parameterization variables and radar observations
22. The Radiative Forcing of Aerosol–Cloud Interactions in Liquid Clouds: Wrestling and Embracing Uncertainty
23. Characteristic Atmospheric Radiative Heating Rate Profiles in Arctic Clouds as Observed at Barrow, Alaska
24. Climate and health implications of future aerosol emission scenarios
25. Climate impact of a regional nuclear weapons exchange: An improved assessment based on detailed source calculations
26. Quantifying anthropogenic dust emissions
Cryosphere
27. Explaining CO2 fluctuations observed in snowpacks
28. Irrigation as a potential driver for anomalous glacier behaviour in High Mountain Asia
"Using a regional climate model, in combination with a moisture-tracking model, we show that the increase in irrigation intensity in the lowlands surrounding HMA, particularly in the Tarim basin, can locally counter the effects of global warming on glaciers in Kunlun Shan, and parts of Pamir and northern Tibet, through an increase in summer snowfall and decrease in net radiance. Irrigation can thus affect the regional climate in a way that favours glacier growth, and future projections of glacier melt, which may impact millions of inhabitants surrounding HMA, will need to take into account predicted changes in irrigation intensity."
29. Increased West Antarctic and unchanged East Antarctic ice discharge over the last 7 years
"Using an optimized flux gate, ice discharge from Antarctica is 1929 ± 40 Gigatons per year (Gt yr−1) in 2015, an increase of 36 ± 15 Gt yr−1 from the time of the radar mapping. Flow accelerations across the grounding lines of West Antarctica's Amundsen Sea Embayment, Getz Ice Shelf and Marguerite Bay on the western Antarctic Peninsula, account for 88 % of this increase. In contrast, glaciers draining the East Antarctic Ice Sheet have been remarkably constant over the period of observation. Including modeled rates of snow accumulation and basal melt, the Antarctic ice sheet lost ice at an average rate of 183 ± 94 Gt yr−1 between 2008 and 2015. The modest increase in ice discharge over the past 7 years is contrasted by high rates of ice sheet mass loss and distinct spatial patters of elevation lowering. The West Antarctic Ice Sheet is experiencing high rates of mass loss and displays distinct patterns of elevation lowering that point to a dynamic imbalance."
30. Climatology of Hail Frequency and Size in China, 1980–2015
Carbon cycle
31. Greenhouse gas emissions from a semi-arid tropical reservoir in northeastern Brazil
32. Differential response of carbon cycling to long-term nutrient input and altered hydrological conditions in a continental Canadian peatland
33. Carbon and nitrogen pools in thermokarst-affected permafrost landscapes in Arctic Siberia
34. What drives long-term variations in carbon flux and balance in a tropical rainforest in French Guiana?
Extreme events
35. Spatiotemporal characterization of current and future droughts in the High Atlas basins (Morocco)
"These models show a decrease in precipitation towards the future up to − 65% compared to the historical period. In terms of drought events, the future projections indicate a strong increase in the frequency of SPI events below − 2, considered as severe drought condition."
36. Variations in droughts and wet spells and their influences in China: 1924–2013
37. New York City Impacts on a Regional Heat Wave
38. Classifying heatwaves: developing health-based models to predict high-mortality versus moderate United States heatwaves
39. Projected trends in high-mortality heatwaves under different scenarios of climate, population, and adaptation in 82 US communities
40. The importance of aerosol scenarios in projections of future heat extremes
41. Interactions between urban heat islands and heat waves
42. Spatiotemporal analysis of hydro-meteorological drought in the Johor River Basin, Malaysia
Atmospheric and oceanic circulation
43. Does Southern Ocean surface forcing shape the global ocean overturning circulation?
44. Forced decadal changes in the East Asian summer monsoon: the roles of greenhouse gases and anthropogenic aerosols
"Furthermore, the experiments with separate forcings indicate that GHG and AA forcing dominate different parts of the SFND pattern. In particular, changes in GHG increase precipitation over southern China, whilst changes in AA dominate in the drought conditions over northern China. Increases in GHG cause increased moisture transport convergence over eastern China, which leads to increased precipitation. The AA forcing changes weaken the EASM, which lead to divergent wind anomalies over northern China and reduced precipitation."
45. ENSO transition from La Niña to El Niño drives prolonged Spring-Summer drought over North China
Climate change impacts
Mankind
46. Is extreme climate or moderate climate more conducive to longevity in China?
"Results of this study show individuals in northwestern China do not live as long as those in eastern and southern China. A moderate climate is more conducive to longevity than extreme climate in China."
47. Impacts and Uncertainties of +2°C of Climate Change and Soil Degradation on European Crop Calorie Supply
48. Assessing Hazard Vulnerability, Habitat Conservation and Restoration for the Enhancement of China’s Coastal Resilience
49. Climate change research in Bangladesh: research gaps and implications for adaptation-related decision-making
50. Induce or reduce? The crowding-in effects of farmers’ perceptions of climate risk on chemical use in China
51. An EPIC model-based wheat drought risk assessment using new climate scenarios in China
52. Famine relief, public order, and revolts: interaction between government and refugees as a result of drought/flood during 1790–1911 in the North China Plain
53. Understanding Resilience of Pastoralists to Climate Change and Variability in the Southern Afar Region, Ethiopia
54. Perceptions of climate and ocean change impacting the resources and livelihood of small-scale fishers in the South Brazil Bight
55. Multi-model projections of future climate and climate change impacts uncertainty assessment for cotton production in Pakistan
Biosphere
56. Future forest landscapes of the Carpathians: vegetation and carbon dynamics under climate change
57. The persistent decline of patterned woody vegetation: The tiger bush in the context of the regional Sahel greening trend
58. Extreme streams: species persistence and genomic change in montane insect populations across a flooding gradient
59. Relative influence of timing and accumulation of snow on alpine land surface phenology
60. Shifting relative importance of climatic constraints on land surface phenology
61. Arctic moistening provides negative feedbacks to riparian plants
62. Impact of ocean acidification and warming on the productivity of a rock pool community
"Rock pool assemblages are robust to ocean acidification and warming."
63. Ongoing changes in migration phenology and winter residency at Bracken Bat Cave
"Using quantitative radar monitoring, we found that spring migration and the summer reproductive cycle have advanced by approximately 2 weeks over the study period."
64. Environmental and phenotypic heterogeneity of populations at the trailing range-edge of the habitat-forming macroalga Fucus serratus
65. Long-term monitoring of an amphibian community after a climate change- and infectious disease-driven species extirpation
66. Simulated sensitivity of African terrestrial ecosystem photosynthesis to rainfall frequency, intensity, and rainy season length
67. Effects of climate on soil phosphorus cycle and availability in natural terrestrial ecosystems
68. Pan European Phenological database (PEP725): a single point of access for European data
Climate change mitigation
69. Reducing fugitive methane emissions from the North American oil and gas sector: a proposed science-policy framework
70. Entrepreneurial activities in policy implementation: Sweden’s national wind coordinators
71. Estimating rooftop solar technical potential across the US using a combination of GIS-based methods, lidar data, and statistical modeling
"At the national level, 8.13 billion m2 of suitable roof area could host 1118 GW of PV capacity, generating 1432 TWh of electricity per year. This would equate to 38.6% of the electricity that was sold in the contiguous United States in 2013."
72. Defining transformative climate science to address high-end climate change
73. Take Action Now: Motivational Framing and Action Requests in Climate Advocacy
74. The effect of providing climate and health information on support for alternative electricity portfolios
75. Context matters: Context-related drivers of and barriers to climate information use
76. Ecologically unequal exchange and the carbon intensity of well-being, 1990–2011
77. The impacts of information and communication technology, energy consumption, financial development, and economic growth on carbon dioxide emissions in 12 Asian countries
78. Impact assessment of climate policy on Poland's power sector
79. The cost of achieving South Africa’s ‘fair share’ of global climate change mitigation
80. Cover crops mitigate direct greenhouse gases balance but reduce drainage under climate change scenarios in temperate climate with dry summers
81. Some factors that would affect the retail price for 100% Australian renewable electricity
82. Public perception of energy transition in Korea: Nuclear power, climate change, and party preference
83. Addressing COP21 using a stock and oil market integration index
84. Landscape-scale wildlife species richness metrics to inform wind and solar energy facility siting: An Arizona case study
Other papers
85. Total ozone trends from 1979 to 2016 derived from five merged observational datasets – the emergence into ozone recovery
"This paper commemorates the 30-year anniversary of the initial signing of the Montreal Protocol (MP) on substances that deplete the ozone layer. The MP is so far successful in reducing ozone-depleting substances, and total ozone decline was successfully stopped by the late 1990s. Total ozone levels have been mostly stable since then. In some regions, barely significant upward trends are observed that suggest an emergence into the expected ozone recovery phase."
86. Holocene lowering of the Laurentide ice sheet affects North Atlantic gyre circulation and climate
"The climatic effects of the Laurentide ice sheet lowering during the Holocene are restricted to the North Atlantic sector. Thus, topographic forcing is unlikely to have played a major role in the 8.2 ka event and had only a small effect on Holocene climate change compared to the effects of changes in greenhouse gases, insolation and ice sheet meltwater."
87. Deviations of treeline Norway spruce radial growth from summer temperatures in East-Central Europe
88. Euro-Atlantic atmospheric circulation during the Late Maunder Minimum
from Skeptical Science http://ift.tt/2FpVyVr


