A selection of new climate related research articles is shown below.
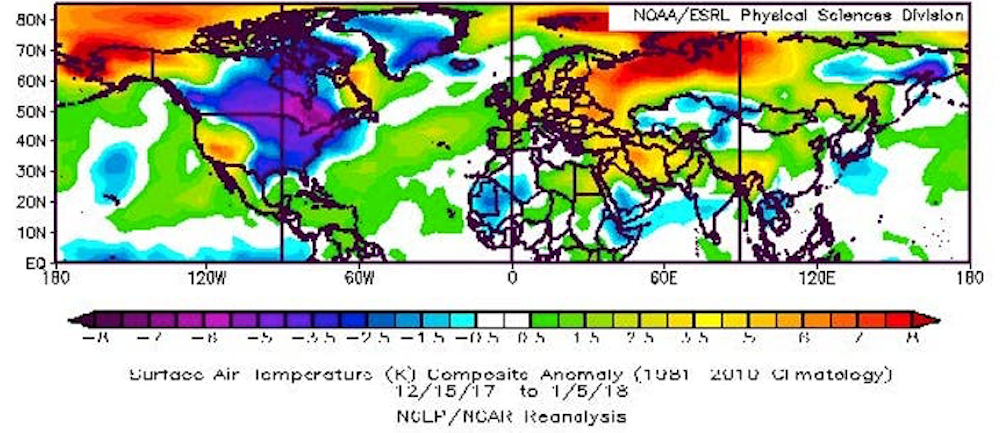
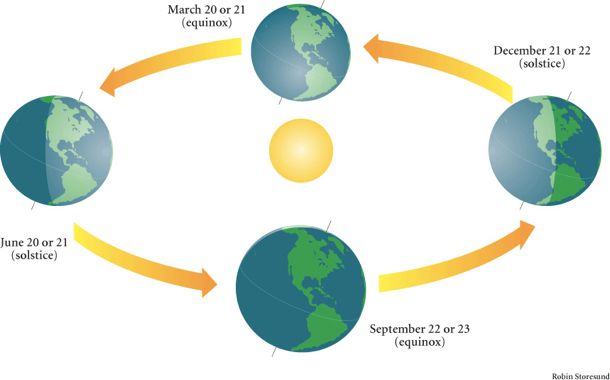
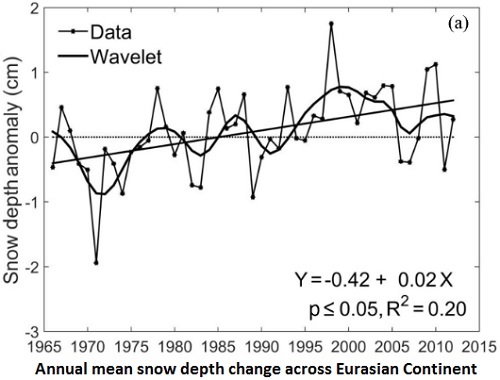 The figure is from paper #30.
Climate change
1. Whole Atmosphere Simulation of Anthropogenic Climate Change
"The basic result was that even as the lower atmosphere gradually warms, the upper atmosphere rapidly cools. The simulations employed constant low solar activity conditions, to remove the effects of variable solar and geomagnetic activity. Global mean annual mean temperature increased at a rate of +0.2 K/decade at the surface and +0.4 K/decade in the upper troposphere, but decreased by about -1 K/decade in the stratosphere-mesosphere, and -2.8 K/decade in the thermosphere. Near the mesopause, temperature decreases were small compared to the interannual variation, so trends in that region are uncertain."
2. Towards the Application of Decadal Climate Predictions
3. Downscaling future climate change projections over Puerto Rico using a non-hydrostatic atmospheric model
4. High-Resolution Historical Climate Simulations over Alaska
Temperature, Precipitation, and Wind
5. Trend in the co-occurrence of extreme daily rainfall in West Africa since 1950
6. Climate change impacts on rainfall and temperature in sugarcane growing Upper Gangetic Plains of India
7. Do SST gradients drive the monthly climatological surface wind convergence over the tropical Atlantic?
8. Global, Regional, and Megacity Trends in the Highest Temperature of the Year: Diagnostics and Evidence for Accelerating Trends
"A global increase of 0.19°C per decade during the past 50 years (through 2015) accelerated to 0.25°C per decade during the last 30 years, a faster increase than in the mean annual temperature. Strong positive 30-year trends are detected in large regions of Eurasia and Australia with rates higher than 0.60°C per decade. In cities with more than 5 million inhabitants, where most heat-related fatalities occur, the average change is 0.33°C per decade, while some east Asia cities, Paris, Moscow, and Houston have experienced changes higher than 0.60°C per decade."
9. Temperature and Precipitation trends in Kashmir valley, North Western Himalayas
10. Towards predicting changes in the land monsoon rainfall a decade in advance
11. A new assessment in total and extreme rainfall trends over central and southern Peruvian Andes during 1965–2010
12. Linear and nonlinear hydrological cycle responses to increasing sea surface temperature
Extreme Events
13. Extreme high-temperature events over East Asia in 1.5°C and 2°C warmer futures: Analysis of NCAR CESM low-warming experiments
"The results show that the magnitude of warming in East Asia is approximately 0.2°C higher than the global mean. Most populous subregions, including eastern China, the Korean Peninsula and Japan, will see more intense, more frequent and longer lasting extreme temperature events under 1.5°C and 2°C warming. The 0.5°C lower warming will help avoid 35%-46% of the increases in extreme high-temperature events in terms of intensity, frequency and duration in East Asia with maximal avoidance values (37%-49%) occurring in Mongolia. Thus, it is beneficial for East Asia to limit the warming target to 1.5°C rather than 2°C."
14. Super Storm Desmond: a process-based assessment
15. Linking Hadley circulation and storm tracks in a conceptual model of the atmospheric energy balance
16. Local-scale analysis of temperature patterns over Poland during heatwave events
17. Spatiotemporal changes in the size and shape of heat waves over North America
18. Avoiding population exposure to heat-related extremes: demographic change vs climate change
19. Surveying of Heat waves Impact on the Urban Heat Islands: Case study, the Karaj City in Iran
Climate Forcings and Feedbacks
20. Probability distribution for the visually observed fractional cloud cover over the ocean
21. The contrasting climate response to tropical and extratropical energy perturbations
22. Inferred Net Aerosol Forcing Based on Historical Climate Changes: a Review
23. Equilibrium Climate Sensitivity Obtained from Multi-Millennial Runs of Two GFDL Climate Models
"Equilibrium climate sensitivity (ECS), defined as the long-term change in global mean surface air temperature in response to doubling atmospheric CO2, is usually computed from short atmospheric simulations over a mixed layer ocean, or inferred using a linear regression over a short-time period of adjustment. We report the actual ECS from multi-millenial simulations of two GFDL general circulation models (GCMs), ESM2M and CM3 of 3.3 K and 4.8 K, respectively. Both values are ~1 K higher than estimates for the same models reported in the Fifth Assessment Report of the Intergovernmental Panel on Climate Change obtained by regressing the Earth's energy imbalance against temperature. This underestimate is mainly due to changes in the climate feedback parameter (−α) within the first century after atmospheric CO2 has stabilized. For both GCMs it is possible to estimate ECS with linear regression to within 0.3 K by increasing CO2 at 1% per year to doubling and using years 51-350 after CO2 is constant. We show that changes in −α differ between the two GCMs and are strongly tied to the changes in both vertical velocity at 500 hPa (ω500) and estimated inversion strength (EIS) that the GCMs experience during the progression towards the equilibrium. This suggests that while cloud physics parametrizations are important for determining the strength of −α, the substantially different atmospheric state resulting from a changed SST pattern may be of equal importance."
24. Sulfate aerosol in the Arctic: source attribution and radiative forcing
Cryosphere
25. Simple models for the simulation of submarine melt for a Greenland glacial system model
26. Rate of mass loss across the instability threshold for Thwaites Glacier determines rate of mass loss for entire basin
27. Seafloor geomorphology of western Antarctic Peninsula bays: a signature of ice flow behaviour
28. Monitoring glacier albedo as a proxy to derive summer and annual surface mass balances from optical remote-sensing data
29. Arctic sea ice in a 1.5 ° C warmer world
"Based on the high-sensitivity observations, we find that Arctic September sea ice is lost with low probability (P≈10%) for global warming of +1.5 ° C above pre-industrial levels and with very high probability (P>99%) for global warming of +2 ° C above pre-industrial levels. For the low-sensitivity observations, September sea ice is extremely unlikely to disappear for +1.5 ° C warming (P<<1%) and has low likelihood (P≈10%) to disappear even for +2 ° C global warming. For March, both observational records suggest a loss of 15% to 20% of Arctic sea-ice area for 1.5 ° C to 2 ° C global warming."
30. Spatiotemporal variability of snow depth across the Eurasian continent from 1966 to 2012
31. Ensemble-based assimilation of fractional snow-covered area satellite retrievals to estimate the snow distribution at Arctic sites
Atmospheric and Oceanic Circulation
32. Gulf Stream Excursions and Sectional Detachments Generate the Decadal Pulses in the Atlantic Multidecadal Oscillation
33. Multidecadal Variability in Global Surface Temperatures Related to the Atlantic Meridional Overturning Circulation
"By influencing the ocean heat uptake efficiency and by shifting the pattern of heat uptake, global air temperatures are significantly altered on a multidecadal time scale by AMOC variability."
34. Winter North Atlantic Oscillation impact on European precipitation and drought under climate change
35. Disentangling global warming, multi-decadal variability, and El Niño in Pacific temperatures
Carbon Cycle
36. The carbon cycle response to two El Nino types: an observational study
37. Short and long-term controls on active layer and permafrost carbon turnover across the Arctic
38. Impact of priming on global soil carbon stocks
39. Coastal Erosion of Permafrost Soils along the Yukon Coastal Plain and Fluxes of Organic Carbon to the Canadian Beaufort Sea
40. Evaluation of forest CO2 fluxes from sonde measurements in three different climatological areas including Borneo, Malaysia, and Iriomote and Hokkaido, Japan
41. Origin of elemental carbon in snow from western Siberia and northwestern European Russia during winter–spring 2014, 2015 and 2016
"In NW European Russia transportation and domestic combustion from Finland was important. A systematic underestimation was found in W Siberia at places where gas flaring was important, implying miscalculation or sources."
42. Inverse modelling of European CH4 emissions during 2006–2012 using different inverse models and reassessed atmospheric observations
43. A Canadian upland forest soil profile and carbon stocks database
44. Characteristics of CO2 Concentration and Flux in the Beijing Urban Area
45. Sources of uncertainty in modeled land carbon storage within and across three MIPs: Diagnosis with three new techniques
Hydrosphere
46. 21st century sea-level rise in line with the Paris accord
47. GPS Vertical Land Motion Corrections to Sea-Level Rise Estimates in the Pacific Northwest
48. Mechanism of Future Spring Drying in the Southwest U.S. in CMIP5 Models
Climate change impacts
Mankind
49. Warming autumns at high latitudes of Europe: an opportunity to lose or gain in cereal production?
"Warming autumns have insignificant potential for additional cereal yield gains. Even the latest maturing wheat cultivars would mature by the same time or earlier than currently when sown earlier. However, inter-annual variability in harvest times remains high, and hence many emerging risks may result from the elevated autumn precipitation in the future that will accompany delayed harvests."
50. Modeling indoor air carbon dioxide concentration using artificial neural network
51. Changes in terrestrial water stress and contributions of major factors under temperature rise constraint scenarios
52. Enabling private sector adaptation to climate change in sub-Saharan Africa
53. Changing risk of spring frost damage in grapevines due to climate change? A case study in the Swiss Rhone Valley
54. Breeding implications of drought stress under future climate for upland rice in Brazil
55. High-Resolution Monitoring of Weather Impacts on Infrastructure Networks using the Internet of Things
Biosphere
56. Geo-climatic factors drive diatom community distribution in tropical South American freshwaters
57. Adaptive evolution in the coccolithophore Gephyrocapsa oceanica following 1000 generations of selection under elevated CO2
58. Seasonality matters—The effects of past and projected seasonal climate change on the growth of native and exotic conifer species in Central Europe
59. Invasive alien plant species dynamics in the Himalayan region under climate change
"Two invasive species, Ageratum conyzoides and Parthenium hysterophorus, will lose overall suitable area by 2070, while Ageratina adenophora, Chromolaena odorata and Lantana camara will gain suitable areas and all of them will retain most of the current habitat as stable."
60. Phenology and time series trends of the dominant seasonal phytoplankton bloom across global scales
Climate change mitigation
61. Toward a global coal mining moratorium? A comparative analysis of coal mining policies in the USA, China, India and Australia
"We find that the norm of keeping coal in the ground remains essentially contested. Even in those countries that have introduced some form of a coal mining moratorium, the ban can easily be, or has already been, reversed. To the extent that the norm of keeping coal in the ground has momentum, it is primarily due to non-climate reasons: the Chinese moratorium was mostly an instance of industrial policy (aiming to protect Chinese coal companies and their workers from the overcapacity and low prices that are hitting the industry), while the USA’s lease restrictions were mainly motivated by concerns over fiscal justice."
62. Accounting for effects of carbon flows in LCA of biomass-based products—exploration and evaluation of a selection of existing methods
"We found that including the impact of land use and carbon cycles had a profound effect on the results for global warming impact potential. It changed the ranking among the different routes for PE production, sometimes making biomass-based PE worse than the fossil alternative."
63. An introduction to the special issue on the Benefits of Reduced Anthropogenic Climate changE (BRACE)
"Here, we provide a brief summary of the project design, expanding on its relation to the scenario literature, and an overview of the papers included in the issue. While we leave the discussion of results mainly to the synthesis paper, we extend it here to include some additional detail on the relationship between BRACE results and those from other avoided impact studies, and emphasize future research needs."
64. Analysis on energy demand and CO2 emissions in China following the Energy Production and Consumption Revolution Strategy and China Dream target
65. Analysis of the global carbon dioxide emissions from 2003 to 2015: convergence trends and regional contributions
66. As Bad as it Gets: How Climate Damage Functions Affect Growth and the Social Cost of Carbon
67. The value of knowledge accumulation on climate sensitivity uncertainty: comparison between perfect information, single stage and act then learn decisions
68. Perceptions of climate engineering in the South Pacific, Sub-Saharan Africa, and North American Arctic
69. Perceptions of climate change risk in The Bahamas
70. How geoengineering scenarios frame assumptions and create expectations
71. Quantifying and comparing effects of climate engineering methods on the Earth system
72. The Signaling Effect of Emission Taxes Under International Duopoly
73. Current sources of carbon tetrachloride (CCl4) in our atmosphere
74. Land restoration in food security programmes: synergies with climate change mitigation
Other papers
75. Near-surface permafrost aggradation in Northern Hemisphere peatlands shows regional and global trends during the past 6000 years
"Results indicate that permafrost was continuously present in peatlands during the last 6000 years in some present-day continuous permafrost zones and formed after 6000 BP in peatlands in the isolated to discontinuous permafrost regions. Rates of permafrost aggradation in peatlands generally increased after 3000 BP and were greatest between 750 and 0 BP, corresponding with neoglacial cooling and the Little Ice Age (LIA), respectively. Peak periods of permafrost thaw occurred after 250 BP, when permafrost aggradation in peatlands reached its maximum extent and as temperatures began warming after the LIA, suggesting that permafrost thaw is likely to continue in the future."
76. Climate variability in the subarctic area for the last 2 millennia
"A focus on the last 2 centuries shows a recent warming characterized by a well-marked warming trend parallel with increasing greenhouse gas emissions. It also shows a multidecadal variability likely due to natural processes acting on the internal climate system on a regional scale. A ∼ 16–30-year cycle is found in Alaska and seems to be linked to the Pacific Decadal Oscillation, whereas ∼ 20–30- and ∼ 50–90-year periodicities characterize the North Atlantic climate variability, likely in relation with the Atlantic Multidecadal Oscillation. These regional features are probably linked to the sea ice cover fluctuations through ice–temperature positive feedback."
77. How will air quality change in South Asia by 2050?
from Skeptical Science http://ift.tt/2nCj21j
A selection of new climate related research articles is shown below.
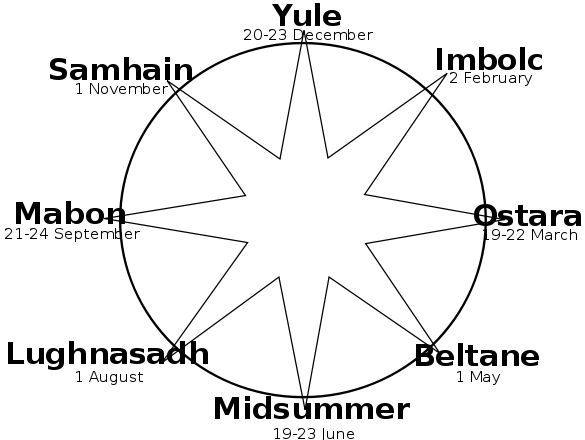
The figure is from paper #30.
Climate change
1. Whole Atmosphere Simulation of Anthropogenic Climate Change
"The basic result was that even as the lower atmosphere gradually warms, the upper atmosphere rapidly cools. The simulations employed constant low solar activity conditions, to remove the effects of variable solar and geomagnetic activity. Global mean annual mean temperature increased at a rate of +0.2 K/decade at the surface and +0.4 K/decade in the upper troposphere, but decreased by about -1 K/decade in the stratosphere-mesosphere, and -2.8 K/decade in the thermosphere. Near the mesopause, temperature decreases were small compared to the interannual variation, so trends in that region are uncertain."
2. Towards the Application of Decadal Climate Predictions
3. Downscaling future climate change projections over Puerto Rico using a non-hydrostatic atmospheric model
4. High-Resolution Historical Climate Simulations over Alaska
Temperature, Precipitation, and Wind
5. Trend in the co-occurrence of extreme daily rainfall in West Africa since 1950
6. Climate change impacts on rainfall and temperature in sugarcane growing Upper Gangetic Plains of India
7. Do SST gradients drive the monthly climatological surface wind convergence over the tropical Atlantic?
8. Global, Regional, and Megacity Trends in the Highest Temperature of the Year: Diagnostics and Evidence for Accelerating Trends
"A global increase of 0.19°C per decade during the past 50 years (through 2015) accelerated to 0.25°C per decade during the last 30 years, a faster increase than in the mean annual temperature. Strong positive 30-year trends are detected in large regions of Eurasia and Australia with rates higher than 0.60°C per decade. In cities with more than 5 million inhabitants, where most heat-related fatalities occur, the average change is 0.33°C per decade, while some east Asia cities, Paris, Moscow, and Houston have experienced changes higher than 0.60°C per decade."
9. Temperature and Precipitation trends in Kashmir valley, North Western Himalayas
10. Towards predicting changes in the land monsoon rainfall a decade in advance
11. A new assessment in total and extreme rainfall trends over central and southern Peruvian Andes during 1965–2010
12. Linear and nonlinear hydrological cycle responses to increasing sea surface temperature
Extreme Events
13. Extreme high-temperature events over East Asia in 1.5°C and 2°C warmer futures: Analysis of NCAR CESM low-warming experiments
"The results show that the magnitude of warming in East Asia is approximately 0.2°C higher than the global mean. Most populous subregions, including eastern China, the Korean Peninsula and Japan, will see more intense, more frequent and longer lasting extreme temperature events under 1.5°C and 2°C warming. The 0.5°C lower warming will help avoid 35%-46% of the increases in extreme high-temperature events in terms of intensity, frequency and duration in East Asia with maximal avoidance values (37%-49%) occurring in Mongolia. Thus, it is beneficial for East Asia to limit the warming target to 1.5°C rather than 2°C."
14. Super Storm Desmond: a process-based assessment
15. Linking Hadley circulation and storm tracks in a conceptual model of the atmospheric energy balance
16. Local-scale analysis of temperature patterns over Poland during heatwave events
17. Spatiotemporal changes in the size and shape of heat waves over North America
18. Avoiding population exposure to heat-related extremes: demographic change vs climate change
19. Surveying of Heat waves Impact on the Urban Heat Islands: Case study, the Karaj City in Iran
Climate Forcings and Feedbacks
20. Probability distribution for the visually observed fractional cloud cover over the ocean
21. The contrasting climate response to tropical and extratropical energy perturbations
22. Inferred Net Aerosol Forcing Based on Historical Climate Changes: a Review
23. Equilibrium Climate Sensitivity Obtained from Multi-Millennial Runs of Two GFDL Climate Models
"Equilibrium climate sensitivity (ECS), defined as the long-term change in global mean surface air temperature in response to doubling atmospheric CO2, is usually computed from short atmospheric simulations over a mixed layer ocean, or inferred using a linear regression over a short-time period of adjustment. We report the actual ECS from multi-millenial simulations of two GFDL general circulation models (GCMs), ESM2M and CM3 of 3.3 K and 4.8 K, respectively. Both values are ~1 K higher than estimates for the same models reported in the Fifth Assessment Report of the Intergovernmental Panel on Climate Change obtained by regressing the Earth's energy imbalance against temperature. This underestimate is mainly due to changes in the climate feedback parameter (−α) within the first century after atmospheric CO2 has stabilized. For both GCMs it is possible to estimate ECS with linear regression to within 0.3 K by increasing CO2 at 1% per year to doubling and using years 51-350 after CO2 is constant. We show that changes in −α differ between the two GCMs and are strongly tied to the changes in both vertical velocity at 500 hPa (ω500) and estimated inversion strength (EIS) that the GCMs experience during the progression towards the equilibrium. This suggests that while cloud physics parametrizations are important for determining the strength of −α, the substantially different atmospheric state resulting from a changed SST pattern may be of equal importance."
24. Sulfate aerosol in the Arctic: source attribution and radiative forcing
Cryosphere
25. Simple models for the simulation of submarine melt for a Greenland glacial system model
26. Rate of mass loss across the instability threshold for Thwaites Glacier determines rate of mass loss for entire basin
27. Seafloor geomorphology of western Antarctic Peninsula bays: a signature of ice flow behaviour
28. Monitoring glacier albedo as a proxy to derive summer and annual surface mass balances from optical remote-sensing data
29. Arctic sea ice in a 1.5 ° C warmer world
"Based on the high-sensitivity observations, we find that Arctic September sea ice is lost with low probability (P≈10%) for global warming of +1.5 ° C above pre-industrial levels and with very high probability (P>99%) for global warming of +2 ° C above pre-industrial levels. For the low-sensitivity observations, September sea ice is extremely unlikely to disappear for +1.5 ° C warming (P<<1%) and has low likelihood (P≈10%) to disappear even for +2 ° C global warming. For March, both observational records suggest a loss of 15% to 20% of Arctic sea-ice area for 1.5 ° C to 2 ° C global warming."
30. Spatiotemporal variability of snow depth across the Eurasian continent from 1966 to 2012
31. Ensemble-based assimilation of fractional snow-covered area satellite retrievals to estimate the snow distribution at Arctic sites
Atmospheric and Oceanic Circulation
32. Gulf Stream Excursions and Sectional Detachments Generate the Decadal Pulses in the Atlantic Multidecadal Oscillation
33. Multidecadal Variability in Global Surface Temperatures Related to the Atlantic Meridional Overturning Circulation
"By influencing the ocean heat uptake efficiency and by shifting the pattern of heat uptake, global air temperatures are significantly altered on a multidecadal time scale by AMOC variability."
34. Winter North Atlantic Oscillation impact on European precipitation and drought under climate change
35. Disentangling global warming, multi-decadal variability, and El Niño in Pacific temperatures
Carbon Cycle
36. The carbon cycle response to two El Nino types: an observational study
37. Short and long-term controls on active layer and permafrost carbon turnover across the Arctic
38. Impact of priming on global soil carbon stocks
39. Coastal Erosion of Permafrost Soils along the Yukon Coastal Plain and Fluxes of Organic Carbon to the Canadian Beaufort Sea
40. Evaluation of forest CO2 fluxes from sonde measurements in three different climatological areas including Borneo, Malaysia, and Iriomote and Hokkaido, Japan
41. Origin of elemental carbon in snow from western Siberia and northwestern European Russia during winter–spring 2014, 2015 and 2016
"In NW European Russia transportation and domestic combustion from Finland was important. A systematic underestimation was found in W Siberia at places where gas flaring was important, implying miscalculation or sources."
42. Inverse modelling of European CH4 emissions during 2006–2012 using different inverse models and reassessed atmospheric observations
43. A Canadian upland forest soil profile and carbon stocks database
44. Characteristics of CO2 Concentration and Flux in the Beijing Urban Area
45. Sources of uncertainty in modeled land carbon storage within and across three MIPs: Diagnosis with three new techniques
Hydrosphere
46. 21st century sea-level rise in line with the Paris accord
47. GPS Vertical Land Motion Corrections to Sea-Level Rise Estimates in the Pacific Northwest
48. Mechanism of Future Spring Drying in the Southwest U.S. in CMIP5 Models
Climate change impacts
Mankind
49. Warming autumns at high latitudes of Europe: an opportunity to lose or gain in cereal production?
"Warming autumns have insignificant potential for additional cereal yield gains. Even the latest maturing wheat cultivars would mature by the same time or earlier than currently when sown earlier. However, inter-annual variability in harvest times remains high, and hence many emerging risks may result from the elevated autumn precipitation in the future that will accompany delayed harvests."
50. Modeling indoor air carbon dioxide concentration using artificial neural network
51. Changes in terrestrial water stress and contributions of major factors under temperature rise constraint scenarios
52. Enabling private sector adaptation to climate change in sub-Saharan Africa
53. Changing risk of spring frost damage in grapevines due to climate change? A case study in the Swiss Rhone Valley
54. Breeding implications of drought stress under future climate for upland rice in Brazil
55. High-Resolution Monitoring of Weather Impacts on Infrastructure Networks using the Internet of Things
Biosphere
56. Geo-climatic factors drive diatom community distribution in tropical South American freshwaters
57. Adaptive evolution in the coccolithophore Gephyrocapsa oceanica following 1000 generations of selection under elevated CO2
58. Seasonality matters—The effects of past and projected seasonal climate change on the growth of native and exotic conifer species in Central Europe
59. Invasive alien plant species dynamics in the Himalayan region under climate change
"Two invasive species, Ageratum conyzoides and Parthenium hysterophorus, will lose overall suitable area by 2070, while Ageratina adenophora, Chromolaena odorata and Lantana camara will gain suitable areas and all of them will retain most of the current habitat as stable."
60. Phenology and time series trends of the dominant seasonal phytoplankton bloom across global scales
Climate change mitigation
61. Toward a global coal mining moratorium? A comparative analysis of coal mining policies in the USA, China, India and Australia
"We find that the norm of keeping coal in the ground remains essentially contested. Even in those countries that have introduced some form of a coal mining moratorium, the ban can easily be, or has already been, reversed. To the extent that the norm of keeping coal in the ground has momentum, it is primarily due to non-climate reasons: the Chinese moratorium was mostly an instance of industrial policy (aiming to protect Chinese coal companies and their workers from the overcapacity and low prices that are hitting the industry), while the USA’s lease restrictions were mainly motivated by concerns over fiscal justice."
62. Accounting for effects of carbon flows in LCA of biomass-based products—exploration and evaluation of a selection of existing methods
"We found that including the impact of land use and carbon cycles had a profound effect on the results for global warming impact potential. It changed the ranking among the different routes for PE production, sometimes making biomass-based PE worse than the fossil alternative."
63. An introduction to the special issue on the Benefits of Reduced Anthropogenic Climate changE (BRACE)
"Here, we provide a brief summary of the project design, expanding on its relation to the scenario literature, and an overview of the papers included in the issue. While we leave the discussion of results mainly to the synthesis paper, we extend it here to include some additional detail on the relationship between BRACE results and those from other avoided impact studies, and emphasize future research needs."
64. Analysis on energy demand and CO2 emissions in China following the Energy Production and Consumption Revolution Strategy and China Dream target
65. Analysis of the global carbon dioxide emissions from 2003 to 2015: convergence trends and regional contributions
66. As Bad as it Gets: How Climate Damage Functions Affect Growth and the Social Cost of Carbon
67. The value of knowledge accumulation on climate sensitivity uncertainty: comparison between perfect information, single stage and act then learn decisions
68. Perceptions of climate engineering in the South Pacific, Sub-Saharan Africa, and North American Arctic
69. Perceptions of climate change risk in The Bahamas
70. How geoengineering scenarios frame assumptions and create expectations
71. Quantifying and comparing effects of climate engineering methods on the Earth system
72. The Signaling Effect of Emission Taxes Under International Duopoly
73. Current sources of carbon tetrachloride (CCl4) in our atmosphere
74. Land restoration in food security programmes: synergies with climate change mitigation
Other papers
75. Near-surface permafrost aggradation in Northern Hemisphere peatlands shows regional and global trends during the past 6000 years
"Results indicate that permafrost was continuously present in peatlands during the last 6000 years in some present-day continuous permafrost zones and formed after 6000 BP in peatlands in the isolated to discontinuous permafrost regions. Rates of permafrost aggradation in peatlands generally increased after 3000 BP and were greatest between 750 and 0 BP, corresponding with neoglacial cooling and the Little Ice Age (LIA), respectively. Peak periods of permafrost thaw occurred after 250 BP, when permafrost aggradation in peatlands reached its maximum extent and as temperatures began warming after the LIA, suggesting that permafrost thaw is likely to continue in the future."
76. Climate variability in the subarctic area for the last 2 millennia
"A focus on the last 2 centuries shows a recent warming characterized by a well-marked warming trend parallel with increasing greenhouse gas emissions. It also shows a multidecadal variability likely due to natural processes acting on the internal climate system on a regional scale. A ∼ 16–30-year cycle is found in Alaska and seems to be linked to the Pacific Decadal Oscillation, whereas ∼ 20–30- and ∼ 50–90-year periodicities characterize the North Atlantic climate variability, likely in relation with the Atlantic Multidecadal Oscillation. These regional features are probably linked to the sea ice cover fluctuations through ice–temperature positive feedback."
77. How will air quality change in South Asia by 2050?
from Skeptical Science http://ift.tt/2nCj21j


