2019 Arctic Report Card: Visual highlights

Via NOAA

NOAA’s 14th annual Arctic Report Card, released December 10, 2019, recounts the numerous ways that climate change continued to disrupt the polar region during 2019, with near-record high air and ocean temperatures, a massive melt of the Greenland ice sheet, record low sea-ice extents, and major shifts in the distribution of commercially valuable marine species.

The 2019 Arctic Report Card is a volume of original, peer-reviewed environmental analyses of a region undergoing rapid and dramatic change, compiled by 81 scientists from 12 nations. Read the 2019 Arctic Report Card here.

Below are links to five image-based stories that highlight some findings from this year’s report.

EarthSky 2020 lunar calendars are available! They make great gifts. Order now. Going fast!

2019 was Arctic’s second-warmest year on record

Line drawing map of north part of globe with red areas.

In 2019, surface temperatures were the second-warmest on record, continuing a string of 6 years that have been warmer than all other periods in the historic record dating back to 1900. Full story.

At gateways to the Arctic, northern fish are retreating

Side by side maps with outlined areas larger on left map, smaller on right.

As Arctic waters warm, fish and marine mammals are migrating in search of their preferred habitats and food sources. In both the Bering and Barents Seas, Arctic fish are retreating, while more southern species are expanding northward. Full story.

The Greenland Ice Sheet’s 2019 melt season rivaled record for area and duration

Graph with steadily descending line from 2002 to 2020 superimposed on orbital view of Greenland.

The Greenland Ice Sheet contains enough stored water to raise sea level by more than 24 feet (7.2 meters) as it melts. How fast that will occur is one of the big unknowns for predicting the pace of sea level rise over the rest of the century. The 2019 melt season on Greenland rivaled 2012’s record-melt year. Full story.

Less than 1% of Arctic ice has survived 4 or more summers

Side by side maps, lots of Arctic ice on left, very little on right.

One consequence of the region’s dramatic warming trend is that Arctic sea ice doesn’t last as long as it used to. The proportion of old, thick ice in the Arctic’s winter maximum ice pack has dropped from more than a third in the mid-1980s to barely just 1% today. Full story.

As sea ice disappears, Arctic seas are experiencing extreme summer warmth

Map with red areas north of Alaska, Siberia, and Greenland.

Like the air, the waters of the Arctic are warming, triggering a feedback loop in which sea ice melts, exposing more water to sunlight, leading to more warming. The warmth in summer can be extreme, as shallow coastal areas that were historically covered with sunlight-reflecting ice and snow are now open water. Full story.

Vast area of ice-covered water, and two small red ships.

Two Canadian Coast Guard ships tie up to ice in the Arctic Ocean on September 5, 2019. The two ships were taking part in a multi-year, multi-agency Arctic survey to map the Arctic continental shelf. Image via Patrick Kelley/ U.S. Coast Guard.

Bottom line: NOAA’s 2019 Arctic Report Card reports near-record high air and ocean temperatures, a massive melt of the Greenland ice sheet, record low sea-ice extents, and major shifts in the distribution of commercially valuable marine species.

Via NOAA


from EarthSky https://ift.tt/36FHPGH

Via NOAA

NOAA’s 14th annual Arctic Report Card, released December 10, 2019, recounts the numerous ways that climate change continued to disrupt the polar region during 2019, with near-record high air and ocean temperatures, a massive melt of the Greenland ice sheet, record low sea-ice extents, and major shifts in the distribution of commercially valuable marine species.

The 2019 Arctic Report Card is a volume of original, peer-reviewed environmental analyses of a region undergoing rapid and dramatic change, compiled by 81 scientists from 12 nations. Read the 2019 Arctic Report Card here.

Below are links to five image-based stories that highlight some findings from this year’s report.

EarthSky 2020 lunar calendars are available! They make great gifts. Order now. Going fast!

2019 was Arctic’s second-warmest year on record

Line drawing map of north part of globe with red areas.

In 2019, surface temperatures were the second-warmest on record, continuing a string of 6 years that have been warmer than all other periods in the historic record dating back to 1900. Full story.

At gateways to the Arctic, northern fish are retreating

Side by side maps with outlined areas larger on left map, smaller on right.

As Arctic waters warm, fish and marine mammals are migrating in search of their preferred habitats and food sources. In both the Bering and Barents Seas, Arctic fish are retreating, while more southern species are expanding northward. Full story.

The Greenland Ice Sheet’s 2019 melt season rivaled record for area and duration

Graph with steadily descending line from 2002 to 2020 superimposed on orbital view of Greenland.

The Greenland Ice Sheet contains enough stored water to raise sea level by more than 24 feet (7.2 meters) as it melts. How fast that will occur is one of the big unknowns for predicting the pace of sea level rise over the rest of the century. The 2019 melt season on Greenland rivaled 2012’s record-melt year. Full story.

Less than 1% of Arctic ice has survived 4 or more summers

Side by side maps, lots of Arctic ice on left, very little on right.

One consequence of the region’s dramatic warming trend is that Arctic sea ice doesn’t last as long as it used to. The proportion of old, thick ice in the Arctic’s winter maximum ice pack has dropped from more than a third in the mid-1980s to barely just 1% today. Full story.

As sea ice disappears, Arctic seas are experiencing extreme summer warmth

Map with red areas north of Alaska, Siberia, and Greenland.

Like the air, the waters of the Arctic are warming, triggering a feedback loop in which sea ice melts, exposing more water to sunlight, leading to more warming. The warmth in summer can be extreme, as shallow coastal areas that were historically covered with sunlight-reflecting ice and snow are now open water. Full story.

Vast area of ice-covered water, and two small red ships.

Two Canadian Coast Guard ships tie up to ice in the Arctic Ocean on September 5, 2019. The two ships were taking part in a multi-year, multi-agency Arctic survey to map the Arctic continental shelf. Image via Patrick Kelley/ U.S. Coast Guard.

Bottom line: NOAA’s 2019 Arctic Report Card reports near-record high air and ocean temperatures, a massive melt of the Greenland ice sheet, record low sea-ice extents, and major shifts in the distribution of commercially valuable marine species.

Via NOAA


from EarthSky https://ift.tt/36FHPGH

Start watching for Ursid meteors

Start watching tonight – December 17, 2019 – for meteors in the annual Ursid meteor shower. This shower runs from about December 17 to 26 each year. It typically peaks around the December solstice, which, in 2019, comes on December 21 or 22, depending on your time zone. The shower’s peak is probably the morning of December 22, but any of the next few mornings should yield some Ursids as well. Then, after the solstice and the shower’s peak, keep watching. You might catch some!

Generally, the Ursids are a low-key affair, offering perhaps as many as 5 to 10 meteors per hour in a dark sky. In rare instances, bursts of 100 or more meteors per hour have been observed at times over the past century.

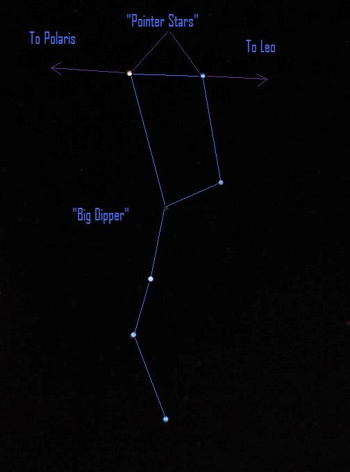
The chart at the top of the page shows the Big and Little Dipper asterisms – in the constellations Ursa Major and Ursa Minor – for whom the Ursid meteor shower is named. If you look from a Northern Hemisphere location around the time of the solstice, you’ll find the Big Dipper well up in the north-northeast at around 1 a.m. That’s about the time of night you’ll want to start watching this meteor shower.

In 2019, at this shower’s peak, the moon is in waning phase. It’ll be bright in the sky on the mornings of December 18 or 19, but, by the time of the Ursids’ peak on the mornings of December 22 or 23, the moon will be a thin crescent. It won’t greatly intrude on what’s usually a low-key spattering of Ursid meteors on the mornings of the peak.

Read more: Year’s farthest lunar perigee on December 18

EarthSky lunar calendars are cool! They make great gifts. Order now. Going fast!

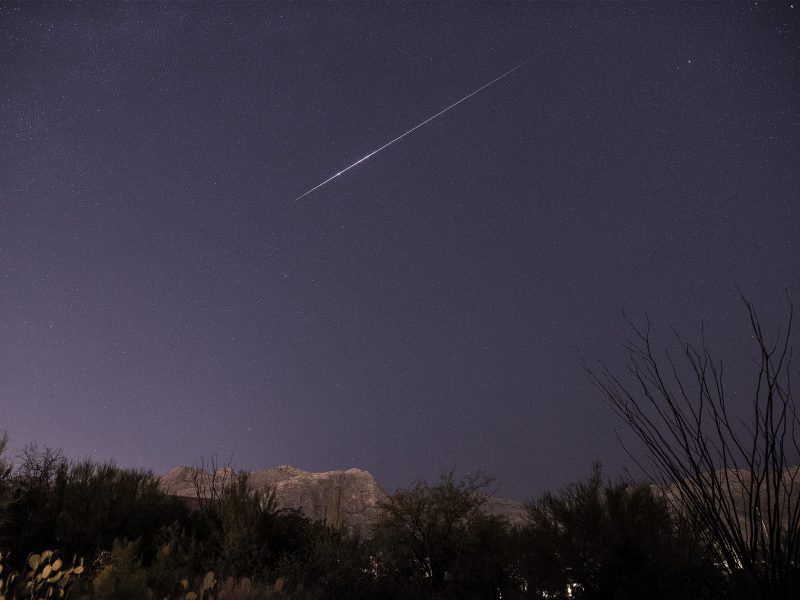
Ursid fireball! A fireball is just a very bright meteor. Eliot Herman in Tucson caught this one on December 18, 2016.

This shower isn’t a great one for the Southern Hemisphere. It’s just too far north on the sky’s dome for its radiant point to be easily visible from temperate latitudes in the Southern Hemisphere. As you may know, all meteors in annual showers have radiant points on our sky’s dome; the showers typically take their names from the constellations in which their radiants lie. If you trace the paths of the slow-moving Ursid meteors backward, they appear to come from the section of sky marked by the Little Dipper star Kochab.

On the other hand, the Little Dipper is circumpolar (out all night) for far-northerly latitudes. From there, you’ll find the star Kochab below Polaris, the North Star, at nightfall. Kochab (and all the Little Dipper stars) circle Polaris in a counterclockwise direction throughout the night, with this star reaching its high point for the night in the hours before dawn. And that’s important for meteor-watching, because the higher the radiant climbs in your sky, the more meteors you’re likely to see. Thus for the Ursids – as for so many meteors showers – the best time to watch is in the hours before dawn.

Read more: Kochab and Pherkad guard the North Celestial Pole

Do you love stargazing? Order your EarthSky Planisphere today!

Ursid meteors radiate from near the star Kochab in the Little Dipper. The star Polaris is also part of the Little Dipper. Can’t find the Little Dipper? Use the Big Dipper! No matter what time of year you look, the two outer stars in the Big Dipper’s bowl always point to Polaris, which marks the end of the handle of the Little Dipper.

Bottom line: If you want to watch the Ursids, find a country location where you can camp out. Dress warmly! And plan to spend several hours reclining under a dark sky. The predawn hours are usually the most favorable.

Read more: Ursid meteors peak around the solstice


from EarthSky https://ift.tt/2S5lQCd

Will sea otters return to San Francisco Bay?

Sleek animals with tail flippers lying on their backs in the water.

Southern sea otters resting and napping among kelp fronds in Morro Bay, about midway between San Francisco and Los Angeles. Image via Ingrid Taylar.

A new study by a team of university and government scientists – announced by California’s Sonoma State University on December 9, 2019 – has concluded that the southern sea otter population could be tripled if the otters were reintroduced by humans to the largest estuary in North America’s west coast, San Francisco Bay. The population of southern sea otters currently numbers only around 3,000, but their numbers were once much higher. The new study is promising, but there’s a stumbling block: the great white sharks that patrol the waters in San Francisco Bay, near iconic Golden Gate Bridge. Brent Hughes of Sonoma State University is the lead author of the new study. He said in a statement:

We call it ‘the gauntlet.’ Otters really can’t get past the gauntlet.

To repopulate the San Francisco Bay estuary, sea otters would have to be transported to that location, past the sharks, by conservationists.

Similar reintroduction efforts over the past few decades – relocating sea otters from areas with healthy populations to sites they once inhabited – have been key to their ongoing recovery. Hughes said:

It would essentially end up lifting the sea otter out of its endangered species status. For the conservation of the sea otter, this would be huge.

The findings were published in the December 2019 issue of the peer-reviewed journal PeerJ: the Journal of Life and Environmental Sciences.

EarthSky 2020 lunar calendars are available! They make great gifts. Order now. Going fast!

Scientist in rubber waders kneeling in shallow water with a lot of grass in it.

Brent Hughes is an assistant professor of biology at Sonoma State University. He led the research for a new study on the possibility of tripling the southern sea otter population by reintroducing them to the San Francisco Bay. Image via Jessica Saavedra.

Southern sea otters (Enhydra lutris nereis) are a subspecies of a larger population of sea otters (Enhydra lutris). The subspecies lives in California’s coastal waters, but – speaking in terms of the entire group of sea otters now – these otters once ranged along the Pacific Rim from Baja California in Mexico to Russia and Japan. The larger group of sea otters are estimated to have once numbered between 150,000 to 300,000. In the 1700s and 1800s, they were heavily hunted for their thick fur. This hunting brought sea otters generally to the brink of extinction; by the time conservation measures were enacted, there were only about 2,000 individuals left.

The subspecies – California’s southern sea otters – was also deeply impacted by over-hunting. By 1914, there were only about 50 individuals left in the southern sea otter population, living off the Big Sur shoreline.

Since then, conservation efforts have increased the southern sea otter population to approximately 3,000 individuals. Still, they only occupy 13% of their original range.

Reintroduction to key habitats has worked well for other subspecies of sea otters. Northern sea otters (Enhydra lutris kenyoni) were successfully reintroduced to their former range off Washington, British Columbia and Southeast Alaska. Asian sea otters (Enhydra lutris lutris) have stable populations along parts of the Russian coast.

Map of Northern Pacific with stripes along coast from northern Japan around to Baja California.

Sea otter range map. Image via Christophe cagé/ WikiMedia Commons.

Up to now, the California recovery programs have been mostly confined to waters off the state’s shoreline. In their paper, the researchers speculated that this confinement:

… may be an artifact of where the surviving population persisted.

In other words, since most surviving sea otter populations were found near shorelines, most reintroductions were made in similar habitats.

But archaeological evidence and historical records show that southern sea otters used to thrive also in estuaries. Today, only one estuary, Elkhorn Slough at Moss Landing in Monterey Bay, is know to have a self-sustaining sea otter population.

Duke University’s Brian Silliman, a co-author on the paper, commented in the statement:

The dogma, widely reinforced in both the scientific and popular media, is that sea otters do best in saltwater kelp forests. But this is based on studies and observations made while these populations were in sharp decline. Now that they are rebounding, they’re surprising us by demonstrating how adaptable and cosmopolitan they really are.

Tim Tinker, a wildlife biologist at the USGS Western Ecological Research Center, also a co-author, added:

This really changes our view of the ecological role of sea otters. They are not only keystone marine mammals of the outer coast, they are also important apex predators in estuarine habitats.

A keystone species is a species that’s critically important to the health of its ecosystem. Sea otters feed on a variety of marine invertebrates; in particular, two animals with potential to cause widespread habitat destruction: sea urchins and crabs.

Kelp forests support a high diversity of marine life and protect shorelines from strong storm surges. Sea urchins graze on kelp, and if sea otters aren’t around to control the urchin population, kelp forests could be decimated. In eelgrass meadows, also richly diverse ecosystems, slugs feed on algae growing on eelgrass leaves. Crabs prey on these slugs, and if there were too many crabs picking off slugs, algae could overgrow to smother the eelgrass. Sea otters keep the crab populations in check, resulting in healthier eelgrass habitats.

Hughes and his team analyzed existing California sea otter studies and modeled sea otter growth. They concluded that the San Francisco Bay alone could support as many as 6,600 sea otters; that’s more than twice the current southern sea otter population. Said Hughes,

It would change the game in terms of how we look at sea otter conservation.

Fuzzy-faced animal on its back in water with strap-like fronds over it.

Sea otters often wrap themselves in kelp fronds to keep from drifting away as they sleep. The orange tag on this sea otter’s flipper, placed by scientists, is used to identify and monitor individual sea otters. Image via Ingrid Taylar.

Bottom line: California’s southern sea otters, currently numbering around 3,000, could be tripled in numbers if they were reintroduced to the estuaries they once occupied, in particular, the largest estuary in western North America, San Francisco Bay.

Via Sonoma State University


from EarthSky https://ift.tt/2RVXBcn

How often are there 3 eclipses in a month?

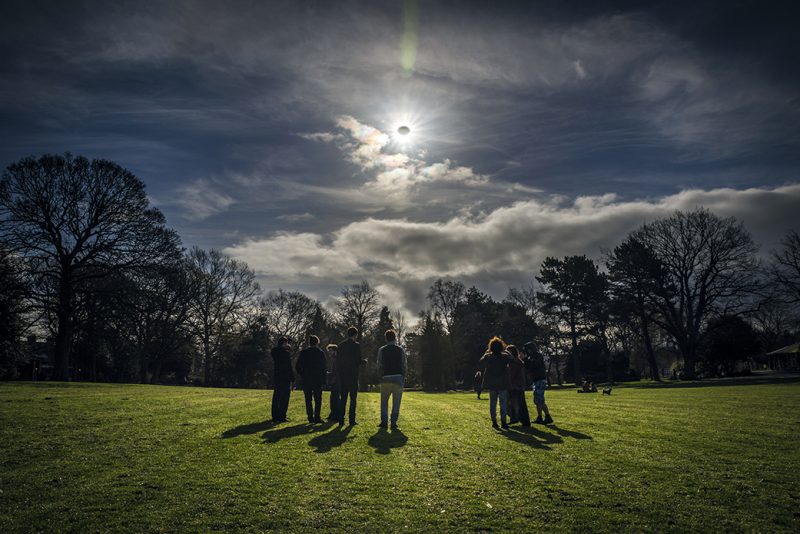
People watch a partial eclipse in Belfast, Northern Ireland, on March 20, 2015. Image via NASA/Robin Cordiner.

Every calendar year has at least four eclipses – two solar and two lunar. More rarely, we have five, six or even seven eclipses in a single year. But four eclipses per calendar year is the most common number. A solar eclipse always comes within approximately two weeks of a lunar eclipse, and usually in a single pair (one solar and one lunar). Then, generally, another pair of eclipses (one solar and one lunar) comes some six months later. But not so in 2019.

We have a total of five eclipses but no 3-eclipse month in 2019:

January 6, 2019: Partial solar eclipse
January 21, 2019: Total lunar eclipse

July 2, 2019: Total solar eclipse
July 16, 2019: Partial lunar eclipse

December 26, 2019: Annular solar eclipse
January 10, 2020: Penumbral lunar eclipse

The last time we actually had three eclipses in the span of one lunar month (the time period between successive new moons or full moons) was in the year 2018. It started with the Friday the 13th supermoon solar eclipse on July 13, 2018, and concluded with the solar eclipse of August 11, 2018:

2018 Jan 31: Total lunar eclipse
2018 Feb 15: Partial solar eclipse

2018 July 13: Partial solar eclipse
2018 July 27: Total lunar eclipse
2018 Aug 11: Partial solar eclipse

So how often do we get three eclipses in one month? Let the investigation begin …

Partial solar eclipse photo by Fred Espenak

Partial solar eclipse photo by Fred Espenak.

Three eclipses in one calendar month. According to NASA eclipse expert Fred Espenak, three eclipses fall in the same calendar month only 12 times during the five-century span from 1801-2300. Six times there are two solar eclipses and one lunar eclipse in one calendar month. Six times there are two penumbral lunar eclipses and a total (or annular) solar eclipse in one calendar month.

The last time we had three eclipses in a calendar month was in July 2000, when two partial solar eclipses bracketed a total lunar eclipse:

2000 July 01: Partial solar eclipse
2000 July 16: Total lunar eclipse
2000 July 31: Partial solar eclipse

(We wish to state parenthetically that these three eclipses happened exactly one Saros period – or exactly 223 lunar months – before the eclipses of July 13, 27, and August 11, 2018.)

Previous to July 2000, the last time three eclipses took place in one calendar month was in March 1904, when two penumbral lunar eclipses bracketed an annular solar eclipse.

1904 March 02: Penumbral lunar eclipse
1904 March 17: Annular solar eclipse
1904 March 31: Penumbral lunar eclipse

After July 2000, three eclipses will next occur within one calendar month in December 2206:

2206 Dec 01: Partial solar eclipse
2206 Dec 16: Total lunar eclipse
2206 Dec 30: Partial solar eclipse

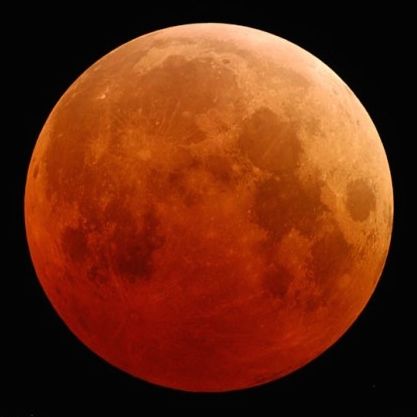
Total lunar eclipse in 2004 by Fred Espenak

Total lunar eclipse photo by Fred Espenak.

Three eclipses in one lunar month. Some might argue that the calendar month is an artificial constraint. It might be more appropriate to use a lunar (or synodic) month, which is a natural unit of time. A lunar month refers to time period between successive new moons, or successive full moons.

Although it is rare for three eclipses to happen in the same calendar month, it’s not that uncommon for three eclipses to occur in one lunar month. In fact, from the years 2000-2050, the three-eclipses-in-one-month phenomenon takes place a total of fourteen times. Six times, the lunar month features two solar eclipses and one lunar eclipse (2000, 2011, 2018, 2029, 2036 and 2047). Eight times, the lunar month presents two lunar eclipses and one solar eclipse (2002, 2009, 2013, 2020, 2027, 2031, 2038 and 2049).

Lunar month of 3 eclipses means 7 eclipses in one year’s time

Three eclipses last took place in one lunar month in the year 2018:

2018 July 13: Partial solar eclipse
2018 July 27: Total lunar eclipse
2018 Aug 11: Partial solar eclipse

Previous to 2018, three eclipses last took place in one lunar month in 2013:

2013 April 25: Partial lunar eclipse
2013 May 10: Annular solar eclipse
2013 May 25: Penumbral lunar eclipse

After 2018, three eclipses in one lunar month will next occur in 2020:

2020 June 05: Penumbral lunar eclipse
2020 June 21: Annular solar eclipse
2020 July 05: Penumbral lunar eclipse

Sources:
Catalog of lunar eclipses 2001-2100

Catalog of solar eclipses 2001-2100

Bottom line: In one calendar month, three eclipses are rare. But in one lunar month, three eclipses are are more common. From 2000-2050, it happens 14 times.

Is it possible to have only two full moons in a single season?


from EarthSky https://ift.tt/1hXqx7r

Happy holiday season from the EarthSky community

Big full moon and a lighthouse covered with holiday lights.

View at EarthSky Community Photos. | On December 12, 2019, Manish Mamtani captured the full Cold Moon over Maine’s Nubble lighthouse, which is adorned with lights for the holiday season.

White circle in the center of a black rectangle. Smaller circles of red, orange, and green on the right side of the image.

View at EarthSky Community Photos. | Kym Balwin Ney took this photo in Calfonte, Pennsylvania on December 12, 2019. She said: “Caught the cold moon above my neighbors Christmas lights last night!”

Yellow round moon in a dark sky. On the right side of the image, illuminated tree.

John Jairu Lumbera Roldan captured this image on December 12, 2019 and wrote:”The last full moon of this decade. Love, from the Philippines. #FullColdMoon”

Full moon seen through tree branches covered with holiday lights.

View at EarthSky Community Photos. | Ann Smirke in Pebble Beach, California captured this image on December 12, 2019. She wrote: “The moon looks like a beautiful Christmas ornament on the tree!”

Colored lights strung in dark branches against a dark sky with a full moon.

View at EarthSky Community Photos. | Leslie Fay took this photo at the Ethel M candy factory in Henderson, Nevada on December 12, 2019. Leslie wrote: “Moon with con trails over the beautifully decorated cactus gardens.”


from EarthSky https://ift.tt/36Bxr2H

Moon and Regulus on December 16

The moon is some days past full on December 16, 2019, and so it’s rising late at night. On this evening, you might catch the moon and star Regulus – brightest star in the constellation Leo the Lion – rising in the east from mid- to late evening. If not, you can always get up before daybreak on December 17 to view this waning gibbous moon and star Regulus high in the morning sky. You’ll recognize them easily. Look first for the moon. That nearby bright star will be Regulus.

Click here to see the moon’s present position in front of the constellations of the zodiac

Want to know when the moon and Regulus rise into your sky? Then click here for the moon’s rising time (remember to check the moonrise and moonset box). Or try Stellarium online. It can help you find the rising time for Regulus for your specific location on the globe.

EarthSky lunar calendars are cool! They make great gifts. Order now. Going fast!

Regulus represents the Heart of Leo the Lion. It’s the only 1st-magnitude star to sit almost squarely on the ecliptic – the sun’s apparent annual path in front of the constellations of the zodiac. Of course, the sun’s apparent motion in front of the background stars is really a reflection of Earth revolution around the sun.

Chart of the constellation Leo via the IAU. The ecliptic depicts the annual pathway of the sun in front of the constellations of the zodiac. The sun passes in front of the constellation Leo each year from around August 10 to September 17, and has its yearly conjunction with the star Regulus on or near August 23.

Regulus is also considered the most important of the four Royal Stars of ancient Persia. Possibly, Regulus’ proximity with the ecliptic elevated this star’s status. These Royal Stars mark the four quadrants of the heavens. They are Regulus, Antares, Fomalhaut, and Aldebaran.

Four to five thousand years ago, the Royal Stars defined the approximate positions of equinoxes and solstices in the sky. Regulus reigned as the summer solstice star, Antares as the autumn equinox star, Fomalhaut as the winter solstice star, and Aldebaran as the spring equinox star. Regulus is often portrayed as the most significant Royal Star, possibly because it symbolized the height and glory of the summer solstice sun. Although the Royal Stars as seasonal signposts change over the long course of time, they still mark the four quadrants of the heavens.

An imaginary line drawn between the pointer stars in the Big Dipper – the 2 outer stars in the Dipper’s bowl – points in one direction toward Polaris, the North Star, and in the opposite direction toward Leo.

The star Regulus coincided with the summer solstice point some 4,300 years ago. In our time, the sun has its annual conjunction with Regulus on or near August 23, or about two months after the summer solstice – or, alternatively, one month before the autumn equinox.

Regulus will mark the autumn equinox point some 2,100 years in the future.

The constellation Leo, with the star Regulus at its heart, as depicted on a set of constellation cards published in London in about 1825. Image via Wikimedia Commons.

Bottom line: Tonight, use the waning gibbous moon to locate Regulus, the Royal Star!


from EarthSky https://ift.tt/38K6FHi

2nd-known interstellar visitor rounds the sun

Blue dot surrounded by haze near a fuzzy vertical streak with a bright center.

Before. Here’s comet 2I/Borisov – the 2I stands for 2nd interstellar – on November 16, 2019, about 3 weeks before its perihelion, or closest point to the sun. It appears in front of a distant background spiral galaxy (2MASX J10500165-0152029), whose bright central core is smeared because Hubble was tracking the comet. Comet Borisov was approximately 203 million miles (327 million km) from Earth in this exposure. The streak off to the upper right is its tail of ejected dust. Read more about this image, which is via NASA/ ESA/ D. Jewitt.

Astronomers last week (December 12, 2019) released new Hubble Space Telescope images of 2I/Borisov – the second-known interstellar object – shortly before and shortly after its December 8 perihelion. Those images are historic in and of themselves; we’ve never before witnessed an interstellar object sweeping closest to our sun. 2I/Borisov – discovered on August 30, 2019, by comet hunter Gennady Borisov in Crimea, and now characterized as a comet – was about twice as far as Earth from the sun at its closest, on the inner edge of the asteroid belt between Mars and Jupiter. So its December 8 passage nearest our sun wasn’t a close passage for a comet. But – since comets are most active when they sweep closest to a star – astronomers hoped to see 2I/Borisov exhibit an outburst or other activity.

We haven’t heard of any outbursts from 2I/Borisov, but the Hubble observations did yield important science. Astronomer David Jewitt of UCLA led the team that captured the new images. Jewitt said in a statement:

Hubble gives us the best upper limit of the size of comet Borisov’s nucleus [core], which is the really important part of the comet.

Surprisingly, our Hubble images show that its nucleus is more than 15 times smaller than earlier investigations suggested it might be. Our Hubble images show that the radius is smaller than half-a-kilometer [.3 miles].

Knowing the size is potentially useful for beginning to estimate how common such objects might be in the solar system and our galaxy. Borisov is the first known interstellar comet, and we would like to learn how many others there are.

EarthSky 2020 lunar calendars are available! They make great gifts. Order now. Going fast!

White dot surrounded by slightly elongated large blue hazy area.

After. Astronomers aimed Hubble toward 2I/Borisov again on December 9, 2019, shortly after its perihelion or closest point to the sun on December 8, 2019. When closest to the sun, a comet receives maximum heating; it tends to be most active. It’s also moving fastest in orbit. 2I/Borisov was barreling along at some 100,000 miles (160,000 km) per hour at perihelion. At its closest to the sun, 2I/Borisov was about twice Earth’s average distance from the sun, near the inner edge of the asteroid belt between Mars and Jupiter. It was 185 million miles (298 million km) from Earth in this photo. Its nucleus or core – made of ices and dust – was still too small to see. The comet will make its closest approach to Earth in late December at a distance of 180 million miles (290 million km). Image via NASA/ ESA/ D. Jewitt (UCLA).

Let’s back up a minute. What is 2I/Borisov? We’ve said it’s the second interstellar visitor and the first known interstellar comet. That is, it’s a comet from another star system. The first interstellar object was spotted by astronomers in Hawaii in late 2017. Earthly astronomers named it 1I/’Oumuamua (“Scout”). The 1I stands for 1st interstellar.

‘Oumuamua was positively identified as coming from beyond our solar system. The shape of its orbit told that story. But it couldn’t be positively identified as a comet, despite the fact that – because they’re only loosely bound to their own stars – comets are the most likely candidates for becoming interstellar objects. ‘Oumuamua, though, was a strange object – long and thin – and didn’t show any signs of outgassing or a tail. It looked in many ways more like an asteroid than a comet.

Plus it had already passed its perihelion when astronomers first spotted it. It was already heading outward, back out of our solar system again.

So seeing the second-known interstellar object – 2I/Borisov – both before and after perihelion was a big plus for astronomers!

And now both 1I/’Oumuamua and 2I/Borisov are heading outward again. By the middle of 2020, 2I/Borisov will have zoomed past Jupiter’s distance of 500 million miles (800 million km) on its way back to interstellar space.

But, never fear – now that they’ve spotted the first two interstellar objects – astronomers expect to find more.

Thin circles (planetary orbits) with long, thin curved line passing near orbit of Mars.

2I/Borisov’s orbit. The “2I” stands for “2nd interstellar.” In other words, this is only the 2nd object from a distant solar system known to have swept past our sun. Its perihelion – or closest point to the sun – is just outside the orbit of Mars. Image via Wikimedia Commons user Drbogdan/NASA.

Bottom line: Astronomers used the Hubble Space Telescope to obtain images of 2I/Borisov – the second known interstellar object – before and after its December 8, 2019, perihelion, or closest point to the sun.

Via NASA


from EarthSky https://ift.tt/2LXRlgh