What are star trails, and how can I capture them?

Short streaks of light in concentric circles against a black background.

View larger at EarthSky Community Photos. | Cameron Frankish captured this image in Dartmoor, Devon, UK, on October 21, 2019.

Star trails are the continuous paths created by stars, produced during long-exposure photographs, as shown in this post. In other words, the camera doesn’t track along with the stars’ apparent motion as night passes. Instead, the camera stays fixed, while, as the hours pass, the stars move. The resulting photos show the nightly movement of stars on the sky’s dome.

Star trails reflect Earth’s rotation, or spin, on its axis. The Earth rotates full circle relative to the backdrop stars in a period of about 23 hours and 56 minutes. So, as seen from Earth, all the stars go full circle and return to the same place in the sky after this period of time, which astronomers call a sidereal (stellar) day.

EarthSky 2020 lunar calendars are available! They make great gifts. Order now. Going fast!

Concentric circles of light over a mountainous landscape.

Star trails over the planned site of the Giant Magellan Telescope in the Atacama Desert in Chile. Image via Yuri Beletsky Nightscapes.
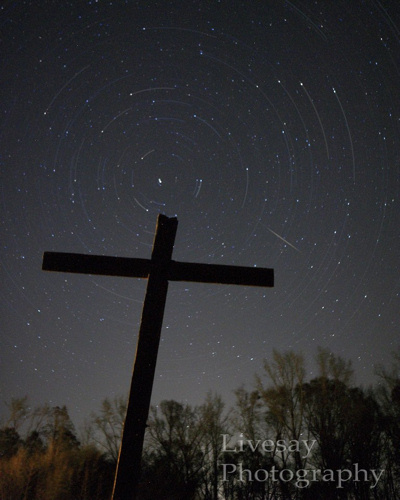
Faint, short concentric streaks of light with one thin straight streak. Big cross in foreground.

View larger. | Star trails (plus meteor) photo taken by Guy Livesay. Thank you, Guy! If you aim your camera northward in a long-exposure photo, the star trails will be seen to track around the north celestial pole. In fact, the stars move counter-clockwise around the sky’s north pole in the course of every night.
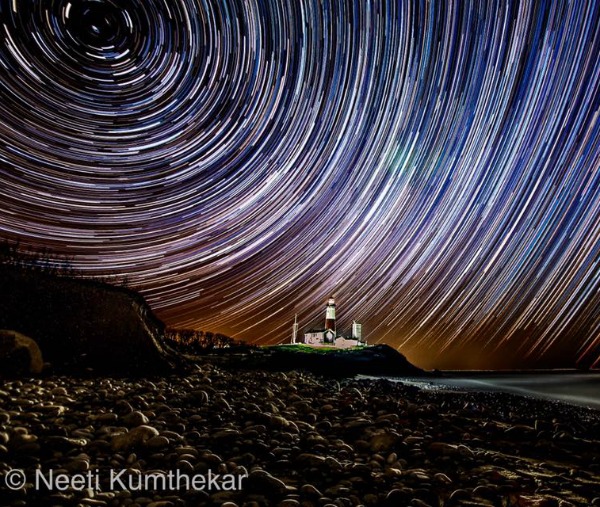
Brilliant concentric streaks over distant buildings including a lighthouse tower.

Montauk Point lighthouse. Photo via Neeti Kumthekar.

What this means is that, if you’re standing out under the stars, you see them move across the sky as night passes. Stars rise in the east, arc across the sky and set in the west, just as the sun does.

Stars near the celestial poles produce the smallest circles while those near the celestial equator produce the largest. The stars – like the sun during the daytime – move from east to west across the sky each and every night. Each and every star moves 15 degrees westward in one hour.

Star trails are really arcs, or partial circles, whose ever-circling motions forever tabulate the great passage of time.

Concentric white streaks against medium blue background with wide linear white smudges.

Sometimes you can get cool non-star effects into your shot, as Michael A. Rosinski did in this photo.

Many thin concentric circles around point above horizon, with some trees in the foreground.

Ken Christison captured these glorious star trails around Polaris, the North Star. He wrote, “For the most common and often the most spectacular star trails, you want to locate Polaris and compose the image so it is centered horizontally and hopefully you can have a bit of foreground for reference.”

EarthSky Facebook friend Ken Christison has some wonderful photos of star trails. He said the equipment needed for making startrails is pretty simple:

First, a camera that allows manual settings so you can set your f/stop and shutter speeds, as well as ISO.

Next, a wide angle lens, the wider the better.

A good steady tripod is a must.

Some cameras will have a built in intervalometer which can be set to shoot the desirable number of frames. In some cases the intervalometer has a bit of lag between shots, which is the reason I use a separate, remote attached to the camera that holds the shutter down and when the camera is set in continuous shooting mode will shoot 100 frames in succession with very little gap.

The remote I use is a simple one that can be found on eBay and uses a couple AAA batteries that last quite a while. I just use the remote controller attached to the 10 pin connector. There is no need to use the wireless receiver in this case.

I use a shutter speed of 30 seconds, ISO of 400 to 800, and with my 14-24mm lens at 14mm, shoot it wide open at f/2.8.

Next, he said, you’re ready to capture your star trail:

Make sure the camera is level, and after focusing on a star, make sure the autofocus is turned off. Then, using the settings mentioned above, click the shutter and stay around long enough to know that the shutter is actually actuating. I normally go back in the house, set the timer on our kitchen stove for 45 minutes, and do other things while the camera does its work.

When the timer sounds, go back out and reset the remote by turning it off, waiting for the shutter to close, then reset quickly.

Finally, you’ll want to process your photo. Ken said:

This is one of the most important elements in making star trail images. The program I use is free, works well and is simple to use: https://www.startrails.de.

One other program that I have heard works well and is also free is StarStax: https://www.markus-enzweiler.de/software/software.html.

Thank you, Ken!

Visit Ken Christison’s Flickr page.

Read more: Long exposure star trail photography
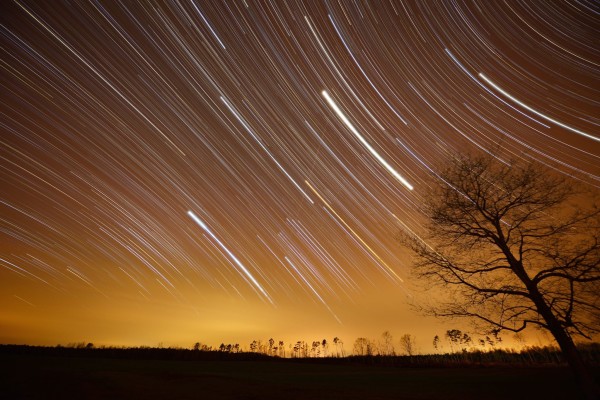
Curved white streaks against a dark brown sky with light on the horizon.

A 2-hour-and-15-minute star trail image from March 21, 2014. Our friend Ken Christison in North Carolina captured this image. Want to see what a single frame of this image looked like? See the photo below.

Dark brown sky with constellation Orion and seven stars labeled.

A single frame of the star trail image above, with the elements labeled. Thank you, Ken Christison of Conway, North Carolina!
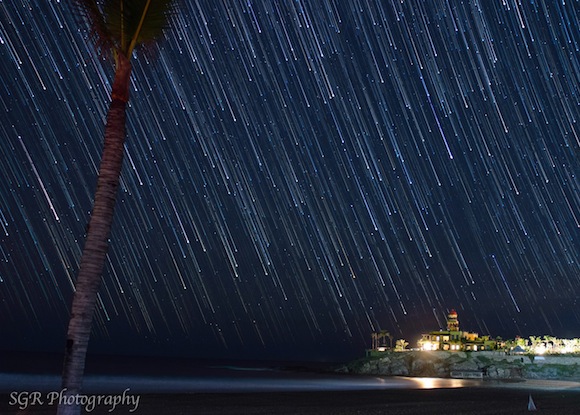
Long white streaks with bright dots at lower end, looking like a rain of stars.

Composite image of star trails over Baja, California, from EarthSky Facebook friend Sergio Garcia Rill. This image is the product of 80 separate photographs. Thank you, Sergio!

Pink sky with three images of the sun in a line behind a power line pylon.

You can also create a star trail of sorts with our local star, the sun. EarthSky Facebook friend Matthew Chin in Hong Kong created this sun trail on October 5, 2013. Thank you, Matthew!
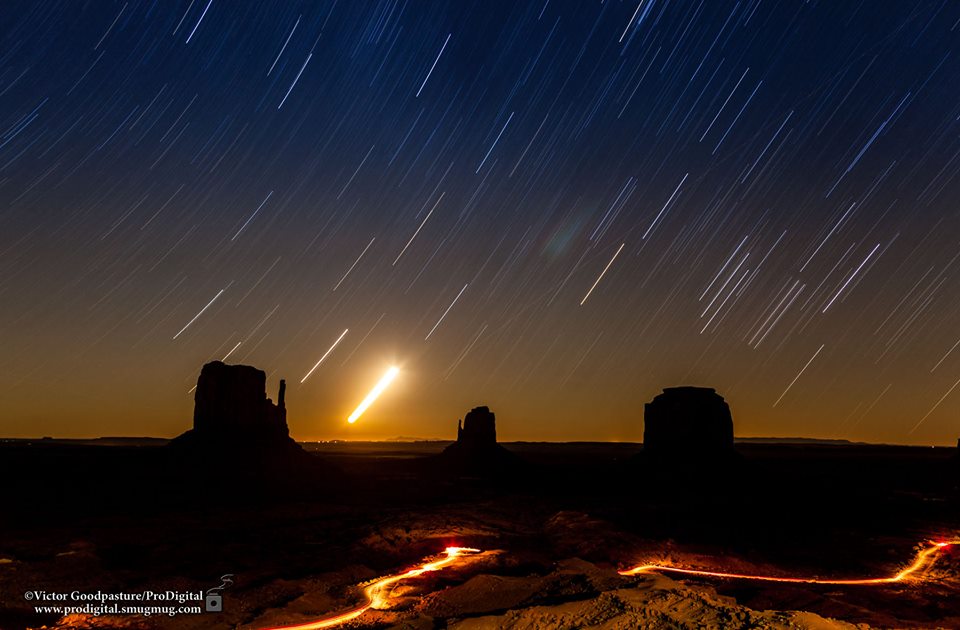
Short white streaks with one thick, very bright white streak.

View larger. | Or you can create a moon trail. Star trails and moon trail over Monument Valley from Victor Goodpasture. The bright object is the moon. See more from Victor at Professional Digital Photography on Facebook.

Bottom line: When a camera captures a star’s movement across the sky, it’s called a star trail.


from EarthSky https://ift.tt/35XJRCl

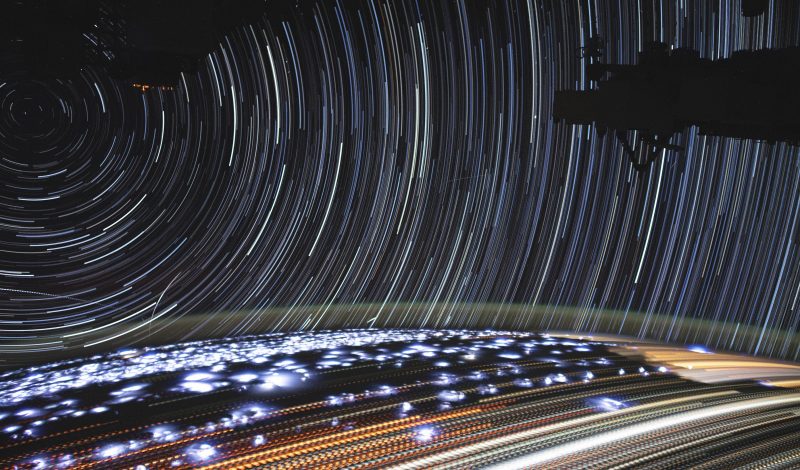
Star trails from the ISS

This image of star trails was compiled from time-lapse photography taken by NASA astronaut Christina Koch onboard the International Space Station (ISS) on July 5, 2019. This composite image was made from more than 400 individual photos taken over a span of about 11 minutes as the ISS traveled from Namibia toward the Red Sea.

Koch wrote on Twitter:

City lights, stars, lightning storms, even satellite flares–A composite of individual photos stacked on top of each other to show all the amazing things we see at night out our window.

What are star trails, and how can I capture them?

Via NASA Earth Observatory


from EarthSky https://ift.tt/2p8HfB7

Watch Capella flashing red and green

Photo at top: The star Capella via Scott MacNeill at Frosty Drew Observatory in Rhode Island

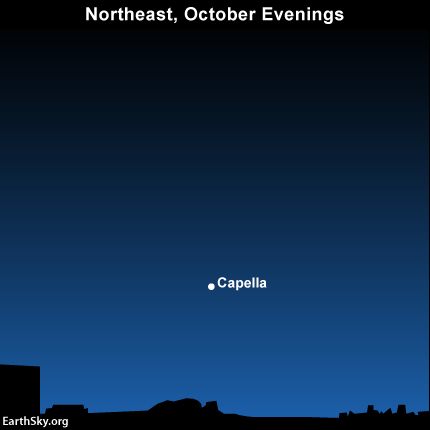
This evening, check out one of the flashiest stars in the sky. It’s so bright that every year in northern autumn, we get questions from people in the Northern Hemisphere who see a bright star twinkling with red and green flashes. It’s found low in the northeastern sky at nightfall as seen from Northern Hemisphere locations. That star is likely Capella, which is actually a golden star.

In fact, if you could travel to it in space, you’d find that Capella is really two golden stars, both with roughly the same surface temperature as our local star, the sun … but both larger and brighter than our sun.

Capella is in the constellation Auriga the Charioteer, but since antiquity it has carried the name Goat Star. You might pick it out just by gazing northeastward from a Northern Hemisphere latitude during the evening hours in October. Capella climbs upward through the night, and, this month, soars high overhead in the wee hours before dawn.

Bright star with colors in its diffraction spikes.

Scott MacNeill at Frosty Drew Observatory in Rhode Island wrote in October, 2016: “I noticed how fabulous Capella looked just hanging in the northeast sky. So I directed my telescope to Capella and captured this shot.” Thanks, Scott!

So here is a golden point of light that flashes red and green when it’s low in the sky. Why does it do that?

The reality is that every star in the sky undergoes the same process as Capella, to produce its colorful twinkling. That is, every star’s light must shine through Earth’s atmosphere before reaching our eyes. But not every star flashes as noticeably as Capella. The flashes are happening because Capella is low in the sky in the evening at this time of year. And, when you look at an object low in the sky, you’re looking through more atmosphere than when the same object is overhead.

The atmosphere splits or “refracts” the star’s light, just as a prism splits sunlight.

So that’s where Capella’s red and green flashes are coming from … not from the star itself … but from the refraction of its light by our atmosphere. When you see Capella higher in the sky, you’ll find that these glints of red and green will disappear.

By the way, why are these flashes of color so noticeable with Capella? The reason is simply that it’s a bright star. It’s the 6th brightest star in Earth’s sky, not including our sun.

Capella is a bright star, what astronomers call a 1st magnitude star. It’s one of the brightest stars in our sky. If you’re in the Northern Hemisphere, and you happen to look in the northeast one evening, you might notice Capella as a bright, flashy star near the northeastern horizon.

Bottom line: If you’re in Earth’s Northern Hemisphere, a bright star twinkling with red and green flashes, low in the northeastern sky on October evenings, is probably Capella.


from EarthSky https://ift.tt/2S71pF7

Ice cliffs in Antarctica might not contribute to extreme sea-level rise in this century

A tall ice cliff in a deep blue sea, with cracks indicating a calfing of the ice into the sea soon.

Getz Ice Shelf in West Antarctica. Image via NASA/Jeremy Harbeck/MIT.

Researchers at the Massachusetts Institute of Technology (MIT) in Cambridge weighed in this month on the potential of ice cliffs in Antarctica to collapse suddenly due to Earth warming, and thereby contribute to extreme sea level rise by the end of this century. This subject – called marine ice cliff instability by scientists – was first proposed in the 1970s but entered a new period of scientific urgency when a 2016 study in the journal Earth and Planetary Science Letters suggested the fast collapse of tall Antarctic ice cliffs might cause 6 feet (2 meters) of sea-level rise by the end of this century:

… enough to completely flood Boston and other coastal cities.

Since that 2016 study, scientists have been looking hard at hypothesis that giant blocks falling to the Southern Ocean surrounding Antarctica, from crumbling ice cliffs at the coast, would create a kind of domino effect, exposing more ice cliffs that would, in turn, crumble. If this did happen, sea level would rise rapidly. But will it happen? No one knows, of course, but scientists have been turning their best tools toward the question. A February 2019 statistical study suggested a rapid collapse of Antarctic ice cliffs was unlikely to have happened in the past, even during some of Earth’s warmest episodes over the last 3 million years. The new MIT study published October 21, 2019 reaches its conclusions in a different way, but also suggests the earlier estimate of 6 feet (2 meters) of sea level rise by 2100 may have been too high.

In the new study, the effect of collapsing ice cliffs to contribute to rapid sea level rise is shown to depend heavily on how fast the cliffs themselves collapse. A relatively slow collapse would, in these scientists’ words:

… mitigate runaway cliff collapse.

EarthSky 2020 lunar calendars are available! They make great gifts. Order now. Going fast!

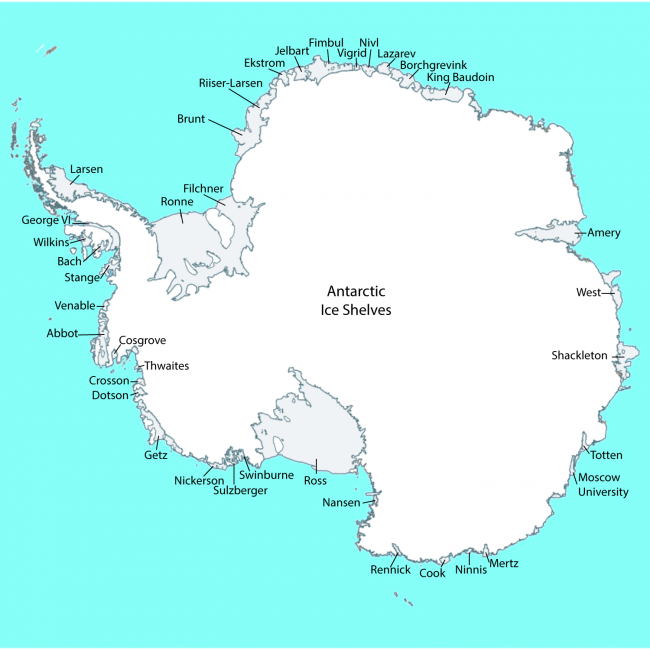
A map showing Antarctic ice shelves, which ring the continent.

View larger. | Ice shelves in Antarctica. These are places where tall ice cliffs calve icebergs into the Southern Ocean that completely surrounds the continent. Image via Wikipedia.

You probably know that Antarctic is a true land continent, in contrast to the Arctic, whose only solid surface is floating sea ice. As MIT explained in a statement:

Antarctica’s ice sheet spans close to twice the area of the contiguous United States, and its land boundary is buttressed by massive, floating ice shelves extending hundreds of miles out over the frigid waters of the Southern Ocean. When these ice shelves collapse into the ocean, they expose towering cliffs of ice along Antarctica’s edge.

Scientists have assumed that ice cliffs taller than 90 meters (about 300 feet, or the height of the Statue of Liberty) would rapidly collapse under their own weight, contributing to more than 6 feet of sea-level rise by the end of the century — enough to completely flood Boston and other coastal cities. But now MIT researchers have found that this particular prediction may be overestimated.

In a paper published … in Geophysical Research Letters, the team reports that in order for a 90-meter ice cliff to collapse entirely, the ice shelves supporting the cliff would have to break apart extremely quickly, within a matter of hours — a rate of ice loss that has not been observed in the modern record.

MIT graduate student Fiona Clerc – the study’s first author – said:

Ice shelves are about a kilometer (0.6 miles) thick, and some are the size of Texas. To get into catastrophic failures of really tall ice cliffs, you would have to remove these ice shelves within hours, which seems unlikely no matter what the climate-change scenario.

If a supporting ice shelf were to melt away over a longer period of days or weeks, rather than hours, the researchers found that the remaining ice cliff wouldn’t suddenly crack and collapse under its own weight, but instead would slowly flow out, like a mountain of cold honey that’s been released from a dam.

Brent Minchew of MIT – one of the new study’s co-authors – said:

The current worst-case scenario of sea-level rise from Antarctica is based on the idea that cliffs higher than 90 meters would fail catastrophically. We’re saying that scenario, based on cliff failure, is probably not going to play out. That’s something of a silver lining.

That said, we have to be careful about breathing a sigh of relief. There are plenty of other ways to get rapid sea-level rise.

A young woman looking directly into the camera and smiling.

Fiona Clerc is a graduate study in MIT’s MIT’s Department of Earth, Atmospheric and Planetary Sciences. She’s 1st author on the new study about collapsing ice cliffs in Antarctica. Image via MIT.

Here’s how these scientists reached their conclusion. MIT explained:

Today, there are no ice cliffs on Earth that are taller than 90 meters, and scientists assumed this is because cliffs any taller than that would be unable to support their own weight.

Clerc, Minchew, and Behn took on this assumption, wondering whether and under what conditions ice cliffs 90 meters and taller would physically collapse. To answer this, they developed a simple simulation of a rectangular block of ice to represent an idealized ice sheet (ice over land) supported initially by an equally tall ice shelf (ice over water). They ran the simulation forward by shrinking the ice shelf at different rates and seeing how the exposed ice cliff responds over time.

In their simulation, they set the mechanical properties, or behavior of ice, according to Maxwell’s model for viscoelasticity, which describes the way a material can transition from an elastic, rubbery response, to a viscous, honey-like behavior depending on whether it is quickly or slowly loaded. A classic example of viscoelasticity is silly putty: If you leave a ball of silly putty on a table, it slowly slumps into a puddle, like a viscous liquid; if you quickly pull it apart, it tears like an elastic solid.

As it turns out, ice is also a viscoelastic material, and the researchers incorporated Maxwell viscoelasticity into their simulation. They varied the rate at which the buttressing ice shelf was removed, and predicted whether the ice cliff would fracture and collapse like an elastic material or flow like a viscous liquid.

They model the effects of various starting heights, or thicknesses of ice, from 0 to 1,000 meters, along with various timescales of ice shelf collapse. In the end, they found that when a 90-meter cliff is exposed, it will quickly collapse in brittle chunks only if the supporting ice shelf has been removed quickly, over a period of hours. In fact, they found that this behavior holds true for cliffs as tall as 500 meters. If ice shelves are removed over longer periods of days or weeks, ice cliffs as tall as 500 meters will not collapse under their own weight, but instead will slowly slough away, like cold honey.

The results suggest that the Earth’s tallest ice cliffs are unlikely to collapse catastrophically and trigger a runaway ice sheet retreat. That’s because the fastest rate at which ice shelves are disappearing, at least as documented in the modern record, is on the order of weeks, not hours, as scientists observed in 2002, when they captured satellite imagery of the collapse of the Larsen B ice shelf — a chunk of ice as large as Rhode Island that broke away from Antarctica, shattering into thousands of icebergs over the span of two weeks.

Clerc commented:

When Larsen B collapsed, that was quite an extreme event that occurred over two weeks, and that is a tiny ice shelf compared to the ones that we would be particularly worried about. So our work shows that cliff failure is probably not the mechanism by which we would get a lot of sea level rise in the near future.

Smiling man.

Brent Minchew leads MIT’s Glacier Dynamics and Remote Sensing Group, which studies the interactions between the climate, the cryosphere, and the solid Earth. Image via MIT.

That said, scientists do know level is rising. Between 1900 and 2016, it rose by about 6 to 8 inches (16–21 cm), according to a 2017 study by the U.S. Global Change Research Program. More precise data gathered from satellite radar measurements revealed an accelerating rise of about 3 inches (7.5 cm) from 1993 to 2017, according to data presented by the World Climate Research Program. Those last numbers indicate a trend of roughly one foot (30 cm) of sea level rise per century. So there’s a baseline for you. We might expect about a foot of sea level rise in this century, according to conservative models.

Bottom line:

Source (2016 study in Nature): Potential Antarctic Ice Sheet retreat driven by hydrofracturing and ice cliff failure

Source (February 2019 in Nature): Revisiting Antarctic ice loss due to marine ice-cliff instability

Source (October 2019 study in Geophysical Research Letters): Marine Ice Cliff Instability Mitigated by Slow Removal of Ice Shelves

Via MIT


from EarthSky https://ift.tt/2Wcedwv

Humpback whale population on the rise

A population of humpback whales in the South Atlantic has rebounded from the brink of extinction.

According to a new study, published October 16, 2019 in the peer-reviewd journal Royal Society Open Science, the western South Atlantic humpback population has grown to 25,000. Researchers believe this new estimate is close to pre-whaling numbers.

Thanks to the 20th century whaling industry and other factors, by the 1950s, the population of western South Atlantic humpbacks was down to only around 450 whales. Protections were put in place in the 1960s, and in the mid-1980s, the International Whaling Commission issued a moratorium on all commercial whaling, offering further safeguards for the struggling population. The new study reports that the population of South Atlantic humpbacks has recovered to about 90% of its historic population.

NOAA’s Alex Zerbini, lead author of the study, said that these findings come as good news, providing an example of how an endangered species can come back from near extinction. He said in a statement:

Wildlife populations can recover from exploitation if proper management is applied.

EarthSky’s 2020 lunar calendars are here! Get yours today. They make great gifts. Going fast.

Two whales, one large and one very small above it, in bubbly blue water

A western South Atlantic humpback mother with her calf.L. Image via L. Candisani/Insituto Aqualie.

There are seven Southern Hemisphere populations of humpbacks, reported the BBC, each of which can be described by their distinct genetics and migratory behavior. This particular group has a winter breeding ground off the coast of Brazil, and travels to sub-Antarctic and Antarctic waters in summer to gorge on the regions’ swarms of krill crustaceans.

For the study, the researchers incorporated detailed records from the whaling industry at the outset of commercial exploitation to get a good idea of the size of the original population. Current population estimates are made from a combination of air- and ship-based surveys, along with advanced modeling techniques.

The study also suggest that the revival of South Atlantic humpbacks may have ecosystem-wide impacts. Whales compete with other predators, like penguins and seals, for krill as their primary food source. Krill populations may further be impacted by warming waters due to climate change, compressing their range closer to the poles. Zerbini said:

The recovery of humpback whales in the western South Atlantic has the potential to modify the structure of the ecosystem in their feeding habitats around South Georgia and the South Sandwich Islands. For this reason, it is important to continue monitoring abundance and potential shifts in distribution to understand how krill and their predators, including whales, will respond to effects from climate change and whether these effects will impact their populations.

Bottom line: A new study reports that after being close to extinction, a population of humpback whales in the South Atlantic has rebounded.

Source: Assessing the recovery of an Antarctic predator from historical exploitation

Via University of Washington


from EarthSky https://ift.tt/344XbTZ

Tycho supernova

Tycho – first observed in 1572 – is the remnant of a supernova, located about 8,000-9,800 light-years from Earth in the constellation Cassiopeia the Queen. This latest image of Tycho, below, from the Chandra X-ray Observatory, released October 17, 2019, reveals an intriguing pattern of bright clumps and fainter areas.

Here’s more about Tycho’s discovery, from NASA:

In 1572, Danish astronomer Tycho Brahe was among those who noticed a new bright object in the constellation Cassiopeia. Adding fuel to the intellectual fire that Copernicus started, Tycho showed this “new star” was far beyond the moon, and that it was possible for the universe beyond the sun and planets to change.

Astronomers now know that Tycho’s new star was not new at all. Rather it signaled the death of a star in a supernova, an explosion so bright that it can outshine the light from an entire galaxy. This particular supernova was a Type Ia, which occurs when a white dwarf star pulls material from, or merges with, a nearby companion star until a violent explosion is triggered. The white dwarf star is obliterated, sending its debris hurtling into space.

The Chandra image reveals an intriguing pattern of bright clumps and fainter areas in Tycho. What caused this thicket of knots in the aftermath of this explosion? In a study that compared Chandra data to computer simulations, researchers found evidence that the explosion was likely the source of this lumpy distribution. Read more about the study.

Bottom line: New image of supernova remnant Tycha.

Via NASA


from EarthSky https://ift.tt/2o9IIGN

2019 ozone hole smallest since its discovery

This year’s ozone hole over Antartica is the smallest since its discovery in 1982, NASA and NOAA scientists reported yesterday (October 21, 2019). The scientists said that the small size of the ozone hole is thanks to abnormal weather patterns in the upper atmosphere over Antarctica that dramatically limited ozone depletion in September and October.

According to the report, there is no identified connection between the occurrence of these unique patterns and changes in climate.

Every year, NASA and NOAA track the hole in the ozone layer over Antarctica as it grows to its annual maximum size during the Southern Hemisphere winter. According to NASA and NOAA satellite measurements, this year’s ozone hole reached its peak extent of 6.3 million square miles (16.4 million square km) on September 8, and then shrank to less than 3.9 million square miles (10 million square km) for the remainder of September and October. During years with normal weather conditions, the ozone hole typically grows to a maximum area of about 8 million square miles (21 million square km) in late September or early October.

Paul A. Newman, chief scientist for Earth Sciences at NASA’s Goddard Space Flight Center. said in a statement:

It’s great news for ozone in the Southern Hemisphere. But it’s important to recognize that what we’re seeing this year is due to warmer stratospheric temperatures. It’s not a sign that atmospheric ozone is suddenly on a fast track to recovery.

Ozone is a molecule comprised of three oxygen atoms. A layer of ozone high in the atmosphere – about 9 to 18 miles (15 to 30 km) up – surrounds the entire Earth. It protects life on our planet from the harmful effects of the sun’s ultraviolet rays.

In the 1980s, scientists began to realize that ozone-depleting chemicals, such as chlorofluorocarbons (CFCs), were creating a thin spot – a hole – in the ozone layer over Antarctica.

The Antarctic ozone hole forms during the Southern Hemisphere’s late winter as the returning sun’s rays start ozone-depleting reactions. The depletion of ozone by CFCs in the atmosphere happens faster at colder temperatures and slows down as temperatures warm, so each October, the ozone layer begins to heal again for the year.

Learn how NASA and NOAA monitor the ozone hole throughout the year.

This is the third time in the last 40 years that weather systems have caused warm temperatures that limit ozone depletion, said NASA atmospheric scientist Susan Strahan. Similar weather patterns in the Antarctic stratosphere in September 1988 and 2002 also produced atypically small ozone holes, she said.

It’s a rare event that we’re still trying to understand. If the warming hadn’t happened, we’d likely be looking at a much more typical ozone hole.

Balloons curving across a dark blue sky, getting smaller and smaller in the distance,

At the South Pole, NOAA scientists launch balloon-borne sensors to measure the thickness of the protective ozone layer high up in the atmosphere. This time-lapse photo from September 9, 2019, shows the flight path of a weather balloon as it rises into the atmosphere over the South Pole from the Amundsen-Scott South Pole Station. Image via Robert Schwarz/University of Minnesota.

According to a NASA statement:

The weather systems that disrupted the 2019 ozone hole are typically modest in September, but this year they were unusually strong, dramatically warming the Antarctic’s stratosphere during the pivotal time for ozone destruction. At an altitude of about 12 miles (20 kilometers), temperatures during September were 29 degrees F (16 degrees C) warmer than average, the warmest in the 40-year historical record for September by a wide margin. In addition, these weather systems also weakened the Antarctic polar vortex, knocking it off its normal center over the South Pole and reducing the strong September jet stream around Antarctica from a mean speed of 161 miles per hour to a speed of 67 miles per hour. This slowing vortex rotation allowed air to sink in the lower stratosphere where ozone depletion occurs, where it had two impacts.

First, the sinking warmed the Antarctic lower stratosphere, minimizing the formation and persistence of the polar stratospheric clouds that are a main ingredient in the ozone-destroying process. Second, the strong weather systems brought ozone-rich air from higher latitudes elsewhere in the Southern Hemisphere to the area above the Antarctic ozone hole. These two effects led to much higher than normal ozone levels over Antarctica compared to ozone hole conditions usually present since the mid 1980s.

As of October 16, the ozone hole above Antarctica remained small but stable and is expected to gradually dissipate in the coming weeks.

Green and orange ball, with an irregular blue center.

The 2019 ozone hole reached its peak extent of 6.3 million square miles (16. 4 million square km) on September 8. Abnormal weather patterns in the upper atmosphere over Antarctica dramatically limited ozone depletion this year. Image via NASA.

In 1987, the international community signed the Montreal Protocol on Substances that Deplete the Ozone Layer. This agreement regulated the consumption and production of ozone-depleting compounds. Atmospheric levels of human-made ozone depleting substances increased up to the year 2000. Since then, they have slowly declined but remain high enough to produce significant ozone loss. The ozone hole over Antarctica is expected to gradually become less severe as banned CFCs continue to decline. Scientists expect the Antarctic ozone to recover back to the 1980 level around 2070.

Bottom line: The 2019 ozone hole is the smallest since it was first observed in 1982, thanks to abnormal weather patterns in the upper atmosphere over Antarctica,

Via NASA


from EarthSky https://ift.tt/32yFv2x