Tiny stature of extinct ‘Hobbit’ thanks to fast evolution

White sand beach, blue water.

An Indonesian island was home to H. Floresiensis – but how did the dwarfed human species evolve? Image via areza taqwim/Shutterstock.com.

By José Alexandre Felizola Diniz-Filho, Universidade Federal de Goias and Pasquale Raia, University of Naples Federico II

It’s not every day that scientists discover a new human species.

But that’s just what happened back in 2004, when archaeologists uncovered some very well-preserved fossil remains in the Liang Bua cave on Flores Island, Indonesia. The diminutive size of this new human species, Homo floresiensis, earned it the nickname “Hobbit.”

Shockingly, researchers believed it had survived until the end of the last Ice Age, some 18,000 years ago. That was much later than Neanderthals lived, later than any human species other than our own.

Almost immediately, interpretations of this Hobbit skeleton met with fierce criticism from both anthropologists and evolutionary biologists. The poor Hobbit was accused of being an example not of a small new human species, but an abnormal Homo sapiens, bearing any of a variety of growth and hormonal conditions. The Hobbit, many scientists decided, had no place among the giants of the human evolutionary record.

An artist’s interpretation of how H. floresiensis looked in life. Image via Tim Evanson/Flickr.

Yet she – yes, the Hobbit was later found to be a female – had her revenge. This tiny, small-brained creature stood just a bit more than three feet tall and had a brain as big as a chimp. But her place in the human ancestral line was cemented when researchers uncovered another tiny individual in Flores. This second, much older discovery debunked the idea that the Hobbit was a unique, abnormal Homo sapiens.

After 15 years of intense research, anthropologists now confidently date the Liang Bua individual to have lived between 60,000 and 90,000 years ago. Her much older cousins in Flores lived 700,000 years ago. This long reign testifies to the success of this tiny human species, no matter how small-statured and small-brained they were.

And this year anthropologists found a new dwarfed human species, christened Homo luzonensis, in the Philippines.

So why did tiny humans wind up living on these islands? For us biogeographers and evolutionary biologists, the answer was right in front of us: the island rule.

Island life and body size

Zoologist J. Bristol Foster originally proposed the island rule in 1964.

He’d noted that when a large-bodied species settles onto an island, it will tend to evolve to shrink in size – all the way to the point of leaving dwarf descendants. At the same time, the opposite will happen. Small-bodied species will evolve to be larger, producing gigantic daughter species.

There are spectacular cases of this island rule in action across the world. Think of pygmy elephants and mammoths from Mediterranean and Baja California islands, hippos that would barely outweigh a donkey in Cyprus, deer as tall as a pet dog in Crete, rats as big as a cow in the Caribbean and insects as long as a human hand in New Zealand.

Biologists have proposed various mechanisms that could be responsible for this evolutionary trend. A good motive might be the absence of natural predators on islands. A number of species, most notably elephants and hippos, fend predators off by virtue of their size, an expensive strategy when no killer is lurking in the dark. Also, on islands the scarce resource supply might favor smaller body size because smaller individuals can live with less.

Or it could be that smaller individuals with no predators just produce more offspring, which implies females start delivering earlier and at smaller size, investing less in growth and more in reproduction. This possibility is a likely explanation for how contemporary human pygmies evolved.

All of these options will eventually lead to changes in the genetic architecture that underlies body-size variation.

So, we asked, could the island rule be an explanation for small size of Homo floresiensis and Homo luzonensis? We thought probably yes.

Excavations in 2009 at Liang Bua cave, where Homo floresiensis was found. Image via AP Photo/Achmad Ibrahim.

Modeling generations on the island

The Hobbit’s most likely ancestor is Homo erectus, a species more than twice its size in terms of its brain and overall bulk. Based on the geological history of Flores and the oldest known fossils of Homo floresiensis, it seems the evolution of the new species must have occurred in less than about 300,000 years.

As evolutionary biologists, we are acquainted with the idea that Darwinian evolution is a slow and gradual process that takes place over very long timescales. Could such drastic change in body size happen this fast?

So our interdisciplinary research team developed a computer model to try to answer this basic question. It’s like a computer game that simulates body size evolution under biologically and ecologically realistic scenarios.

In our model, individuals colonize the island, grow to their adult body size according to how much food is available, give birth to a number of young and die. The basic rule of the game is that individuals that are closer to the “optimum” body size for the island in that moment will leave more descendants. Offspring inherit genes for large or small body size.

Generation after generation, new mutations may appear in the population and shift body size toward either higher or lower values. Occasionally, new individuals might even invade the island and mix with the residents. Another basic rule is that the initial small population cannot grow above the number the island’s resources might sustain.

Our colleagues, Earth systems scientists Neil Edwards and Phil Holden, used paleoclimatic data to tweak our model. Hotter and wetter times can support more people on the island, and would influence optimum body size at any given moment.

We started our simulations assuming that large-bodied Homo erectus arrived at the island and then evolved into a smaller species there. Since we just don’t know the exact numbers our model should crank through, we based them on estimates obtained from current human populations.

Because of this uncertainty, we ran our model thousands of times, each time using a random combination of all the parameters. Ultimately we were able to build a statistical distribution of how long it took for Homo erectus to become as small as Homo floresiensis.

A new species, in the blink of an evolutionary eye

After running 10,000 simulations, we were surprised to discover that in less than 350 generations, the process was complete. Thinking in terms of years, assuming a young female delivers a first baby at the average age of 15, that translates to about 10,000 years.

That may seem long for you and me. But from an evolutionary perspective, that’s the blink of an eye – a little more than a thousandth of Homo evolutionary history.

Of course we do not expect that all the features that make Homo floresiensis as unique as it is evolved that fast and at the same time. Yet, our simulation still shows, 300,000 years is far more than enough time for a new human species to arise.

Our work supports the idea that fast evolution is quite plausible under a realistic set of ecological parameters, and that natural selection may be a powerful force influencing body size on islands. And if Homo floresiensis is indeed a product of the island rule, she shows – yet again – that we humans tend to obey the same overall rules driving evolution in many other mammals.

The Conversation

José Alexandre Felizola Diniz-Filho, Professor of Ecology and Evolution, Universidade Federal de Goias and Pasquale Raia, Associate Professor of Paleontology and Paleoecology, University of Naples Federico II

This article is republished from The Conversation under a Creative Commons license. Read the original article.

Bottom line: New research suggests that the tiny human species nicknamed ‘Hobbit’ evolved its small size remarkably quickly while living on an isolated island.


from EarthSky https://ift.tt/2MMi92B

UFO cloud

Cloud shaped like a spaceship in a blue sky.

Image via Karen Racette.

It looks a lot like a UFO … but it’s what’s called lenticular cloud. These lens-shaped clouds typically form where stable, moist air flows over a mountain, and they can appear and disappear quickly. Karen Racette captured this one floating over Butte, Montana on October 7, 2019.

More photos of lenticular clouds, plus a word about how they form.


from EarthSky https://ift.tt/2MIqogc

Bright star Deneb transits at nightfall

In mid-October each year, the northernmost star of the Summer Triangle, Deneb, transits or climbs to its highest point in the sky at or near 7 p.m. local time (8 p.m. local daylight saving time). What does that mean for skywatchers? Only that this noteworthy star – this beloved member of the Summer Triangle – is shifting ever-westward in our sky as Earth travels around the sun. Its transit at nightfall is a hallmark of the year, marking a shift toward winter – or summer – on your half of the globe.

When the sun or a star transits, it resides at one of three places: at zenith (straight overhead), north of zenith or south of zenith.

At 45 degrees north latitude (St. Paul, Minnesota, or Turin, Italy), Deneb shines straight overhead when it transits.

At 40 degrees north latitude (Denver, Colorado, or Philadelphia, Pennsylvania), Deneb soars to its highest point (about 5 degrees north of zenith) roughly one and one-half hours after sunset, or as evening dusk gives way to nightfall.

The meridian is the imaginary semicircle that arcs across the sky from due north to due south. The sun or any star climbs to its highest point for the day when it crosses your meridian.

At temperate latitudes in the Southern Hemisphere, where it’s now springtime, Deneb transits at or near the same hour by the clock (near 7 p.m. local time). Yet, the sun sets later by the clock at more southerly latitudes, so in the Southern Hemisphere, Deneb at this time of year actually transits at evening dusk, instead of nightfall.

Click here to find out when the sun and Deneb transit in your sky.

At more northerly or southerly latitudes, Deneb either transits to the north or to the south of the zenith point. Appreciably south of 45 degrees north latitude, Deneb lies to the north of the zenith point when it transits; conversely, when Deneb transits at latitudes appreciably north of 45 degrees north latitude, Deneb is viewed in the southern sky.

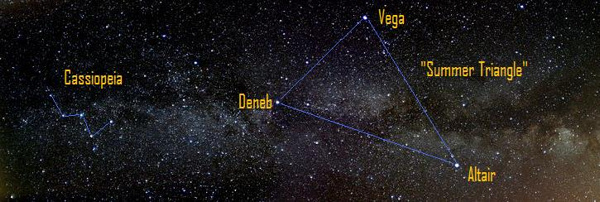
Two brilliant stars – Vega and Altair – team up with Deneb to complete the humongous Summer Triangle. The luminous Summer Triangle asterism, or star formation, can often be seen in a twilight sky or even from a light-polluted city.

The Great rift of the Milky Way passes through the constellation Cassiopeia and the Summer Triangle. Click here for a larger photo

From mid-northern latitudes, the far-northern stars Deneb and Vega are seen at the “top” of the Summer Triangle whereas the southernmost star Altair is seen at the “bottom.” From the Southern Hemisphere, it’s the other way around: Altair reigns at top and Deneb at bottom. It’s a matter of perspective.

Vega, the Summer Triangle’s westernmost star, is seen to the right of Deneb from mid-northern latitudes. From the Southern Hemisphere, on the other hand, Vega lies to the left of Deneb.

Around the world, the stars of the Summer Triangle transit some four minutes earlier with each following day (or two hours earlier with each following month). So, from northerly latitudes, the Summer Triangle is destined to shift over into the western sky at nightfall as autumn ebbs toward winter … or, for those in the Southern Hemisphere, as spring blooms into summer.

Bottom line: As darkness falls in mid-October, the star Deneb shines at the apex of the sky at mid-northern latitudes.

Enjoying EarthSky so far? Sign up for our free daily newsletter today!


from EarthSky https://ift.tt/35CL5mu

Disappearing Peruvian glaciers

Two photos taken from the same location 15 years apart shows the extent of glacier retreat on world’s largest tropical ice cap at Quelccaya, Peru. Image via Doug Hardy.

A new study that looked at glacier loss over all Peruvian mountain ranges reports a reduction of almost 30 percent in the area covered by glaciers between 2000 and 2016.

Tropical glaciers exist around the equator at altitudes higher than 13,000 feet (4,000 meters), and Peru is home to 92% percent of all areas covered by glaciers in the tropics.

The study, published September 30, 2019 in the journal The Cryosphere, used satellite data to measure the changes in glaciers across the Peruvian Andes Mountains between 2000 and 2016. The researchers identified a glacial retreat of 29% for the period – an area roughly equivalent to 80,000 soccer fields. In addition, they found that of 1,973 glaciers that existed at the start of the study period, 170 have disappeared completely. They observed a rate of retreat for the period 2013 to 2016 almost four times higher than in the years before.

Snow-capped mountains.

Tropical glaciers exist in the high altitudes of more than 4,000 meters around the equator. Peru is home to 92% of all glaciated areas in the tropics. Image via Thorsten Seehaus.

EarthSky’s 2020 lunar calendars are here! Get yours today. They make great gifts. Going fast.

Peru’s glaciers are a valuable source of water. They store precipitation in the form of snow and ice and release it again in the form of meltwater during the dry season. They supply drinking water, ensure that the rivers continue to flow and supply water to the hydroelectric power plants. But the researchers forecast that the maximum amount of water which can be obtained from the melting ice has already been exceeded in certain areas of the Andes.

For individual mountain ranges in the Andes, such as the Cordillera Blanca, an acceleration of the glacier retreat has been reported since the 1980s. Image via Matthias Braun.

The retreat of glaciers also increases the risk of natural hazards, said the scientists, such as when swollen meltwater lakes flood downstream communities. According to a statement about the research:

The water is often held back by the former terminal moraines left by the glacier. If ice or rock avalanches end in the lake or the ice at the core of the moraines melts or erodes, the dam can break or overflow. This leads to the glacial lake emptying without warning, sending a destructive flood wave down the valley. A flood wave such as this destroyed a third of the town of Huaraz in 1941. In the Cordillera Blanca, glacier-related natural disasters claimed more than 25,000 victims between 1941 and 2003. It follows that tracking changes in glaciers is also important from a civil protection point of view. Doing so allows countermeasures to be taken in good time, for example the reinforcement of dams or the controlled draining of water from glacial lakes.

The considerably higher rate of shrinkage in glaciers between 2013 and 2016, the researchers said, correlates with the intense El Niño activities experienced at that time. Typical climate variations triggered by El Niño in the Peruvian Andes are an increased temperature, a reduction in precipitation and a delayed rainy season. These factors, they said, lead to increased glacial melting.

Source: Changes of the tropical glaciers throughout Peru between 2000 and 2016 – mass balance and area fluctuations.

Via University of Erlangen-Nuremberg

Bottom line: A new study on glaciers in the Peruvian Andes reports a loss of almost 30% between 2000 and 2016.


from EarthSky https://ift.tt/32fWtm4

Venus from now to next June

Chart of curved track in the sky with the planet increasing in size and changing phase along it.

View larger. | Chart by Guy Ottewell, and via his blog.

Reprinted with permission from Guy Ottewell’s blog.

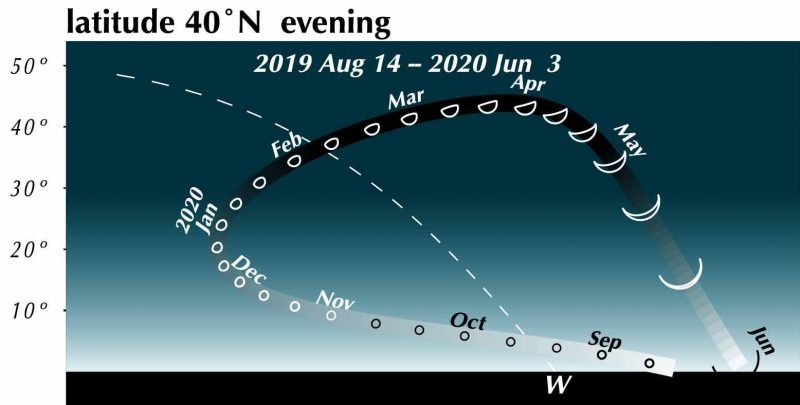
Venus is creeping out into a great evening apparition from August 2019 to June 2020. It’s of the type that – as Eric David reminded us in his comment on my October 12 post – will end with a very close passage in front of the sun: the close passage that produced the famous Venus transits of the past. The chart above shows Venus as it appears above the sunset horizon over the whole of this evening apparition, as seen from latitude 40 degrees north.

The sunlit disks of Venus are exaggerated 480 times in size, otherwise they would all be dots too small to see. You can think of each as what you would see through your binocular or telescope.

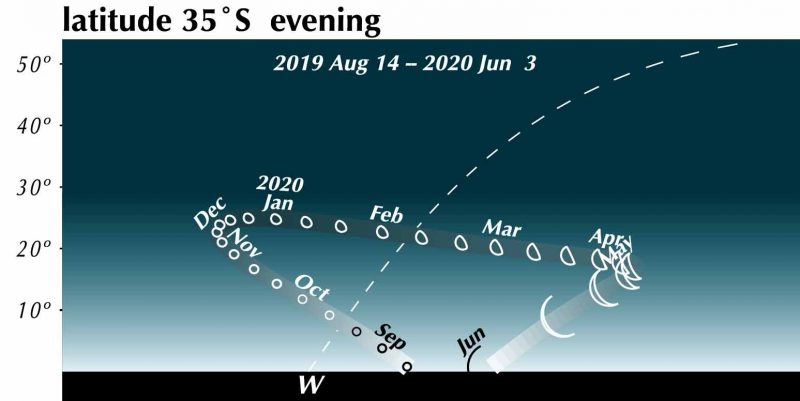
And here is how the same scene will appear, very differently, from 35 degrees south, a latitude roughly suiting Buenos Aires, South Africa, Australia, and New Zealand:

Chart of flatter curved track in the sky with the planet increasing in size and changing phase along it.

View larger. | Chart by Guy Ottewell, and via his blog.

The dashed line is the celestial equator, which for northern locations slopes up leftward from the sunset horizon, rightward for southern locations. No other features, such as the sun, stars, or the ecliptic, can be included, because in diagrams of this kind, based on altazimuth difference from the west point on the horizon, they are in different positions for every date. Venus is always on or near the ecliptic.

This type of apparition occurred eight years ago, and 16, and so on, in the eight-year Venus cycle. And in those two previous incarnations it resulted in the transits.

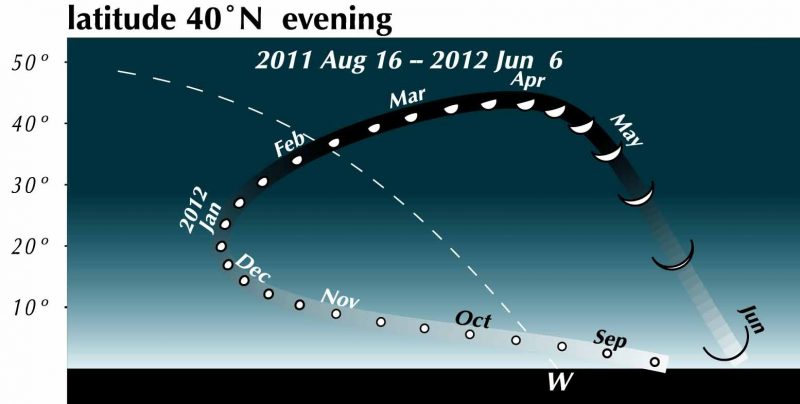
Here is the apparition that began eight years back from now:

Chart of Venus's curved track through the sky with increasing size and phase changes.

View larger. | Chart by Guy Ottewell, and via his blog.

The Venuses are at slightly different points along the path, because I choose to show them at days 1, 11, and 21 of each month. The path itself seems identical – on this small scale. But it isn’t quite. In June 2012 it crossed the northern half of the Sun. In June 2019, it will pass slightly farther north, missing the Sun. No more Venus transits, till they begin again with a very marginal one in 2117.

In this picture the Venus shapes are filled, instead of being outlines. I could use advice on which style you find clearer.

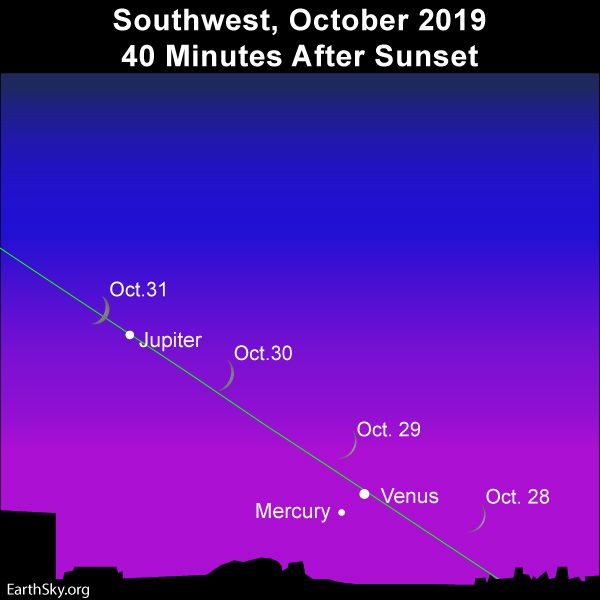
Editor’s Note: But all of us should be able to see Venus by late October, when the waxing crescent moon will sweep near it in the sky, as shown on the chart below:

The lunar calendars are here! Get your 2020 lunar calendars today. They make great gifts. Going fast!

Crescent moon positions on slanted green ecliptic line with three planets.

The young moon will swing through in the vicinity of the planets Mercury, Venus and Jupiter in late October 2019. The above chart is for North American mid-northern latitudes. Click here for more information plus a Southern Hemisphere sky chart.

Bottom line: The bright planet Venus will appear between October 2019 and June 2020. Its changing size and phase can be seen through binoculars or a small telescope.

See this same sky scene animated: Venus from late 2019 to early ’20


from EarthSky https://ift.tt/2IRF8s2

Watch after sunrise for a daytime moon

Image at top: Stefanie Bush caught the moon just after full – in the midst of anticrepuscular rays – over Lake Hollingsworth in Lakeland, Florida. She caught this image with an IphoneX and wrote:

I found it to be really lovely.

And so it is. This week is a wonderful opportunity for all of us to see a daytime moon. The Northern Hemisphere’s full Hunter’s Moon has passed. The moon is now in a waning gibbous phase, rising in the east later and later each evening. That means you can catch the moon over your eastern horizon before going to bed, and then over the western horizon after sunrise in the coming days.

When is the best time to see the moon in the sky during daylight hours? The answer is that the daytime moon is up there much of the time, but, because it’s pale against the blue sky, it’s not as noticeable as the moon at night. The most noticeable moon at night is a full moon. The recent full moon was on October 13 at 21:08 Universal Time; translate to your time zone. That means the time is now to catch a daytime moon, in the west in the morning.

The 2020 lunar calendars are here! Order yours before they’re gone. Makes a great gift.

The moon swings close to the Pleiades star cluster and the star Aldebaran.

Watch for the moon to light up your eastern sky at evening and then the western sky after sunrise.

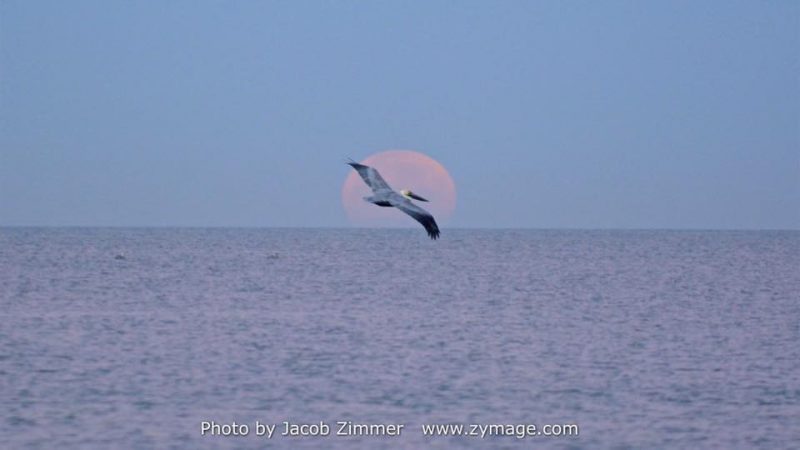
Jacob Zimmer caught this daytime moon from Clearwater Beach, Florida.

Every full moon rises around sunset and sets around sunrise. But now the moon is in a waning gibbous phase – rising later each night – and setting in the west later each day after sunrise.

So, in the several mornings after full moon – after sunrise – look for the waning gibbous moon in the west during the morning hours. At mid-northern latitudes in North America, the moon will set about 1 1/2 hours after sunrise this morning (October 15, 2019), and will set one hour later each day thereafter.

These recommended almanacs can help you find the moon’s setting time in your sky

Marcy Fisher in Ocala, Florida, wrote of this daytime moon: “It was a nice, beautiful surprise.”

By the way, the moon is up during the day half the time. It has to be, since it orbits around the whole Earth once a month. A crescent moon is hard to see because it’s so near the sun in the sky. At the vicinity of last quarter moon about a week from now, you might have to crane your neck, looking up, to notice it after sunrise.

Ordinarily, we don’t look up to see the waning last quarter moon and waning crescent after sunrise. That’s one reason why people so often miss the moon during the day.

Day by day, the lighted portion of the waning gibbous moon will shrink and the half-lit last quarter moon will come on October 21. Watch for the daytime moon to climb higher and higher into the western sky after sunrise all this coming week!

Daytime moon Dec. 18, 2010

Daytime moon captured by Brian Pate. Used with permission.

Look for the moon in your eastern sky before going to bed this evening, on October 15, and then seek for the moon in your western sky after sunrise October 16.

Bottom line: Starting around October 15 or 16, 2019, look for the daytime moon in the west after sunrise.

Donate: Your support means the world to us


from EarthSky https://ift.tt/2PVUVYb

It’s been 20 years since the Day of 6 Billion

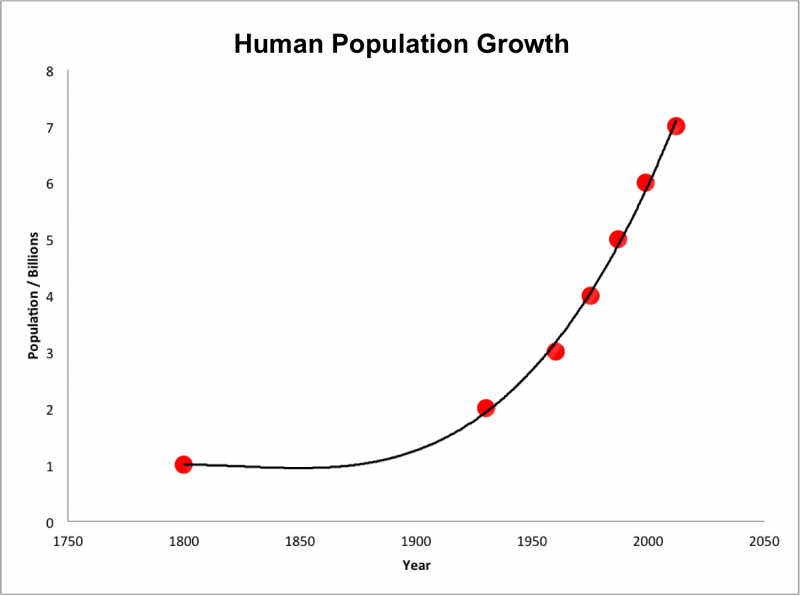
Chart showing a steep rise in human population, beginning around mid-20th century.

Human population growth from 1800 to 2000, via Wikimedia Commons.

October 12, 1999. The United Nations Population Fund (UNFPA), marked this date as the Day of 6 Billion. That’s because – on October 12, 1999 – the world’s human population was estimated to hit 6 billion, according to the United Nations. It took hundreds of thousands of years for Earth’s human population to reach 1 billion in 1804. The 3 billion milestone came in 1960. Not quite 40 years later, global population had doubled to 6 billion.

In 2011, global population reached 7 billion mark. Today – October 12, 2019 – it stands at more than 7.7 billion.

Population experts did not agree on the exact date that world population reached the six billion milestone, of course, but they came close. For example, the U.S. Census Bureau set the date just a few months earlier, to June 18 or June 19, 1999. These numbers are estimates, after all.

Human population is still growing, and, in fact, it’s growing slightly faster than experts a few years ago thought it would. Driven by growth in developing countries, population is now expected to reach around 8.5 billion in 2030, 9.7 billion in 2050, and 10.9 billion in 2100. These numbers represent a mid-range. Some projections are higher, or lower.

These estimates come from the UN report World Population Prospects 2019.

According to a June 17, 2019 article by the Pew Research Center, Earth’s human population growth is projected to nearly stop growing by the end of this century. The article explains:

For the first time in modern history, the world’s population is expected to virtually stop growing by the end of this century, due in large part to falling global fertility rates, according to a Pew Research Center analysis of new data from the United Nations.

By 2100, the world’s population is projected to reach approximately 10.9 billion, with annual growth of less than 0.1% – a steep decline from the current rate. Between 1950 and today, the world’s population grew between 1% and 2% each year, with the number of people rising from 2.5 billion to more than 7.7 billion.

Pew has also provided 11 key takeaways from the UN’s World Population Prospects 2019. We list the highlights here. Go to Pew’s page to read more about each of the takeaways listed here:

1. Global fertility is falling as the world is agingThe global fertility rate is expected to be 1.9 births per woman by 2100, down from 2.5 today.

2. The world’s median age is expected to increase to 42 in 2100, up from the current 31 – and from 24 in 1950.

3. Africa is the only world region projected to have strong population growth for the rest of this century.

4. Europe and Latin America are both expected to have declining populations by 2100.

5. The population of Asia is expected to increase from 4.6 billion in 2020 to 5.3 billion in 2055, then start to decline.

6. In the Northern America region, migration from the rest of the world is expected to be the primary driver of continued population growth.

7. By 2100, five of the world’s 10 largest countries are projected to be in AfricaSix countries are projected to account for more than half of the world’s population growth through the end of this century, and five are in Africa.

8. India is projected to surpass China as the world’s most populous country by 2027.

9. Between 2020 and 2100, 90 countries are expected to lose population.

10. Africa is projected to overtake Asia in births by 2060.

11. The Latin America and Caribbean region is expected to have the oldest population of any world region by 2100, a reversal from the 20th century.

Read more, and find lots more charts and graphs, via the Pew Research Center: World’s population is projected to nearly stop growing by the end of the century

Bottom line: On October 12, 1999, global human population was estimated to hit 6 billion, according to the United Nations. UNFPA, aka the United Nations Population Fund, marked this date as the Day of 6 Billion.


from EarthSky https://ift.tt/2MbgrIY