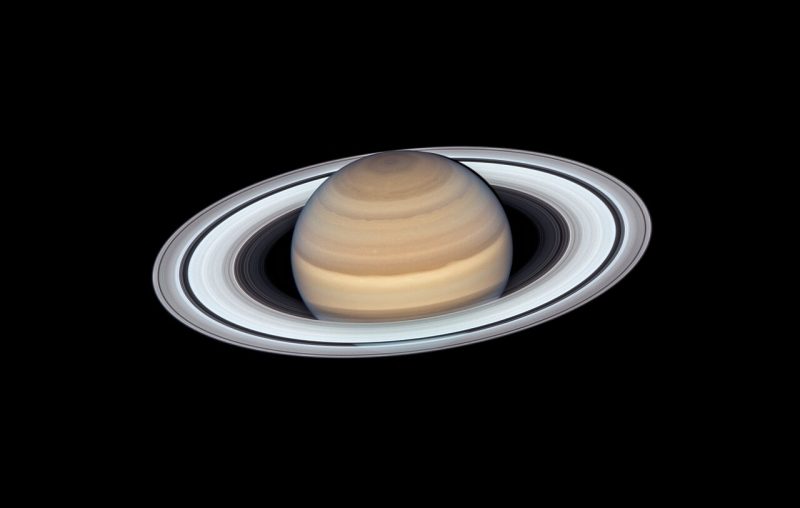
Saturn is still in the evening sky. Click here for EarthSky’s planet guide.
from EarthSky https://ift.tt/2ZRrz5D
Saturn is still in the evening sky. Click here for EarthSky’s planet guide.
from EarthSky https://ift.tt/2ZRrz5D
Saturn is still in the evening sky. Click here for EarthSky’s planet guide.
These next several nights – September 12, 13 and 14, 2019 – look for a full-looking moon to light up the nighttime sky from dusk till dawn. Depending on where you live worldwide, this upcoming full moon will fall on Friday, September 13, or Saturday, September 14. For the Northern Hemisphere, this September full moon counts as the closest full moon to the September autumn equinox, so it’s the Northern Hemisphere’s full Harvest Moon.
Read more: Two Friday the 13ths in 2019
In the Southern Hemisphere, the September equinox ushers in their spring season. Therefore, the Southern Hemisphere’s autumn equinox will come six months later, on March 20, 2020. And the full moon on March 9, 2020, will be the Southern Hemisphere’s Harvest Moon – the full moon closest to their autumn equinox.
Although the moon appears full to the eye for a few to several days in succession, it is only truly full for a fleeting instant. Astronomically speaking, the moon is full at the moment that it’s exactly 180 degrees opposite the sun in ecliptic longitude. This moment falls on September 14, at 04:33 Universal Time.
The full moon occurs at the same instant worldwide, but the local clock time varies by time zone. At time zones in the mainland United States, the full moon falls on Saturday, September 14, at 12:33 a.m. EDT – yet on Friday, September 13 at all other U.S. times – at 11:33 p.m. CDT, 10:33 p.m. MDT and 9:33 p.m. PDT. The last time that the Northern Hemisphere’s full Harvest Moon fell on a Friday the 13th (for at least a portion of the world) was in the year 1935, and the next time won’t be until the year 2171.
Visit Sunrise Sunset Calendars to find out when the moon turns full in your time zone, remembering to check the Moon phases box.
By Universal Time, the last time the full moon fell on Friday the 13th was on June 13, 2014, and the next time will have to wait until August 13, 2049. In the 21st century (2001 to 2100), a full moon falls on Friday the 13th for a total of eight times (by Universal Time).
Read more: When does Friday the 13th have a full moon?
The full moon occurring most closely to the autumnal equinox (the Northern Hemisphere’s September equinox/Southern Hemisphere’s March equinox) enjoys the designation of Harvest Moon. By Universal Time, the full Harvest Moon will come on September 14, 2019, in the Northern Hemisphere – and to the Southern Hemisphere on March 20, 2020.
There is no Harvest Moon at the equator and not enough of one to say so in the tropical regions of the globe. You really have to be well north (or south) of the tropics to observe the year’s grandest parade of moonlit nights around the time of the autumn equinox. The farther north or south of the Earth’s equator you live, the longer the procession of moonlit nights accompanying the Harvest Moon.
The term Harvest Moon might be of European origin, because northern Europe is much closer to the Arctic than the tropics. Before the advent of artificial lighting, people planned nocturnal activity around the moon, knowing the moon provides dusk-till-dawn moonlight on the night of the full moon. But farmers of old were also aware that the Harvest Moon – the closest full moon to the autumn equinox – could be relied upon to provide dusk-till-dawn moonlight for several days in a row at mid-temperate latitudes, or even as long as a week straight at far-northern latitudes.
This bonanza of moonlight in the season of waning daylight remains the legacy of the Harvest Moon. The Harvest Moon distinguishes itself from other full moons with several nights of dusk-till-dawn moonlight.
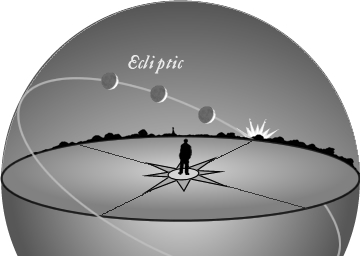
At the vicinity of full moon, the moon stays more or less opposite the sun throughout the night. A full moon (or nearly full moon) rises in the east around sunset, climbs highest up for the night around midnight and sets in the west around sunrise. In this respect, this applies to any full moon at any season of the year.
Yet this closest full moon to the September equinox displays special characteristics for both the Northern and Southern Hemispheres. From around the world, the September full moon rises pretty much eastward. Again, from both the Northern and Southern Hemispheres, you’ll find the moon rising farther and farther north along your eastern horizon each evening for the next week or so. Don’t know which way is north? No problem. As you stand facing eastward, north is to your left.
On the average, the moon rises 50 minutes later each day. For us in the Northern Hemisphere, however, the northbound moonrises following the September full moon reduce the lag time between successive moonrises to a yearly minimum. In the Southern Hemisphere, these more northern moonrises increase the lag time between successive moonrises to a yearly maximum.
Check out the chart below.
From 40 degrees north (Denver, Colorado; Philadelphia, Pennsylvania; Beijing, China), the moon now rises some 25 (instead of 50) minutes later daily. From Anchorage, Alaska (just north of 60 degrees north latitude), the moon rises about eight minutes later daily.
The higher the latitude, the greater the Harvest Moon effect – the effect of no great lag time between sunset and moonrise – in the season of waning daylight.
By the way, this full moon is also being called a micro-moon or mini-moon because it’s the farthest (and therefore the smallest) full moon of the year. This full moon comes one fortnight (approximately two weeks) after the new moon supermoon on August 30, 2019, and one fortnight before the new moon supermoon of September 28, 2019.
Four years ago, the Harvest Moon of September 28, 2015, presented the closest (and therefore the largest) full moon of 2015.
Read more: Super Blood Moon eclipse on September 28, 2015
The September 2019 full moon is the nearest full moon to the September equinox; yet, at the same time, it’s the farthest full moon of the year.
Bottom line: The Harvest Moon – closest full moon to the September equinox – falls on Friday, September 13, in 2019.
Plastic pollution is now in the fossil record, according to new research from the Scripps Institution of Oceanography at the University of California San Diego. For the study, which was published September 4, 2019, in the journal Scientific Advances, scientists studied layers of earth in California’s Santa Barbara Basin dating back to 1834. They found that deposits of plastic have increased exponentially since the end of World War II, doubling around every 15 years.
Most of the plastic particles were fibers from synthetic fabrics used in clothes, said the researchers, suggesting that plastics are flowing into the ocean via waste water.
The increase of plastics in the sediments matches a rise in the rate of plastic production worldwide and a surge in California’s coastal population during the same time period. Jennifer Brandon of Scripps is the study’s lead author. She said in a statement:
This study shows that our plastic production is being almost perfectly copied in our sedimentary record. Our love of plastic is actually being left behind in our fossil record.
Brandon also told The Guardian:
It is a very clear signature. Plastic was invented and pretty much immediately we can see it appear in the sedimentary record.
The researchers analyzed annual sediment layers, collected from a core sample, that they dated back to 1834, looking for microplastics – tiny bits of plastic than 5 millimeters long (or about the size of a sesame seed) in the core sample layers. Most plastics were invented in the 1920s, but not used in significant commercial quantities until after World War II. The researchers found plastic in sediment dated to 1945, with the amount later increasing rapidly, so that by 2010 (when the samples were collected), people were depositing 10 times as much plastic into the basin as they were before World War II. The researchers said that the postwar period also showed a greater diversity of plastics, including fragments of plastic bag materials and plastic particles in addition to fibers.
Brandon suggested that the study results support the idea of using plastic accumulation as a defining signifier of the Anthropocene, a proposed new geological epoch marked by humanity’s influence on Earth. Specifically, Brandon said, the rise of plastics beginning in 1945, when the world recovered from war, could serve as a proxy for a time period within the Anthropocene that scientists have labeled the Great Acceleration, a period when humanity’s impact on our planet is increasing significantly. Brandon told The Guardian:
We all learn in school about the Stone Age, the Bronze Age and Iron Age. Is this going to be known as the plastic age?
It is a scary thing that this is what our generations will be remembered for.
Bottom line: New research suggests that plastics have entered Earth’s fossil record.
Source: Multidecadal increase in plastic particles in coastal ocean sediments
Via Scripps Institution of Oceanography
Our ambition is that 3 in 4 people will survive their cancer by 2034. And while cancer outcomes may differ from country to country, the goal of improving cancer survival is one that’s reflected across the world.
A good way for countries to monitor their progress in improving cancer care is by comparing how many people get cancer (incidence), how many survive (survival) and how many die from their cancer (mortality) to see how they measure up. If survival is higher, and incidence and mortality are lower, it’s clear that a country is on the right track.
“No one country manages cancer perfectly,” says John Butler, a consultant specialising in gynaecological cancer surgery. “ But international studies enable countries to learn lessons from one another to with the aim of improving their own cancer policies.”
And in the latest study, published in Lancet Oncology by the International Cancer Benchmarking Partnership, some promising trends have emerged. Survival has improved for the 7 cancer types studied in all countries between 1995 and 2014.
But the figures also underline how much progress still needs to be made in the UK to equal the best outcomes globally. With the exception of ovarian and oesophageal, the UK has the lowest survival figures for the cancers studied.
Big, international studies like this are a task for the International Cancer Benchmarking Partnership (ICBP). Led by clinicians, researchers and policymakers from around the world, the team compare trends in cancer survival, incidence and mortality rates across seven countries with similar healthcare systems: UK, Australia, Canada, New Zealand, Denmark, Norway and Ireland. Something that’s never been done before.
Comparisons like this can be tricky – mainly because countries collect and record data in slightly different ways, something the ICBP is looking at in more detail. But despite the challenges, the latest figures from the ICBP are the best available and will only get better as more analysis is done.
The team has been collecting data from seven cancer types – ovary, lung, colon, rectum, pancreas, oesophagus and stomach – since 1995.
And the latest figures, covering 1995 to 2014, reveal some stark differences in cancer survival between countries. Generally, cancer survival is higher in Australia, Canada and Norway than in Denmark, Ireland, New Zealand and the UK.
Similar trends can be seen for individual cancer types, like lung cancer. From the graphs we can see that Australia has the highest lung cancer survival, and Ireland has made the greatest increase in survival over time. But despite big improvements in lung cancer survival, the UK remains bottom of the list for this cancer type.
There are many, complex reasons that could explain why we have lower survival compared to other countries.
Butler, the lead clinical advisor for ICBP, says there are some factors that will affect survival in all cancer types. “The UK health system is under great pressure, with increasing demands on cancer diagnostics and more urgent referrals”. And that could affect survival figures. Diagnosing and treating cancer early gives patients the best chance of surviving their cancer, but it relies on having enough NHS staff and funding in place to make this a reality – something the NHS doesn’t currently have.
But there are also more specific reasons that may explain differences between countries for some cancers.
Take ovarian cancer for example. Patients diagnosed in the UK appear to be diagnosed at similar stages to other countries, but survival is lower. This suggests there could be improvements in how these patients are treated.
And as Butler elaborated, this is amplified in older patients.
Older patients are more likely to have other health problems, which often make it more challenging to perform surgery or deliver chemotherapy. More is needed to be done to understand these patients’ complex needs and improve treatments for them, as we’ve blogged about before, as well as to understand why this is an issue particularly for the UK.
But when looking at survival as a whole, it’s useful to consider where we started. In 1995, the UK had some of the lowest survival estimates of the seven countries studied. This means that even though we have made improvements in certain cancers, we’re starting from a lower baseline. Which makes it that much harder for us to catch up with the countries who have higher survival.
And it’s where comparing our progress to other countries can help.
Denmark was in a similar place to the UK with their survival in 1995. But as Jesper Fisker, chief executive officer of the Danish Cancer Society, told us “There’s been great progress in Danish cancer survival – which is the result of massive efforts and investments in the cancer field over the past 20 years”.
They’ve also made major strides towards centralising their cancer services, meaning cancer patients are treated in fewer, more specialised centres, with the best clinicians for their cancer type.
And it’s paid off – Denmark has seen real improvements in cancer survival – such as increasing their 1-year survival of lung cancer from 27.5% to 46.2% (from 1995-1999 to 2010-2014). The UK has made similar efforts to improve cancer services, with some success, but much more needs to be done.
And it’s not quite as straightforward as it sounds. While Denmark has made big improvements overall, this has not been universal for every cancer type. The same is true for all the countries studied and it’s something the ICBP is working to understand. They’re looking into variations in access people have to diagnostic tests, scans and treatment, as well as differences in healthcare systems that could help to explain the disparity.
On the bright side, the UK has made particularly good progress in increasing cancer survival in rectal, ovarian, and oesophageal cancers.
For example, from 1995-1999, 48 in 100 patients were estimated to survive their rectal cancer for 5 years. This has now increased to 62 in 100 patients for 2010-2014, only 8.7% behind Australia, who had the highest rectal cancer survival of the countries studied.
Butler called the progress “encouraging” and said there were lots of factors that could be behind the improvements. The UK produced its first national cancer plan in 2000 and appointed a national cancer director, who helps provide advice and leadership for our cancer services. Since then there’s been more guidance and greater scrutiny of how cancer services are performing, as well as more funding.
There’s also been a move towards cancers being treated in specialised centres, where there will be more relevant cancer expertise.
But despite the improvements, there’s clearly more work to be done in the UK.
For Butler, investigations into how well cancer services are performing could be a good way to start. For example, national audits in the UK for lung cancer have increased the number of people having surgery, as well as the number of specialised lung cancer surgeons. Replicating this approach could help the NHS direct its efforts to improve outcomes for other types of cancer.
And while the UK government have introduced a range of policies between 1995-2014 to improve cancer services and speed up diagnosis and treatment, these have added to the strain on NHS services.
It’s crucial that investment into cancer services is increased to match the ever-growing demand. As Butler told us, “one of the biggest challenges the UK faces is capacity of diagnostic services.”
>> Join us in telling the Government that enough is enough with NHS staff shortages
Charlotte Lynch is a research officer in the ICBP team at Cancer Research UK
Our ambition is that 3 in 4 people will survive their cancer by 2034. And while cancer outcomes may differ from country to country, the goal of improving cancer survival is one that’s reflected across the world.
A good way for countries to monitor their progress in improving cancer care is by comparing how many people get cancer (incidence), how many survive (survival) and how many die from their cancer (mortality) to see how they measure up. If survival is higher, and incidence and mortality are lower, it’s clear that a country is on the right track.
“No one country manages cancer perfectly,” says John Butler, a consultant specialising in gynaecological cancer surgery. “ But international studies enable countries to learn lessons from one another to with the aim of improving their own cancer policies.”
And in the latest study, published in Lancet Oncology by the International Cancer Benchmarking Partnership, some promising trends have emerged. Survival has improved for the 7 cancer types studied in all countries between 1995 and 2014.
But the figures also underline how much progress still needs to be made in the UK to equal the best outcomes globally. With the exception of ovarian and oesophageal, the UK has the lowest survival figures for the cancers studied.
Big, international studies like this are a task for the International Cancer Benchmarking Partnership (ICBP). Led by clinicians, researchers and policymakers from around the world, the team compare trends in cancer survival, incidence and mortality rates across seven countries with similar healthcare systems: UK, Australia, Canada, New Zealand, Denmark, Norway and Ireland. Something that’s never been done before.
Comparisons like this can be tricky – mainly because countries collect and record data in slightly different ways, something the ICBP is looking at in more detail. But despite the challenges, the latest figures from the ICBP are the best available and will only get better as more analysis is done.
The team has been collecting data from seven cancer types – ovary, lung, colon, rectum, pancreas, oesophagus and stomach – since 1995.
And the latest figures, covering 1995 to 2014, reveal some stark differences in cancer survival between countries. Generally, cancer survival is higher in Australia, Canada and Norway than in Denmark, Ireland, New Zealand and the UK.
Similar trends can be seen for individual cancer types, like lung cancer. From the graphs we can see that Australia has the highest lung cancer survival, and Ireland has made the greatest increase in survival over time. But despite big improvements in lung cancer survival, the UK remains bottom of the list for this cancer type.
There are many, complex reasons that could explain why we have lower survival compared to other countries.
Butler, the lead clinical advisor for ICBP, says there are some factors that will affect survival in all cancer types. “The UK health system is under great pressure, with increasing demands on cancer diagnostics and more urgent referrals”. And that could affect survival figures. Diagnosing and treating cancer early gives patients the best chance of surviving their cancer, but it relies on having enough NHS staff and funding in place to make this a reality – something the NHS doesn’t currently have.
But there are also more specific reasons that may explain differences between countries for some cancers.
Take ovarian cancer for example. Patients diagnosed in the UK appear to be diagnosed at similar stages to other countries, but survival is lower. This suggests there could be improvements in how these patients are treated.
And as Butler elaborated, this is amplified in older patients.
Older patients are more likely to have other health problems, which often make it more challenging to perform surgery or deliver chemotherapy. More is needed to be done to understand these patients’ complex needs and improve treatments for them, as we’ve blogged about before, as well as to understand why this is an issue particularly for the UK.
But when looking at survival as a whole, it’s useful to consider where we started. In 1995, the UK had some of the lowest survival estimates of the seven countries studied. This means that even though we have made improvements in certain cancers, we’re starting from a lower baseline. Which makes it that much harder for us to catch up with the countries who have higher survival.
And it’s where comparing our progress to other countries can help.
Denmark was in a similar place to the UK with their survival in 1995. But as Jesper Fisker, chief executive officer of the Danish Cancer Society, told us “There’s been great progress in Danish cancer survival – which is the result of massive efforts and investments in the cancer field over the past 20 years”.
They’ve also made major strides towards centralising their cancer services, meaning cancer patients are treated in fewer, more specialised centres, with the best clinicians for their cancer type.
And it’s paid off – Denmark has seen real improvements in cancer survival – such as increasing their 1-year survival of lung cancer from 27.5% to 46.2% (from 1995-1999 to 2010-2014). The UK has made similar efforts to improve cancer services, with some success, but much more needs to be done.
And it’s not quite as straightforward as it sounds. While Denmark has made big improvements overall, this has not been universal for every cancer type. The same is true for all the countries studied and it’s something the ICBP is working to understand. They’re looking into variations in access people have to diagnostic tests, scans and treatment, as well as differences in healthcare systems that could help to explain the disparity.
On the bright side, the UK has made particularly good progress in increasing cancer survival in rectal, ovarian, and oesophageal cancers.
For example, from 1995-1999, 48 in 100 patients were estimated to survive their rectal cancer for 5 years. This has now increased to 62 in 100 patients for 2010-2014, only 8.7% behind Australia, who had the highest rectal cancer survival of the countries studied.
Butler called the progress “encouraging” and said there were lots of factors that could be behind the improvements. The UK produced its first national cancer plan in 2000 and appointed a national cancer director, who helps provide advice and leadership for our cancer services. Since then there’s been more guidance and greater scrutiny of how cancer services are performing, as well as more funding.
There’s also been a move towards cancers being treated in specialised centres, where there will be more relevant cancer expertise.
But despite the improvements, there’s clearly more work to be done in the UK.
For Butler, investigations into how well cancer services are performing could be a good way to start. For example, national audits in the UK for lung cancer have increased the number of people having surgery, as well as the number of specialised lung cancer surgeons. Replicating this approach could help the NHS direct its efforts to improve outcomes for other types of cancer.
And while the UK government have introduced a range of policies between 1995-2014 to improve cancer services and speed up diagnosis and treatment, these have added to the strain on NHS services.
It’s crucial that investment into cancer services is increased to match the ever-growing demand. As Butler told us, “one of the biggest challenges the UK faces is capacity of diagnostic services.”
>> Join us in telling the Government that enough is enough with NHS staff shortages
Charlotte Lynch is a research officer in the ICBP team at Cancer Research UK
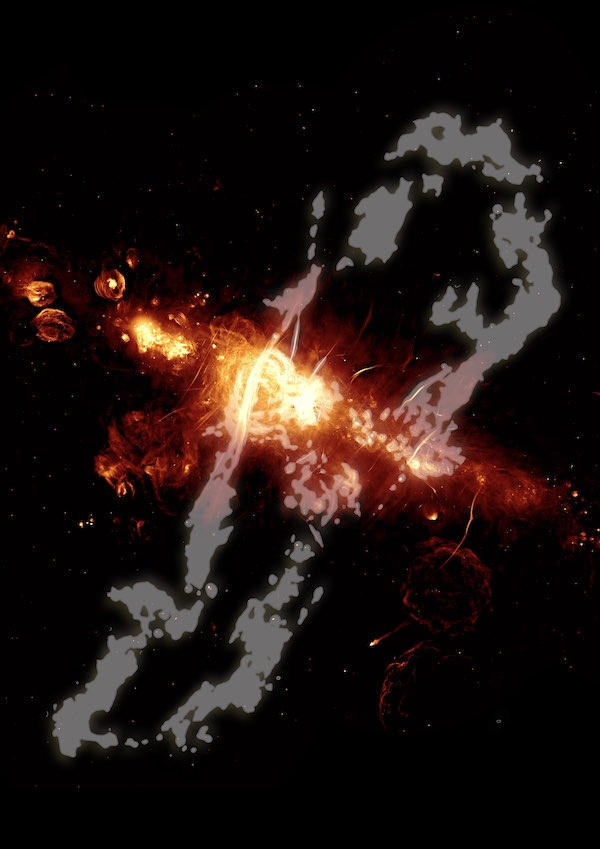
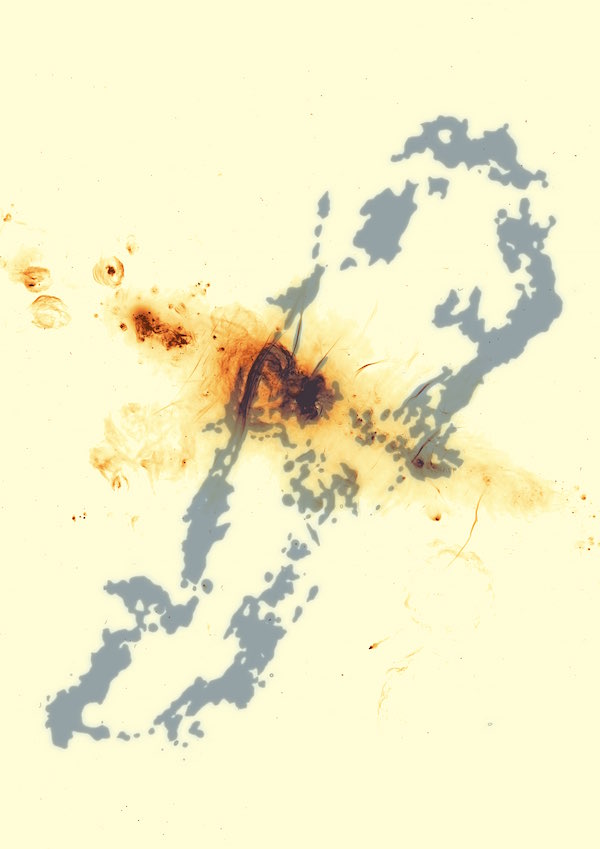
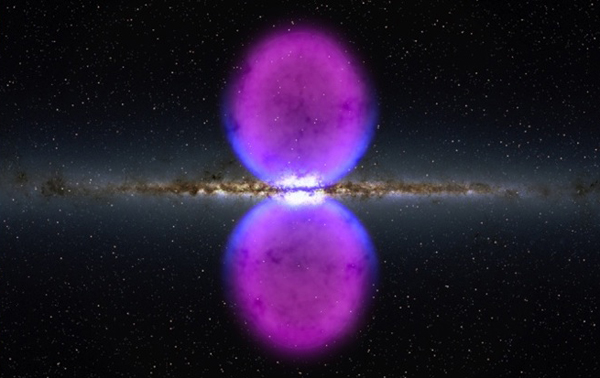
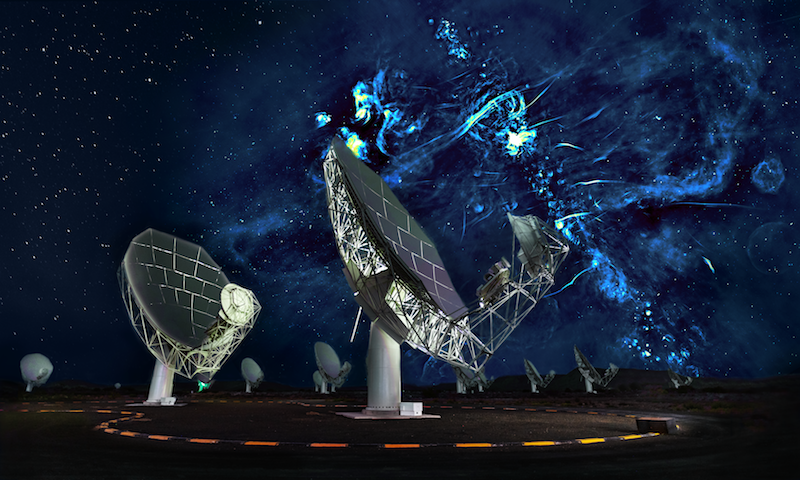
Our Milky Way is considered to be a relatively quiescent galaxy, and yet it’s known to have a 4-million-solar-mass black hole at its heart, which is the source of all sorts of fascinating and dynamic processes. Today – September 11, 2019 – an international team of astronomers announced the discovery of yet another of those processes, which generates what they’re calling “one of the largest features ever observed” in the center of the Milky Way. This feature is a pair of enormous radio-emitting bubbles that tower hundreds of light-years above and below the central region of our galaxy. Some of you might recall the discovery of Fermi Bubbles nine years ago – seen at higher-energy wavelengths of light and extending vastly farther into space – and might wonder how this newly found structure relates. More about that below.
In the meantime, think about this new discovery, published today in the peer-reviewed journal Nature. Like the Fermi Bubbles, scientists describe this new feature as being hourglass-shaped. They said in a statement that it:
… dwarfs all other radio structures in the galactic center [and] is likely the result of a phenomenally energetic burst that erupted near the Milky Way’s supermassive black hole a few million years ago.
In other words, said these scientists, they believe features have formed formed from a violent eruption, presumably emanating from the vicinity of the galactic center and its supermassive black hole, which – over a short period of time – punched through the interstellar medium in opposite directions.
The team of astronomers that made the discovery was led by Ian Heywood of the University of Oxford in England. They used the South African Radio Astronomy Observatory (SARAO) MeerKAT telescope to map out broad regions in the center of the galaxy. They conducted their radio observations at wavelengths near 23 centimeters (about 9 inches), which, they said:
… indicates energy generated in a process known as synchrotron radiation, in which free-floating electrons are accelerated as they interact with powerful magnetic fields. This produces a characteristic radio signal that can be used to trace energetic regions in space. The radio light seen by MeerKAT penetrates the dense clouds of dust that block visible light from the center of our galaxy.
Heywood, who processed the large amount of observational data leading to this result, said:
The center of our galaxy is relatively calm when compared to other galaxies with very active central black holes. Even so, the Milky Way’s central black hole can become uncharacteristically active, flaring up as it periodically devours massive clumps of dust and gas. It’s possible that one such feeding frenzy triggered powerful outbursts that inflated this previously unseen feature.
Unseen? Yes, in the radio part of the spectrum. But there’s another structure previously known by astronomers that may (or may not) be related to the discovery announced on September 11, 2019. And that is the so-called Fermi Bubbles, confirmed by high-energy gamma ray observations in 2010.
I asked one of the authors on this new paper – Fernando Camilo, SARAO Chief Scientist in Cape Town, South Africa – how the new discovery relates to the Fermi Bubbles. He replied by email:
That’s a very good question.
The Fermi bubbles are much larger than the MeerKAT radio bubbles (about 50 times larger: some 75,000 light years in size for Fermi, 1,400 light years for MeerKAT). They are also much more energetic: the amount of energy involved in the event that inflated the MeerKAT bubbles is no more than 1% of the energy content of the Fermi bubbles.
However, they are both huge bi-polar structures, symmetric about the galactic center, near the central supermassive black hole, and so your question does arise.
Our view is that the MeerKAT bubbles may well represent a less energetic version of a process similar to that which created the Fermi Bubbles (the origin of the Fermi bubbles themselves continues to be greatly debated, and I expect that the origin of the MeerKAT bubbles will likewise elicit a range of views).
If that’s the case, the MeerKAT bubbles may well be an example of a series of such intermittent events that occasionally take place near the center of the Milky Way, governed by the black hole, the cumulative effect of which is responsible for other large scale structures seen at higher galactic latitudes (that is, away from the plane of the Milky Way), including structures seen in X-rays and, indeed, the Fermi gamma-ray Bubbles.
Camilo added:
These enormous bubbles have until now been hidden by the glare of extremely bright radio emission from the center of the galaxy. Teasing out the bubbles from the background ‘noise’ was a technical tour de force, only made possible by MeerKAT’s unique characteristics and propitious location in the Southern Hemisphere. With this unexpected discovery we’re witnessing in the Milky Way a novel manifestation of galaxy-scale outflows of matter and energy, ultimately governed by the central black hole.
Bottom line: Radio astronomers have spied a pair of enormous radio-emitting bubbles that tower hundreds of light-years above and below the central region of our galaxy.
Source: Inflation of 430-Parsec Bipolar Radio Bubbles in the Galactic Centre by an Energetic Event
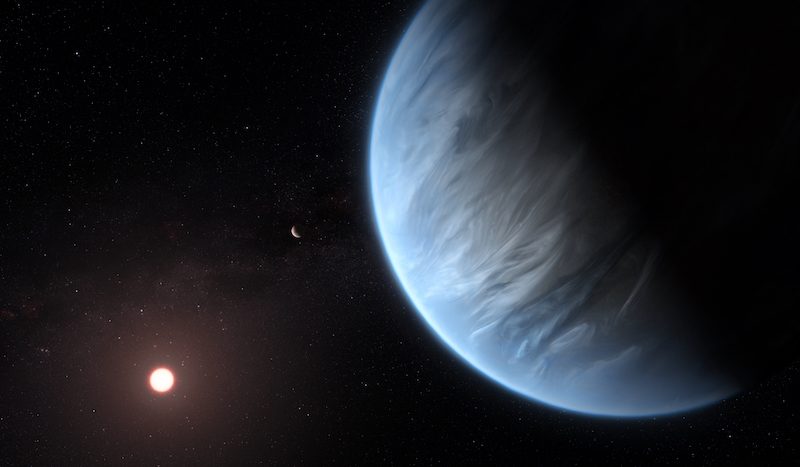
Scientists announced another exciting discovery today (September 11, 2019) regarding potentially habitable exoplanets! For the first time, they’ve detected water vapor in the atmosphere of a distant world, in this case a super-Earth called K2-18b, orbiting a star in the direction of our constellation Leo. A star’s habitable zone is the zone where liquid water might exist. And water is essential for life as we know it. But this is the first-ever actual detection of water vapor for any exoplanet, and this planet does indeed orbit in its star’s habitable zone. That means it also has relatively moderate temperatures, by earthly standards. With confirmed water vapor and habitable temperatures, K2-18b has just become a very intriguing target in the search for life.
The peer-reviewed discovery was published in a paper today (September 11, 2019) in Nature Astronomy, by researchers from University College London (UCL). Another paper (draft version) was also published on ArXiv on September 10, 2019.
The new work marks the first overall successful atmospheric analysis of an exoplanet in the habitable zone of its star. Such studies have proven difficult due to the distances of these worlds and their smaller sizes as compared to gas giants like Jupiter.
According to Angelos Tsiaras at the UCL’s Centre for Space Exochemistry Data (CSED) and first author of the new paper:
Finding water in a potentially habitable world other than Earth is incredibly exciting. K2-18b is not ‘Earth 2.0’ as it is significantly heavier and has a different atmospheric composition. However, it brings us closer to answering the fundamental question: Is the Earth unique?
The analysis of K2-18b’s atmosphere was based on data from the Hubble Space Telescope. In this analysis, the scientists also found atmospheric hydrogen and helium. They believe nitrogen and methane might also be present, but further studies are needed to confirm that, or not. Scientists also need to figure out how cloudy the atmosphere is and how much water vapor there is, percentage-wise. They also think it’s likely that there are water clouds in K2-18b’s atmosphere as well, and possibly even rain. From the second paper:
Given the relatively low irradiation by the star, K2-18b’s temperature is low enough that the detected water vapor can plausibly condense to form liquid droplets. It is therefore possible that liquid water rain precipitates in the mid-atmosphere of K2-18b.
Co-author Giovanna Tinetti said:
Our discovery makes K2-18b one of the most interesting targets for future study. Over 4,000 exoplanets have been detected but we don’t know much about their composition and nature. By observing a large sample of planets, we hope to reveal secrets about their chemistry, formation and evolution.
As Tsiaras added:
This study contributes to our understanding of habitable worlds beyond our solar system and marks a new era in exoplanet research, crucial to ultimately place the Earth, our only home, into the greater picture of the cosmos.
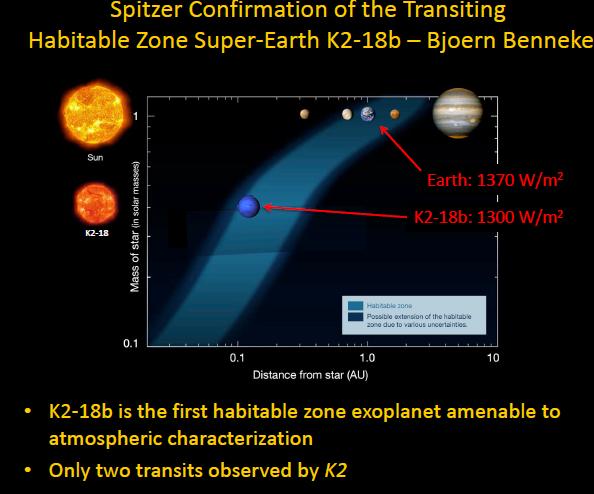
As I mentioned, K2-18b is a super-Earth, a planet larger than Earth but smaller than Neptune. It orbits the red dwarf star K2-18 every 33 days, and is 110 light-years away in the direction of the constellation Leo the Lion. NASA’s Kepler Space Telescope discovered this world in 2015. The actual conditions on the surface of the planet still aren’t known, but its red dwarf star is quite active, meaning that the planet is exposed to ultraviolet radiation that red dwarfs are famous for. However, current studies suggest that K2-18b receives about the same amount of radiation from its star as Earth does from the sun. That would be a good thing for the possibility of life. Still, there are many unknowns when it comes to other factors affecting possible habitability for this world.
A previous study said that the planet is probably either a mostly rocky planet with a small gaseous atmosphere – like Earth, but bigger – or a mostly water planet with a thick layer of ice on top of it. According to Ryan Cloutier, a Ph.D. student in the Université de Montréal Institute for Research on Exoplanets (iREx):
With the current data, we can’t distinguish between those two possibilities. But with the James Webb Space Telescope we can probe the atmosphere and see whether it has an extensive atmosphere or it’s a planet covered in water.
The Webb telescope will also have the capability of analyzing K2-18b’s atmosphere for possible biosignatures, in this case gases like oxygen or methane, that could indicate not just the possibility, but the presence of life. False positives would need to ruled out, however, as both of those gases can also be created without life being involved.
K2-18 also has another super-Earth, K2-18c, but that planet is closer to the star and not likely to be in the habitable zone. It was discovered by Cloutier in 2017.
Kepler and other telescopes have been finding exoplanets by the thousands in recent years, and many of those are super-Earths, like K2-18b. Scientists expect that many more exoplanets will continue to be discovered, some of which will be potentially habitable. As co-author Ingo Waldmann noted:
With so many new super-Earths expected to be found over the next couple of decades, it is likely that this is the first discovery of many potentially habitable planets. This is not only because super-Earths like K2-18b are the most common planets in our galaxy, but also because red dwarfs – stars smaller than our sun – are the most common stars.
Bottom line: The discovery of water vapor in the atmosphere of K2-18b is the first time that water has been found on a potentially habitable super-Earth exoplanet.
Source: Water Vapour in the Atmosphere of the Habitable-Zone Eight Earth-Mass Planet K2-18 b
Source: Water Vapor on the Habitable-Zone Exoplanet K2-18b