Evolution doesn’t proceed in a straight line

Chimpanzee, walking ape, cave man with club, Neanderthal man with spear, blond modern man.

Evolution doesn’t proceed in a straight line. So why draw it that way? Image via Uncle Leo/Shutterstock.com.

By Quentin Wheeler, State University of New York College of Environmental Science and Forestry; Antonio G. Valdecasas, CSIC – Consejo Superior de Investigaciones Científicas, and Cristina Cánovas, CSIC – Consejo Superior de Investigaciones Científicas

Evolution doesn’t follow a preordained, straight path. Yet images abound that suggest otherwise. From museum displays to editorial cartoons, evolution is depicted as a linear progression from primitive to advanced.

You’ve certainly seen the pictures of a chimpanzee gradually straightening up and progressing through various hominids all the way to a modern human being. Yes, they can be humorous. But these kinds of popular representations about evolution get it all wrong.

Logo on a t-shirt. Illustration of band instruments and monkey-to-man sequence.

A high school marching band’s T-shirt places a horn-playing Homo sapiens at the end of the evolutionary process. Image via Brian Kloppenburg, Jordan Summers, Main Street Logo.

As three scholars of biodiversity and biology, these images bother us because they misrepresent how the process of evolution really works – and run the risk of reinforcing the public’s misconceptions.

Climbing a ladder to perfection

This misunderstanding is a holdover from before 1859, the year Charles Darwin first published his scientific theory of evolution via natural selection.

Antique etching of tower of created beings with plants at the bottom and angels at the top.

The scala naturae presents a hierarchy of creation. Image by Retorica Christiana, Didacus Valdes, 1579, via The Conversation.

Until then, the traditional view of how the world was organized was through a “progression in perfection.” This concept is explicit in the idea of the “great chain of being,” or “scala naturae” in Latin: All beings on earth, animate and inanimate, could be organized according to an increasing scale of perfection from, say, mushrooms at the bottom up through lobsters and rabbits, all the way to human beings at the top.

Originating with Plato and Aristotle, this view gets three main things wrong.

First, it holds that nature is organized hierarchically. It is not a random assortment of beings.

Secondly, it envisions two organizing criteria: things progress from simple to perfect and from primitive to modern.

And thirdly, it supposes there are no intermediary stages between levels in this hierarchy. Each level is a watertight compartment of similar complexity – a barnacle and a coral reef on the same rung are equally complex. No one is halfway between two steps.

In the 1960s a variation of the scala naturae conceived by Jesuit philosopher Pierre Teilhard de Chardin became popular. His idea was that, although life is somewhat branched, there is direction in evolution, a progression toward greater cognitive complexity and, ultimately, to identification with the divine, that is, God.

Gradual changes, in every direction

At least since Darwin, though, scientists’ idea of the world is organized through transitions – from inanimate molecules to life, from earlier organisms to different kinds of plants and animals, and so on. All life on Earth is the product of gradual transformations, which diversified and gave rise to the exuberance of organisms that we know today.

Two transitions are of particular interest to evolutionary biologists. There’s the jump from the inanimate to the animate: the origin of life. And there’s the appearance of the human species from a monkey ancestor.

Sequence of monkey, ape-man, photo of standing modern man (the author).

Book covers are just one place you might see a riff on this evolutionary march. Image via Howling at the Moon Press/Amazon.

The most popular way to represent the emergence of human beings is as linear and progressive. You’ve probably seen images, logos and political and social propaganda that draw on this representation.

But none of these representations capture the dynamics of Darwin’s theory. The one image he included in his book “On the Origin of Species” is a tree diagram, the branching of which is a metaphor for the way species originate, by splitting. The absence of an absolute time scale in the image is an acknowledgment that gradual change happens on timescales that vary from organism to organism based on the length of a generation.

A tree with yellow leaves and name of type of creature at the tip of every branch.

Forget a hierarchy – each organism alive now is the most evolved of its kind. Image via Zern Liew/Shutterstock.com.

According to Darwin, all current organisms are equally evolved and are all still affected by natural selection. So, a starfish and a person, for example, are both at the forefront of the evolution of their particular building plans. And they happen to share a common ancestor that lived about 580 million years ago.

Darwin’s theory doesn’t presuppose any special direction in evolution. It assumes gradual change and diversification. And, as evolution is still operating today, all present organisms are the most evolved of their kind.

Antique etching of many life forms with white-bearded bald man in center.

‘Man Is But A Worm’ caricature of Darwin’s theory in the Punch almanac for 1882. Image via Edward Linley Sambourne.

An enduring misconception

Having been around nearly 2,000 years, the idea of the scala naturae did not disappear during Darwin’s time. It might actually have been reinforced by something so unexpected as a cartoon. Illustrator Edward Linley Sambourne’s immensely popular caricature of evolution “Man Is But a Worm,” published in Punch’s Almanack for 1882, combined two concepts that were never linked in Darwin’s mind: gradualism and linearity.

Given centuries of religious belief in a “great chain of being,” the idea of linearity was an easy sell. The iconic version of this concept is, of course, the depiction of a supposed ape-to-human “progression.” Variations of all kinds have been made of this depiction, some with a humorous spirit, but most to ridicule the monkey-to-man theory.

A linear depiction of evolution may, consciously or not, confirm false preconceptions about evolution, such as intelligent design – the idea that life has an intelligent creator behind it. Historians can work to unravel how such a simple caricature could have helped distort Darwin’s theory. Meanwhile, science writers and educators face the challenge of explaining the gradual branching processes that explain the diversity of life.

While less pithy, it might be better for the public’s knowledge of science if these T-shirts and bumper stickers ditch the step by step images and use branching diagrams to make a more nuanced and correct point about evolution. Contrary to the Sambourne picture, evolution is better represented as a process producing continuous branching and divergence of populations of organisms.

Quentin Wheeler, Senior Fellow for Biodiversity Studies, State University of New York College of Environmental Science and Forestry; Antonio G. Valdecasas, Senior Researcher in Biodiversity at the Museo Nacional de Ciencias Naturales, CSIC – Consejo Superior de Investigaciones Científicas, and Cristina Cánovas, Biologist at the Natural History Museum in Madrid, CSIC – Consejo Superior de Investigaciones Científicas

This article is republished from The Conversation under a Creative Commons license. Read the original article.

Bottom line: Evolution does not proceed as an orderly march toward a preordained finish line.

The Conversation


from EarthSky https://ift.tt/316rSXq
Chimpanzee, walking ape, cave man with club, Neanderthal man with spear, blond modern man.

Evolution doesn’t proceed in a straight line. So why draw it that way? Image via Uncle Leo/Shutterstock.com.

By Quentin Wheeler, State University of New York College of Environmental Science and Forestry; Antonio G. Valdecasas, CSIC – Consejo Superior de Investigaciones Científicas, and Cristina Cánovas, CSIC – Consejo Superior de Investigaciones Científicas

Evolution doesn’t follow a preordained, straight path. Yet images abound that suggest otherwise. From museum displays to editorial cartoons, evolution is depicted as a linear progression from primitive to advanced.

You’ve certainly seen the pictures of a chimpanzee gradually straightening up and progressing through various hominids all the way to a modern human being. Yes, they can be humorous. But these kinds of popular representations about evolution get it all wrong.

Logo on a t-shirt. Illustration of band instruments and monkey-to-man sequence.

A high school marching band’s T-shirt places a horn-playing Homo sapiens at the end of the evolutionary process. Image via Brian Kloppenburg, Jordan Summers, Main Street Logo.

As three scholars of biodiversity and biology, these images bother us because they misrepresent how the process of evolution really works – and run the risk of reinforcing the public’s misconceptions.

Climbing a ladder to perfection

This misunderstanding is a holdover from before 1859, the year Charles Darwin first published his scientific theory of evolution via natural selection.

Antique etching of tower of created beings with plants at the bottom and angels at the top.

The scala naturae presents a hierarchy of creation. Image by Retorica Christiana, Didacus Valdes, 1579, via The Conversation.

Until then, the traditional view of how the world was organized was through a “progression in perfection.” This concept is explicit in the idea of the “great chain of being,” or “scala naturae” in Latin: All beings on earth, animate and inanimate, could be organized according to an increasing scale of perfection from, say, mushrooms at the bottom up through lobsters and rabbits, all the way to human beings at the top.

Originating with Plato and Aristotle, this view gets three main things wrong.

First, it holds that nature is organized hierarchically. It is not a random assortment of beings.

Secondly, it envisions two organizing criteria: things progress from simple to perfect and from primitive to modern.

And thirdly, it supposes there are no intermediary stages between levels in this hierarchy. Each level is a watertight compartment of similar complexity – a barnacle and a coral reef on the same rung are equally complex. No one is halfway between two steps.

In the 1960s a variation of the scala naturae conceived by Jesuit philosopher Pierre Teilhard de Chardin became popular. His idea was that, although life is somewhat branched, there is direction in evolution, a progression toward greater cognitive complexity and, ultimately, to identification with the divine, that is, God.

Gradual changes, in every direction

At least since Darwin, though, scientists’ idea of the world is organized through transitions – from inanimate molecules to life, from earlier organisms to different kinds of plants and animals, and so on. All life on Earth is the product of gradual transformations, which diversified and gave rise to the exuberance of organisms that we know today.

Two transitions are of particular interest to evolutionary biologists. There’s the jump from the inanimate to the animate: the origin of life. And there’s the appearance of the human species from a monkey ancestor.

Sequence of monkey, ape-man, photo of standing modern man (the author).

Book covers are just one place you might see a riff on this evolutionary march. Image via Howling at the Moon Press/Amazon.

The most popular way to represent the emergence of human beings is as linear and progressive. You’ve probably seen images, logos and political and social propaganda that draw on this representation.

But none of these representations capture the dynamics of Darwin’s theory. The one image he included in his book “On the Origin of Species” is a tree diagram, the branching of which is a metaphor for the way species originate, by splitting. The absence of an absolute time scale in the image is an acknowledgment that gradual change happens on timescales that vary from organism to organism based on the length of a generation.

A tree with yellow leaves and name of type of creature at the tip of every branch.

Forget a hierarchy – each organism alive now is the most evolved of its kind. Image via Zern Liew/Shutterstock.com.

According to Darwin, all current organisms are equally evolved and are all still affected by natural selection. So, a starfish and a person, for example, are both at the forefront of the evolution of their particular building plans. And they happen to share a common ancestor that lived about 580 million years ago.

Darwin’s theory doesn’t presuppose any special direction in evolution. It assumes gradual change and diversification. And, as evolution is still operating today, all present organisms are the most evolved of their kind.

Antique etching of many life forms with white-bearded bald man in center.

‘Man Is But A Worm’ caricature of Darwin’s theory in the Punch almanac for 1882. Image via Edward Linley Sambourne.

An enduring misconception

Having been around nearly 2,000 years, the idea of the scala naturae did not disappear during Darwin’s time. It might actually have been reinforced by something so unexpected as a cartoon. Illustrator Edward Linley Sambourne’s immensely popular caricature of evolution “Man Is But a Worm,” published in Punch’s Almanack for 1882, combined two concepts that were never linked in Darwin’s mind: gradualism and linearity.

Given centuries of religious belief in a “great chain of being,” the idea of linearity was an easy sell. The iconic version of this concept is, of course, the depiction of a supposed ape-to-human “progression.” Variations of all kinds have been made of this depiction, some with a humorous spirit, but most to ridicule the monkey-to-man theory.

A linear depiction of evolution may, consciously or not, confirm false preconceptions about evolution, such as intelligent design – the idea that life has an intelligent creator behind it. Historians can work to unravel how such a simple caricature could have helped distort Darwin’s theory. Meanwhile, science writers and educators face the challenge of explaining the gradual branching processes that explain the diversity of life.

While less pithy, it might be better for the public’s knowledge of science if these T-shirts and bumper stickers ditch the step by step images and use branching diagrams to make a more nuanced and correct point about evolution. Contrary to the Sambourne picture, evolution is better represented as a process producing continuous branching and divergence of populations of organisms.

Quentin Wheeler, Senior Fellow for Biodiversity Studies, State University of New York College of Environmental Science and Forestry; Antonio G. Valdecasas, Senior Researcher in Biodiversity at the Museo Nacional de Ciencias Naturales, CSIC – Consejo Superior de Investigaciones Científicas, and Cristina Cánovas, Biologist at the Natural History Museum in Madrid, CSIC – Consejo Superior de Investigaciones Científicas

This article is republished from The Conversation under a Creative Commons license. Read the original article.

Bottom line: Evolution does not proceed as an orderly march toward a preordained finish line.

The Conversation


from EarthSky https://ift.tt/316rSXq

Could microbes be affecting Venus’ climate?

Blue planet with darker blue stripes and large green patches.

Composite image of Venus’ atmosphere from the Japanese probe Akatsuki (Venus Climate Orbiter). Dark patches in the atmosphere are still unexplained, but appear to affect the planet’s albedo and climate. Image via Institute of Space And Astronautical Science/Japan Aerospace Exploration Agency/University of Wisconsin-Madison.

Despite being Earth’s closest planetary neighbor, Venus is still literally shrouded in mystery. Although multiple spacecraft have orbited and landed on this hellish world, the extreme conditions make such visits, the surface ones at least, very brief. But one of Venus’ most interesting anomalies is higher up: odd dark patches in the upper atmosphere that still haven’t been explained.

Now, a new study shows that these patches – called “unknown absorbers” – appear to be linked to Venus’ climate and albedo.

The peer-reviewed study was published in The Astronomical Journal on August 26, 2019.

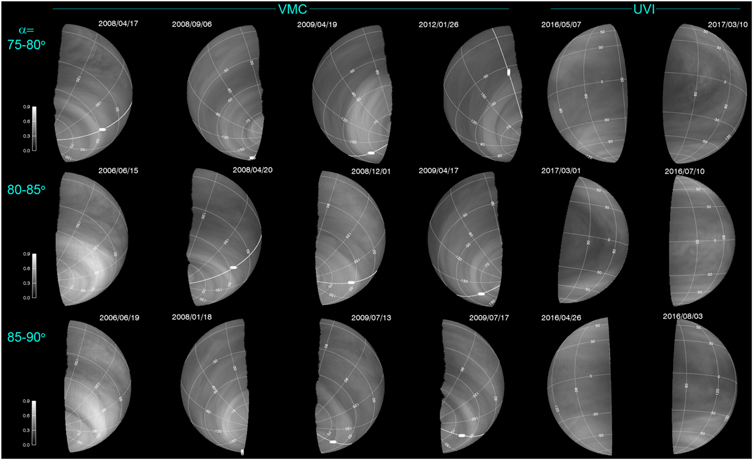
The patches are composed of tiny particles that soak up most of the ultraviolet and some of the visible light from the sun, affecting the planet’s albedo and energy budget.

18 grayscale images of Venus showing lighter and darker areas of the atmosphere.

Albedo changes in the top cloud layers of Venus’ atmosphere, as seen by Venus Express and Akatsuki between 2006 and 2017. Image via Yeon Too Lee et al/The Astronomical Journal.

These changes in the reflectivity of Venus’ perpetual cloud cover then affect Venus’ weather patterns and climate. Just like Earth, Venus’ weather is driven by solar radiation. As outlined in the new study, scientists now have a better idea of how that weather is influenced by changing reflectivity in the clouds. The researchers used a suite of satellites to monitor the long-term variations in ultraviolet light. As Sanjay Limaye, a planetary scientist at University of Wisconsin–Madison, explained:

The difference between Earth and Venus is that on Earth most of the energy from the sun is absorbed at ground level while on Venus most of the heat is deposited in the clouds.

Venus’ albedo had been observed to diminish by about half between 2006 and 2017, before then returning to normal. This affected the upper atmosphere, including variations in the “super-rotation,” which is driven by winds exceeding 200 miles per hour (322 kph). This is evidence for a link between solar heating and the powerful gusts that underpin the dynamics of the planet’s upper atmosphere. According to Mark Bullock of the Southwest Research Institute:

What really struck me about this paper is that it shows that Venus’ climate has decadal-long climate variations, just like the Earth. Even more amazing, the strength of the climate oscillation on Venus is much greater than Earth’s long-term variations.

Yellow-brown planet with streaked darker and lighter clouds in fuzzy bands.

Venus as seen in ultraviolet by the Pioneer-Venus Orbiter in 1979. Image via NASA/Phys.org.

Limaye added:

That is a striking result. It suggests that something is changing. We can see the change in brightness. If the albedo is changing, something is driving those changes. The question is, what is the cause?

While it has been shown that the patches can affect Venus’ climate and albedo, it still isn’t known exactly what they are. Various theories have been postulated, as Yeon Joo Lee, senior author of the new paper, noted:

The particles that make up the dark splotches, have been suggested to be ferric chloride, allotropes of sulfur, disulfur dioxide and so on, but none of these, so far, are able to satisfactorily explain their formation and absorption properties.

Lee posed further questions about Venus’ atmospheric dynamics:

Is solar ultraviolet light impacting Venus’ cloud cover? Are cosmic rays – subatomic particles from space that continuously rain down on all the planets – affecting cloud cover by triggering cloud nucleation? Would the planetary sulfuric dioxide affect the formation of sulfuric acid cloud?

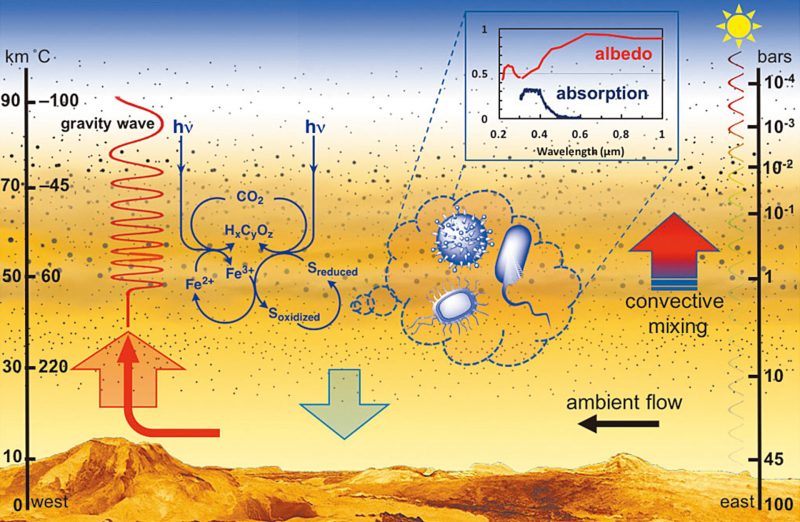
Diagram of many heat exchange possibilities in Venus atmosphere.

The most tantalizing possibility to explain the dark patches is that they are composed of microorganisms, similar to ones that inhabit Earth’s upper atmosphere. Image via Limaye et al, doi: 10.1089/ast.2017.1783/Sci-News.

But there is another possibility – also mentioned by no less than biophysicist Harold Morowitz and astronomer Carl Sagan – that the particles in the patches could be microscopic life. Yes, microbes, floating in the upper atmosphere of the hottest planet in the solar system. This may sound far-fetched, especially for Venus, but Limaye himself noted that observations indicate the particles are about the same size and have the same light-absorbing properties as microorganisms found in Earth’s atmosphere. This isn’t proof of life, not yet anyway, but it is a tantalizing thought. Conditions in the upper atmosphere of Venus are actually quite hospitable temperature- and pressure-wise, with more water vapor available.

An earlier study by Limaye revisited this old idea. As he noted:

Venus shows some episodic dark, sulfuric rich patches, with contrasts up to 30-40% in UV, and muted in longer wavelengths. These patches persist for days, changing their shape and contrasts continuously and appear to be scale dependent. The patches could be something akin to the algae blooms that occur routinely in the lakes and oceans of Earth.

Whatever the explanation is, as of now there are still a lot of questions.

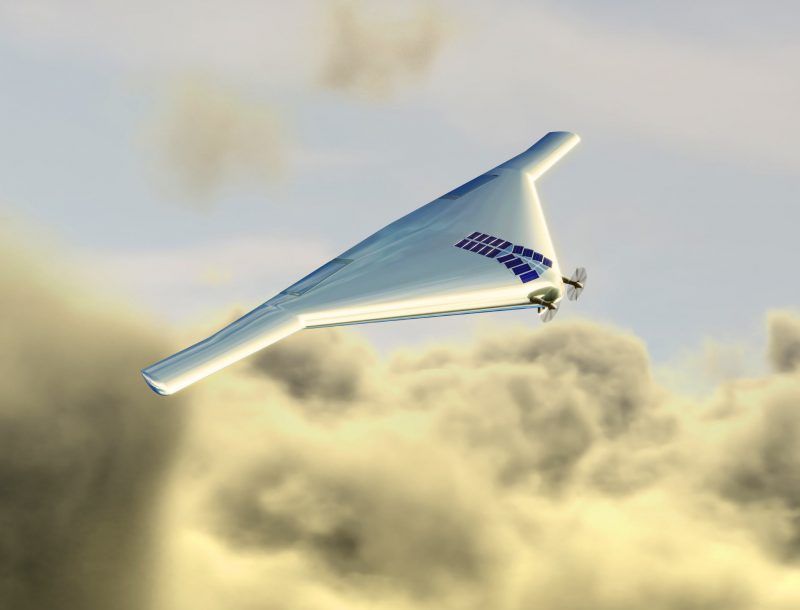
Flying wing aircraft with two small propellers and solar panels on top above clouds.

Another mission will be needed to solve the mystery of Venus’ dark patches, perhaps like the proposed Venus Atmospheric Maneuverable Platform (VAMP). Image via Northrop Grumman.

The only way to definitively solve this mystery will be to return to Venus, perhaps with specialized CubeSats or the Venus Atmospheric Maneuverable Platform (VAMP). According to Limaye:

One possibility for sampling the clouds of Venus is on the drawing board – the Venus Atmospheric Maneuverable Platform (VAMP) – a craft that flies like a plane but floats like a blimp and could stay aloft in the planet’s cloud layer for up to a year gathering data and samples. Such a platform could include instruments like Raman Lidar, meteorological and chemical sensors, and spectrometers. It could also carry a type of microscope capable of identifying living microorganisms.

Bottom line: Scientists have found that unusual dark patches in Venus’ atmosphere affect the planet’s climate, but they don’t know what those patches actually are. Some studies suggest they may be composed of microbes.

Source: Long-term Variations of Venus’s 365 nm Albedo Observed by Venus Express, Akatsuki, MESSENGER, and the Hubble Space Telescope

Source: Venus’ Spectral Signatures and the Potential for Life in the Clouds

Via University of Wisconsin-Madison News


from EarthSky https://ift.tt/2zQXq7H

When did humans start altering Earth?

Steep hillsides with miles of water-filled terraces, among forested mountains.

People have been modifying Earth – as with these rice terraces near Pokhara, Nepal – for millennia. The ArchaeoGlobe Project assessed archaeological knowledge on human land use across the globe over the past 10,000 years through the expert knowledge contributions of more than 200 archaeologists. Data were obtained for 4 land use categories: Foraging/hunting/gathering/fishing, Extensive agriculture, Intensive agriculture, and Pastoralism. Image via Erle C. Ellis.

By Ben Marwick, University of Washington; Erle C. Ellis, University of Maryland, Baltimore County; Lucas Stephens, Max Planck Institute for the Science of Human History, and Nicole Boivin, Max Planck Institute for the Science of Human History

Examples of how human societies are changing the planet abound – from building roads and houses, clearing forests for agriculture and digging train tunnels, to shrinking the ozone layer, driving species extinct, changing the climate and acidifying the oceans. Human impacts are everywhere. Our societies have changed Earth so much that it’s impossible to reverse many of these effects.

Aerial view of glowing mushroom cloud with ring of explosive cloud around it.

Nuclear bomb testing left its mark in the geologic record. Image via National Nuclear Security Administration/Wikimedia Commons.

Some researchers believe these changes are so big that they mark the beginning of a new “human age” of Earth history, the Anthropocene epoch. A committee of geologists has now proposed to mark the start of the Anthropocene in the mid-20th century, based on a striking indicator: the widely scattered radioactive dust from nuclear bomb tests in the early 1950s.

But this is not the final word.

Not everyone is sure that today’s industrialized, globalized societies will be around long enough to define a new geological epoch. Perhaps we are just a flash in the pan – an event – rather than a long, enduring epoch.

Others debate the utility of picking a single thin line in Earth’s geological record to mark the start of human impacts in the geological record. Maybe the Anthropocene began at different times in different parts of the world. For example, the first instances of agriculture emerged at different places at different times, and resulted in huge impacts on the environment, through land clearing, habitat losses, extinctions, erosion and carbon emissions, forever changing the global climate.

Night view of smoky forest fire with trees silhouetted in front of it.

Human practices like burning the landscape – as in this night bush fire outside Kabwe, Zambia – have been affecting the Earth since long before the nuclear era. Image via Andrea Kay.

If there are multiple beginnings, scientists need to answer more complicated questions – like when did agriculture begin to transform landscapes in different parts of the world? This is a tough question because archaeologists tend to focus their research on a limited number of sites and regions and to prioritize locations where agriculture is believed to have appeared earliest. To date, it has proved nearly impossible for archaeologists to put together a global picture of land use changes throughout time.

Global answers from local experts

To tackle these questions, we pulled together a research collaboration among archaeologists, anthropologists and geographers to survey archaeological knowledge on land use across the planet.

We asked over 1,300 archaeologists from around the world to contribute their knowledge on how ancient people used the land in 146 regions spanning all continents except Antarctica from 10,000 years ago right up to 1850. More than 250 responded, representing the largest expert archaeology crowdsourcing project ever undertaken, though some prior projects have worked with amateur contributions.

Our work has now mapped the current state of archaeological knowledge on land use across the planet, including parts of the world that have rarely been considered in previous studies.

We used a crowdsourcing approach because scholarly publications don’t always include the original data needed to allow global comparisons. Even when these data are shared by archaeologists, they use many different formats from one project to another, making it difficult to combine for large-scale analysis. Our goal from the beginning was to make it easy for anyone to check our work and reuse our data – we’ve put all our research materials online where they can be freely accessed by anyone.

Earlier and more widespread human impacts

Though our study acquired expert archaeological information from across the planet, data were more available in some regions – including Southwest Asia, Europe, northern China, Australia and North America – than in others. This is probably because more archaeologists have worked in these regions than elsewhere, such as parts of Africa, Southeast Asia and South America.

World map. Agriculture spreading from Middle East to cover nearly entire world.

View larger. | Animation showing the spread of intensive agriculture across the globe over the past 10,000 years, based on ArchaeoGLOBE Project results. Image via Nicolas Gauthier, 2019.

Our archaeologists reported that nearly half (42%) of our regions had some form of agriculture by 6,000 years ago, highlighting the prevalence of agricultural economies across the globe. Moreover, these results indicate that the onset of agriculture was earlier and more widespread than suggested in the most common global reconstruction of land-use history, the History Database of the Global Environment. This is important because climate scientists often use this database of past conditions to estimate future climate change; according to our research it may be underestimating land-use-associated climate effects.

Our survey also revealed that hunting and foraging was generally replaced by pastoralism (raising animals such as cows and sheep for food and other resources) and agriculture in most places, though there were exceptions. In a few areas, reversals occurred and agriculture did not simply replace foraging but merged with it and coexisted side by side for some time.

Rolling countryside with patchwork of green fields, distant mountains.

View of the Kopaic Plain in Boeotia, Greece. People first partially drained the area 3,300 years ago to claim land for agriculture and it’s still farmed today. Image via Lucas Stephens.

The deep roots of the Anthropocene

Global archaeological data show that human transformation of environments began at different times in different regions and accelerated with the emergence of agriculture. Nevertheless, by 3,000 years ago, most of the planet was already transformed by hunter-gatherers, farmers and pastoralists.

To guide this planet toward a better future, we need to understand how we got here. The message from archaeology is clear. It took thousands of years for the pristine planet of long ago to become the human planet of today.

And there is no way to fully understand this human planet without building on the expertise of archaeologists, anthropologists, sociologists and other human scientists. To build a more robust Earth science in the Anthropocene, the human sciences must play as central a role as the natural sciences do today.

Ben Marwick, Associate Professor of Archaeology, University of Washington; Erle C. Ellis, Professor of Geography and Environmental Systems, University of Maryland, Baltimore County; Lucas Stephens, Research Affiliate in Archaeology, Max Planck Institute for the Science of Human History, and Nicole Boivin, Director of the Department of Archaeology, Max Planck Institute for the Science of Human History

This article is republished from The Conversation under a Creative Commons license. Read the original article.

Bottom line: Surveying archaeologists across the globe reveals deeper and more widespread roots of the human age, the Anthropocene.

The Conversation


from EarthSky https://ift.tt/32li2Bo

Young moon, stars, a planet September 3-5

As darkness falls on September 3 and 4, 2019, watch for the waxing crescent moon to travel in front of the constellation Libra the Scales, past Libra’s alpha star Zubenelgenubi and famous green star Zubeneschamali. Then, as the moon continues going eastward in its orbit around Earth, it’ll sweep up toward the star Antares – the Heart of the Scorpion in Scorpius and a red supergiant star – and the very bright planet Jupiter.

The moon will sweep to the north of Antares and Jupiter on or near September 5, 2019.

Visit Heavens-Above to find out which constellation presently backdrops the moon

If your western sky is clear after sunset, you should have little trouble spotting the brightest of these objects at dusk. The moon and Jupiter will be the brightest objects you’ll see in the western twilight sky. After all, the moon ranks as the second-brightest celestial body to light up the heavens, after the sun; and Jupiter is the fourth-brightest celestial body, after the planet Venus. However, Venus is now lost in the sun’s glare, so Jupiter reigns supreme as the evening “star” throughout September 2019.

Antares should be relatively easy to spot, too. Watch for it to pop out in the deepening evening twilight in the vicinity of Jupiter. Although Antares serves as a prime example of a respectably bright 1st-magnitude star, this star pales next to Jupiter, which outshines Antares by nearly 20 times.

Giant Antares bigger than orbit of Mars, next to small Arcturus and sun as tiny dot.

If Antares replaced the sun in our solar system, its circumference would extend beyond the orbit of the fourth planet, Mars. Here, Antares is shown in contrast to another star, Arcturus, and our sun. Image via Wikimedia Commons.

Libra’s two brightest stars – Zubenelgenubi and Zubeneschamali – are fainter and will be tougher to see. On or near September 3, the moon swings to the north of the star Zubenelgenubi and to the south of the star Zubeneschamali. If need be, use binoculars to sweep around the moon that night, to reel in these two Libra stars. They are only modesty bright, some four to five times fainter than the 1st-magnitude star Antares. As the sky darkens, though, Libra’s two brightest stars should become visible to the eye alone, briefly, before they follow the sun below the western horizon.

What is stellar magnitude?

And while you’re at it, take a good look at Zubenelgenubi with binoculars, and you’ll see that it’s a double star. Sometimes, a double star consists of two physically unrelated stars that lie along the same line of sight. But in this case, Zubenelgenubi is thought to be a true binary star – two stars orbiting a common center of mass.

Zubenelgenubi is easily split into its two component stars with ordinary binoculars, even though this binary star is 77 light-years away. The two stars in this binary system reside at a mean distance of approximately 5,500 astronomical units (AU) apart (one AU = sun/Earth distance). The orbital period may be as long as 200,000 years. The cool thing about any binary star is that you can find out its mass, if you know how far apart the two component stars are and how long they take to orbit one another.

How a binary star reveals its mass

Star chart with stars in black on white showing constellation Libra the Scales.

Sky chart of the constellation Libra the Scales via IAU (International Astronomical Union).

The combined mass of the two stars in a binary system can be computed (in solar masses) if you know their mean distance apart (in astronomical units) and their orbital period (in Earth-years). Although the mean distance and orbital period of this binary star aren’t known with precision, we’ll assume a mean distance of 5,500 AU, and an orbital period of 200,000 years.

We can use the equation below to figure out the mass of Zubenelgenubi, the binary star, in solar masses, where a = mean distance = 5,500 AU, and p = orbital period = 200,000 years:

Mass = a3/p2
Mass = 5,500 x 5,500 x 5,500/200,000 x 200,000
Mass = 166,380,000,000/40,000,000,000
Mass = 4.159 solar masses

Bottom line: As darkness falls these next few evenings – September 3, 4 and 5, 2019 – watch for the waxing crescent moon traveling in front of the constellation Libra the Scales. The moon heads eastward, as it always does in its orbit around Earth. It’ll sweep past the star Zubenelgenubi, then head toward the red star Antares and bright planet Jupiter.


from EarthSky https://ift.tt/2HG1hJs

Skeptical Science New Research for Week #35, 2019

62 articles, with 11 freely available

Nearer and dearer

Emerging research on "psychological proximity" and climate change appears to be identifying relationships of physical and temporal distance of human thinkers to climate change effects with more or less acceptance of the reality of global warming and  interest in addressing the problem. In a variation on that theme, this week's article by Dannenberg and Zitzelberger Climate experts’ views on geoengineering depend on their beliefs about climate change impacts appears to reveal an intriguing feature of expert thinking on geoengineering:

We find that respondents who expect severe global climate change damages and who have little confidence in current mitigation efforts are more opposed to geoengineering than respondents who are less pessimistic about global damages and mitigation efforts. However, we also find that respondents are more supportive of geoengineering when they expect severe climate change damages in their home country than when they have more optimistic expectations for the home country. Thus, when respondents are more personally affected, their views are closer to what rational cost–benefit analyses predict. 

Articles: 

Biological effects of global warming

Shortened temperature‐relevant period of spring leaf‐out in temperate‐zone trees

Diverging phenological responses of Arctic seabirds to an earlier spring

How Eddy Covariance Flux Measurements Have Contributed to Our Understanding of Global Change Biology

Nearshore coral growth declining on the Mesoamerican Barrier Reef System

Integrating patterns of thermal tolerance and phenotypic plasticity with population genetics to improve understanding of vulnerability to warming in a widespread copepod

The functional role of temperate forest understorey vegetation in a changing world

Climate change alters elevational phenology patterns of the European spruce bark beetle (Ips typographus)

Divergent shifts in peak photosynthesis timing of temperate and alpine grasslands in China

Global warming threatens conservation status of alpine EU habitat types in the European Eastern Alps (open access)

Insights from present distribution of an alpine mammal Royle’s pika ( Ochotona roylei ) to predict future climate change impacts in the Himalaya

Refugia under threat: Mass bleaching of coral assemblages in high‐latitude eastern Australia

Nitrogen limitation inhibits marine diatom adaptation to high temperatures

A global ‘greening’ of coastal dunes: An integrated consequence of climate change?

Humans deal with our global warming

A carbon price by another name may seem sweeter: Consumers prefer upstream offsets to downstream taxes

Hungry cities: how local food self-sufficiency relates to climate change, diets, and urbanisation (open access)

Tracing country commitment to Indigenous peoples in the UN Framework Convention on Climate Change

Priming critical thinking: Simple interventions limit the influence of fake news about climate change on Facebook

“Bring fishermen at the center”: the value of local knowledge for understanding fisheries resources and climate-related changes in Lake Tanganyika

Climate change impact and vulnerability assessment of Mumbai city, India

Derivation of a climate change adaptation index and assessing determinants and barriers to adaptation among farming households in Nepal

Flood insurance arrangements in the European Union for future flood risk under climate and socioeconomic change

Social cohesion and passive adaptation in relation to climate change and disease

More than meets the eye: a longitudinal analysis of climate change imagery in the print media (open access)

Could Bitcoin emissions push global warming above 2 °C?

Implausible projections overestimate near-term Bitcoin CO2 emissions

Climate change impacts on banana yields around the world

Climate experts’ views on geoengineering depend on their beliefs about climate change impacts

Climate and food goals

Potential influence of climate change on grain self‐sufficiency at the country level considering adaptation measures (open access)

Towards calibrated language for effectively communicating the results of extreme event attribution studies (open access)

Intensification of thermal risk in Mediterranean climates: evidence from the comparison of rational and simple indices

Extreme events and climate adaptation‐mitigation linkages: Understanding low‐carbon transitions in the era of global urbanization

Climate change, natural hazards, and relocation: insights from Nabukadra and Navuniivi villages in Fiji

Enhancing the value of adaptation reporting as a driver for action: lessons from the UK (open access)

Policy implications for achieving the carbon emission reduction target by 2030 in Japan-Analysis based on a bilevel equilibrium model

Modelling of energy consumption and carbon emission from the building construction sector in China, a process-based LCA approach

Expansion of coccidioidomycosis endemic regions in the United States in response to climate change (open access)

Physical science of global warming

The Mid‐Summer Drought over Mexico and Central America in the 21st Century

Greenhouse gas flux from stormwater ponds in southeastern Virginia (USA)

A canary in the Southern Ocean

Enhanced oceanic CO2 uptake along the rapidly changing West Antarctic Peninsula

Impacts of Ocean Warming, Sea Level Rise and Coastline Management on Storm Surge in a Semi‐enclosed Bay

Impacts of climate change on volcanic stratospheric injections: comparison of 1D and 3D plume model projections

A comparative analysis of anthropogenic CO2 emissions at city level using OCO‐2 observations: A global perspective (open access)

The Carbon Balance of the Southeastern U.S. Forest Sector as Driven by Recent Disturbance Trends

Constraining Climate Model Projections of Regional Precipitation Change

Analysis of the atmospheric water budget for elucidating the spatial scale of precipitation changes under climate change

Temperature-driven rise in extreme sub-hourly rainfall

POLSTRACC: Airborne experiment for studying the Polar Stratosphere in a Changing Climate with the high-altitude long-range research aircraft HALO (open access)

A significant bias of Tmax and Tmin average temperature and its trend

Causes for the Century-Long Decline in Colorado River Flow

The longest homogeneous series of grape harvest dates, Beaune 1354–2018, and its significance for the understanding of past and present climate (open access)

Ad hoc estimation of glacier contributions to sea-level rise from latest glaciological observations (open access)

Climate change study for the meteorological variables in the Barak River basin in North-East India

Snow and Climate: Feedbacks, Drivers, and Indices of Change

Stabilization of dense Antarctic water supply to the Atlantic Ocean overturning circulation

Modeling of global warming

A Systematic Approach to Assessing the Sources and Global Impacts of Errors in Climate Models

LongRunMIP – motivation and design for a large collection of millennial-length AO-GCM simulations (open access)

Suggestions

Please let us know if you're aware of an article you think may be of interest for Skeptical Science research news, or if we've missed something that may be important. Send your input to Skeptical Science via our contact form.

The previous edition of Skeptical Science new research may be found here. 


from Skeptical Science https://ift.tt/2ZvlufF

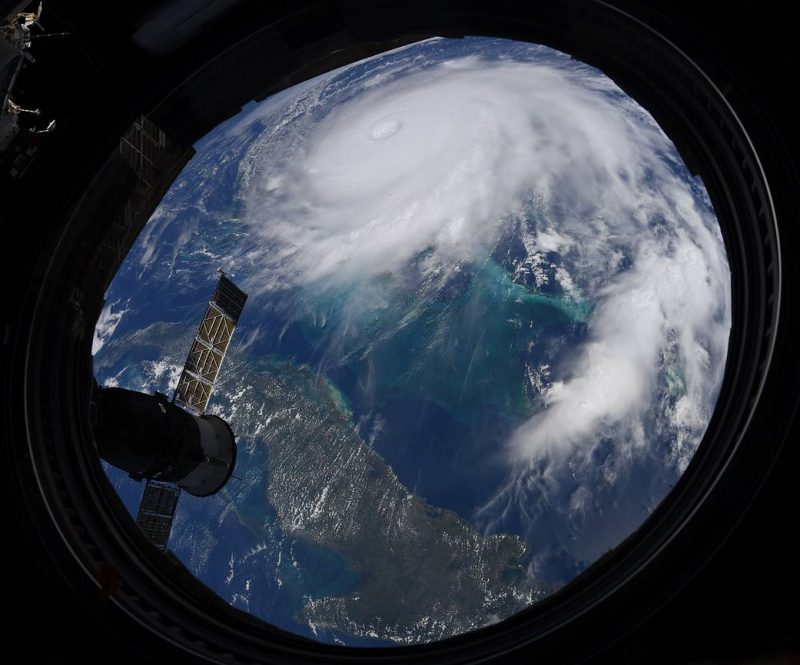
Hurricane Dorian viewed from space

View from a round window aboard ISS of a powerful, swirling hurricane in the Atlantic.

Hurricane Dorian, September 2, 2019, from the International Space Station. According to the Washington Post, this storm is one for the record books, having set milestones for the strongest hurricane at landfall (185 mph winds, tied for strongest winds with a 1935 hurricane, also on Labor Day). It is also the 2nd-strongest hurricane observed in the Atlantic based on wind speed alone. Image via NASA.


from EarthSky https://ift.tt/2ZF87c1

2019 SkS Weekly Climate Change & Global Warming News Roundup #35

A chronological listing of news articles linked to on the Skeptical Science Facebook Page during the past week, i.e., Sun, Aug 25 through Sat, Aug 31, 2019

Editor's Pick

Hurricane Dorian is a powerful Category 4 hurricane — pummeling the Bahamas and heading “dangerously close” to Florida

A worst-case scenario is playing out the Bahamas. Florida and the Southeast US may be spared the worst. But uncertainties remain.

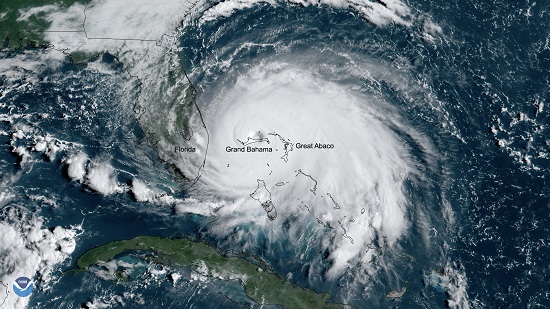
Hurricane Dorian over Grand Bahama Island on 09-02-19

Hurricane Dorian on September 2. NOAA/NESDIS/STAR

On Monday, Hurricane Dorian slammed into the Abacos Islands in the Bahamas as an incredibly powerful Category 5 hurricane, with howling winds in excess of 185 mph and with gusts up to 220 mph. The storm brought with it a surge — coastal flooding — of 18-to-23 feet above normal tide.

Dorian is estimated to be the second-most powerful hurricane ever recorded in the Atlantic Ocean, and ties the record for the most powerful storm to make landfall, according to the National Weather Service. Preliminary reports from the Abacos Islands show extreme devastation.

The storm weakened slightly and was (very slowly) moving through Grand Bahama Island on Monday, with winds gusting over 200 mph and 18 to 23 feet of coastal flooding. Plus, the forward motion of the storm nearly stalled, moving west at just 1 mph. The slower a storm moves, the more time it has to destroy communities in its path. It’s a worst-case scenario for a hurricane.

Hurricane Dorian is a powerful Category 4 hurricane — pummeling the Bahamas and heading "dangerously close" to Florida by Brian Resnick, Energy & Environment, Vox, Sep 2, 2019

Click here to access the entire article as posted on Vox. 


Links posted on Facebook

Sun Aug 25, 2019

Mon Aug 26, 2019

Tue Aug 27, 2019

Wed Aug 28, 2019

Thu Aug 29, 2019

Fri Aug 30, 2019

Sat Aug 31, 2019

[On Vacation]


from Skeptical Science https://ift.tt/311m9T7